Commoditytrading
Silver in Dollar strength's shadowXAGUSD, H4 and Daily
By Andria Pichidi - November 12, 2018
Recent US data, such as last Friday's hot PPI numbers, and the Fed's policy guidance following last week's FOMC meeting, have fanned expectations for a resumption in Fed tightening at December's policy meeting, which has underpinned the US currency. The USDIndex has gained 0.5% in posting a 17-month high of 97.38, while EURUSD has concurrently printed a 16-month low of 1.1268 and USDJPY a 6-week high at 114.20.
This drags commodities to week lows, with Silver futures near $14.10, on USDIndex strength, despite the risk-off theme. The Chinese economy, which is slowing faster than expected amid growing risk that the country will have to backstop its economy with further measures to slow the outgoing tide, risking increased debt to do so, has underpinned commodities as well.
On Friday, the XAGUSD confirmed a close below the descending triangle set since June and the up-channel formed since end of September. This decisive move below the 2-month Support at around $14.20-14.22 area, and as the pair remains below this barrier so far today, assured the switch from neutral to negative outlook.
According to the momentum indicators, the market could maintain negative momentum in the short-term as the RSI flattened below 30, while the MACD oscillator posted a bearish crossover with its signal line in the 4-hour chart. Meanwhile, the MAs formed a bearish cross, with both 20-and 50-period MA crossing below 200-period MA. In the daily timeframe, XAGUSD’s picture is neutral to negative as RSI sloped below neutral, whilst MACD turned negative with signal line consolidating around neutral zone.
As the asset confirmed a leg below $14.20 on Friday, the market could retest the next hurdle at the round $14.00 level, but more precisely September’s low at $13.93. In the wake of more negative momentum, the next level in focus could be at the 2-year low of $13.73. To the upside immediate Resistance holds at $14.22, and the medium term at 20-day SMA at $14.50.
Andria Pichidi
Market Analyst
HotForex
Disclaimer: This material is provided as a general marketing communication for information purposes only and does not constitute an independent investment research. Nothing in this communication contains, or should be considered as containing, an investment advice or an investment recommendation or a solicitation for the purpose of buying or selling of any financial instrument. All information provided is gathered from reputable sources and any information containing an indication of past performance is not a guarantee or reliable indicator of future performance. Users acknowledge that any investment in FX and CFDs products is characterized by a certain degree of uncertainty and that any investment of this nature involves a high level of risk for which the users are solely responsible and liable. We assume no liability for any loss arising from any investment made based on the information provided in this communication. This communication must not be reproduced or further distributed without our prior written permission.

Crude Oil (Daily Chart) - Time for a Rebound!After a prolonged bearish sell down, this counter might be overdue for a rebound, which we might see this week.
There is strong support at the $60 level, and prices have deviated very far from the 20-EMA, which is a sign of it being oversold.
The overall trend is still bearish, and if it does rebound, I would expect the sellers to step back in at around $64 to resume the downtrend.
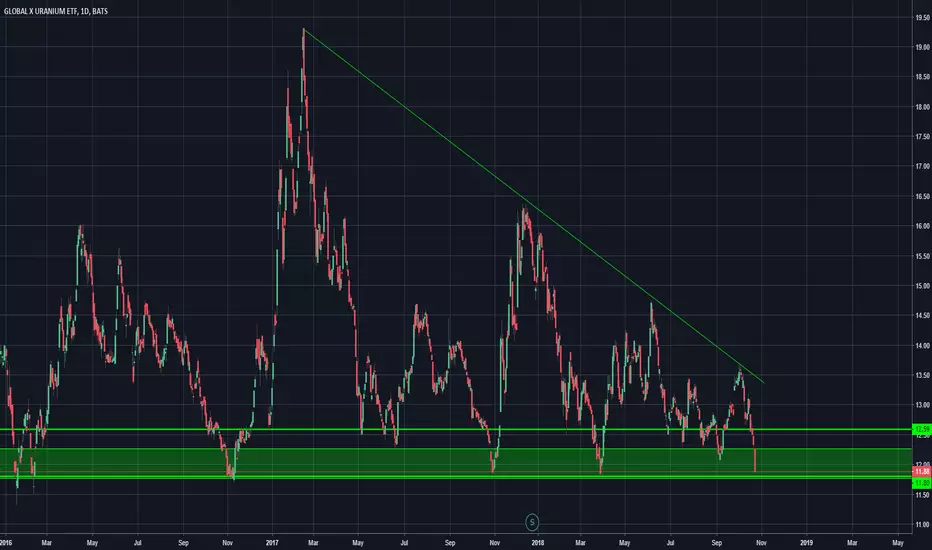
URA Big Opportunity URA Back in the buy zone and it will only be there for so long. Get it while you can.
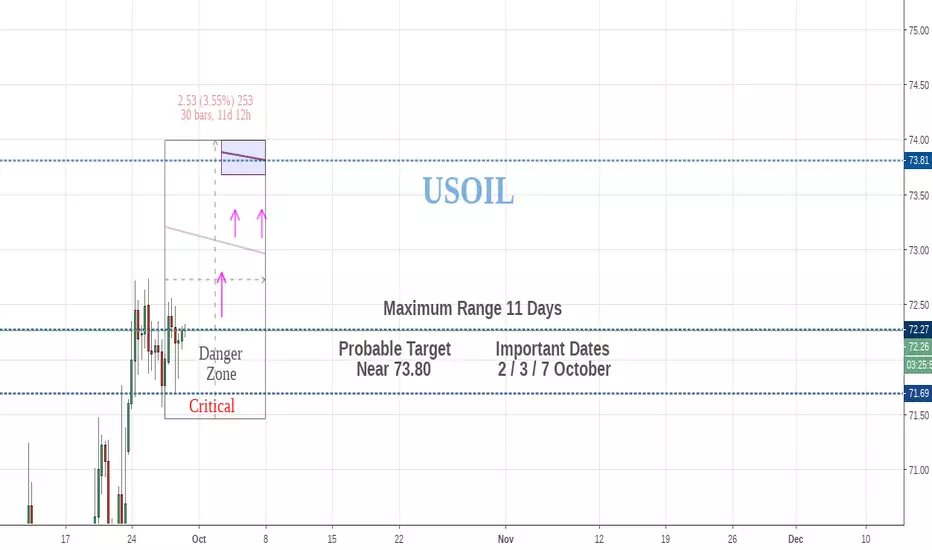
USOIL 73.80 next week?This is a dangerous move, the price is well supported, but it looks like is floating and something is missing.
The main problem I see is that the "Danger zone" between supports is very broad and represents a lot of money, but let's see how it develops.
Follow your own plan.
Best wishes all.
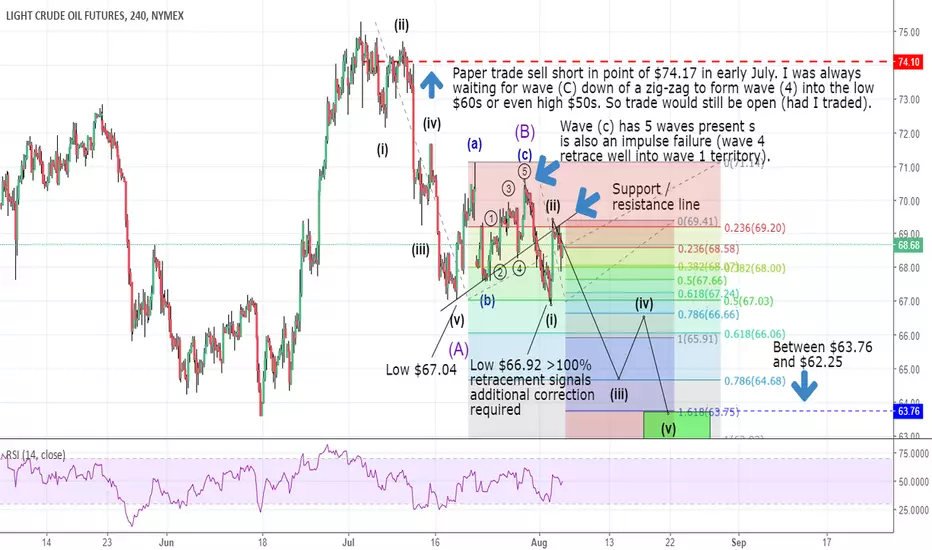
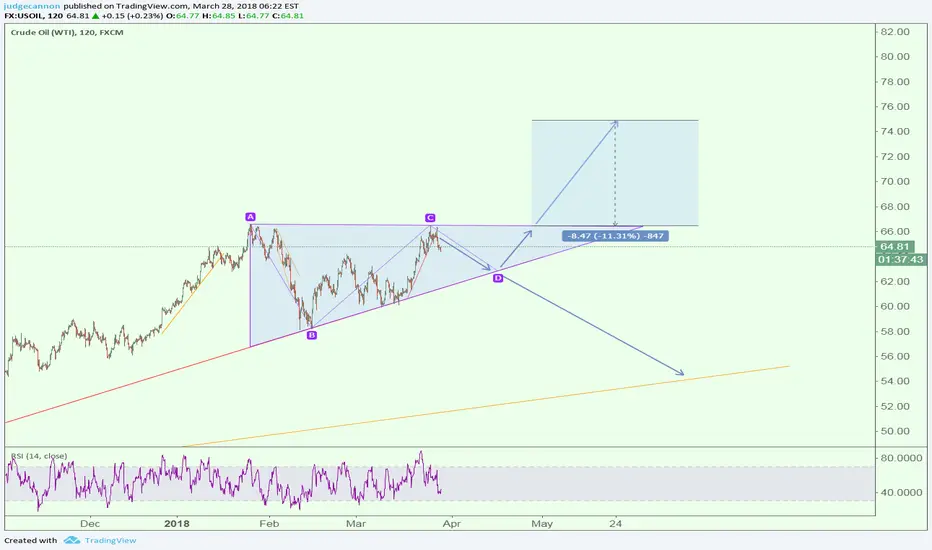
Light Crude short trade update - stay in positionI posted a crude oil set-up as one of my first few posts on tradingview as when in the low-$70s Crude was showing significant bearish RSI divergence and was clearly topping out a primary (or whatever scale) wave 3 up and would be correcting to create wave 4 with an ABC.
At that time I didn't post using the Nymex light crude CL1! chart (despite my own analysis having been done on the Nymex chart - my own paper trade (unpublished) shorted crude at $74.17 on the 4th of July). The wave formation on this commodity and the previous one I posted are quite different.
At this stage I believe we are only half-way through a zig-zag correction. What we know:
- There has been a 5-wave correction,
- This correction was followed by a smaller abc correction,
- All 3 abc waves seem to be present,
- If it was wave c - it has the required 5 waves of a wave c,
- Following the abc correction the price has already exceeded the wave (v) / (A) extreme - pointing to further correction needed,
- This appears to be followed by the formation of wave i and ii down.
These together seem to suggest that we have started wave 3 (iii) in a 5 wave wave (C) move downwards. The green box denotes where I would close this short (bear in ind that wave 5 of 5 tends to be extended in commodities) as a conservative estimate based on a 1:1 extension of wave (A) (extended from both the wave b and c extreme to get a range) as well as the 1.618 extension of wave i down. I will seek out a platform on which to trade this commodity due to this set-up. Because I am a little late, I would enter on a break below wave i ($66.92 low) down to catch wave iii, iv, and v down).
While I use different wave degrees I use them mostly to just denote smaller, larger scales, and sub-waves. I am not trying to be accurate with my wave degrees. This is 100% technical analysis and 0% fundamental anaysis.
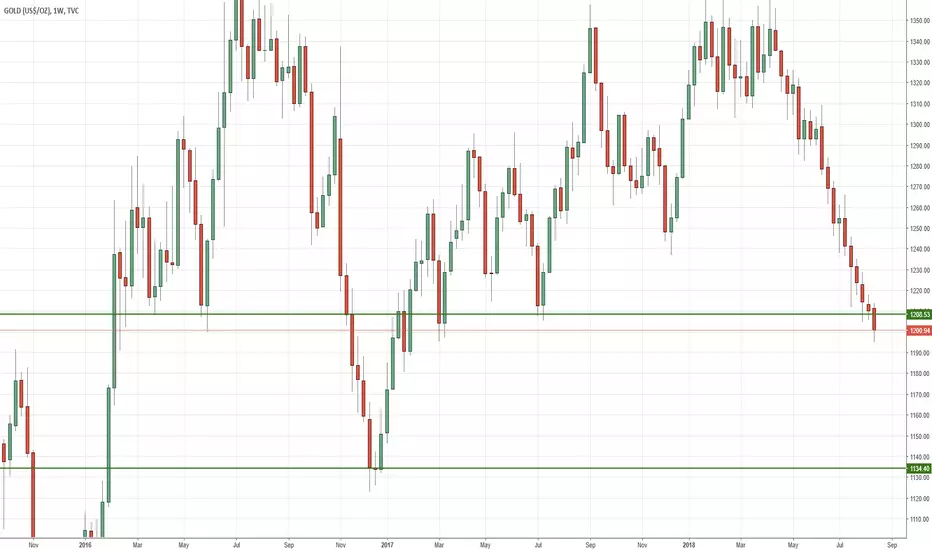
GOLD TO FALL FURTHER BECAUSE OF THE DOLLAR For the past couple of weeks, Gold has been dropping like a rock and this has got me thinking that there could be further movement to the downside for the next couple of weeks to come if not months.
In this post, I'm going to give my analysis of why I think selling Gold will be a good trade. Before i proceed any further, let me emphasize that this is just to give you an idea of how things are likely to play out and
that this post is not a trade recommendation. This post is going to be in two phases; the fundamental outlook and the technical outlook.
Now from a fundamental perspective, Gold has an inverse relationship with the U.S dollar. What this means is that when the U.S dollar rises, Gold tends to drop. This is so because Gold is priced in U.S dollars
and when the U.S dollar becomes strong, it makes buying Gold expensive. Very simple as that. You might probably know that the Federal reserve has signalled to the markets that it plans to increase interest rates at
least twice this year which has caused massive capital inflows into the U.S dollar. Now the strength hasn't been just because of the Federal reserve but also trade tensions. Market participants are looking at the Dollar
as a safe currency to hold in these times. All of this has resulted in the strength of the U.S Dollar.
From a technical perspective, the XAU/USD pair (Daily timeframe) is hovering around the weekly support of 1194.80. A break below this level will see the pair(XAU/USD) drop further to 1142.0000 -1140.00 region.
For now all we have to do is wait and see how price will perform. I hope this has given you some insight. See you soon with another post.
Silver hort-term analysis target Just got stopped into a short trade. Will target 15.221 as both the larger degree and smaller degree wave 1 extensions put the 1.618 extension there. Good enough for me. There should be a healthy bounce after that.

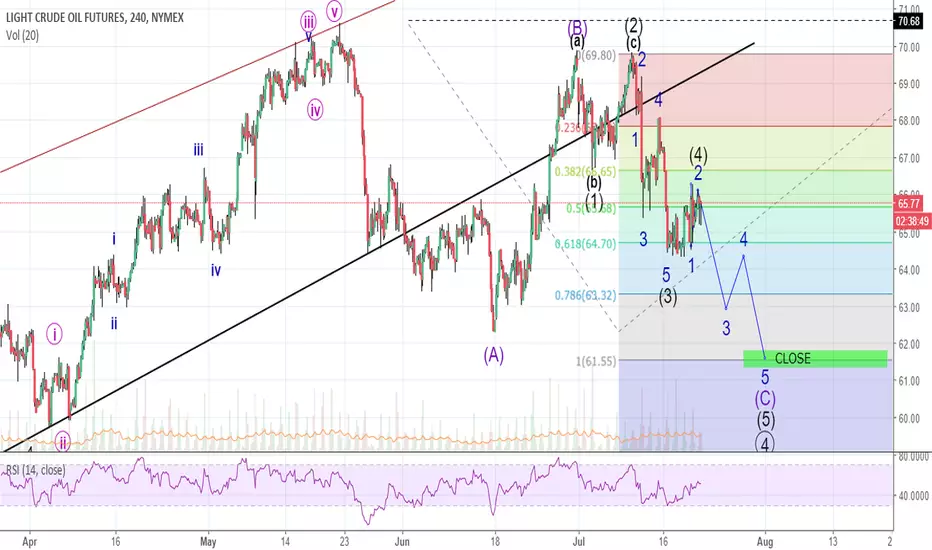
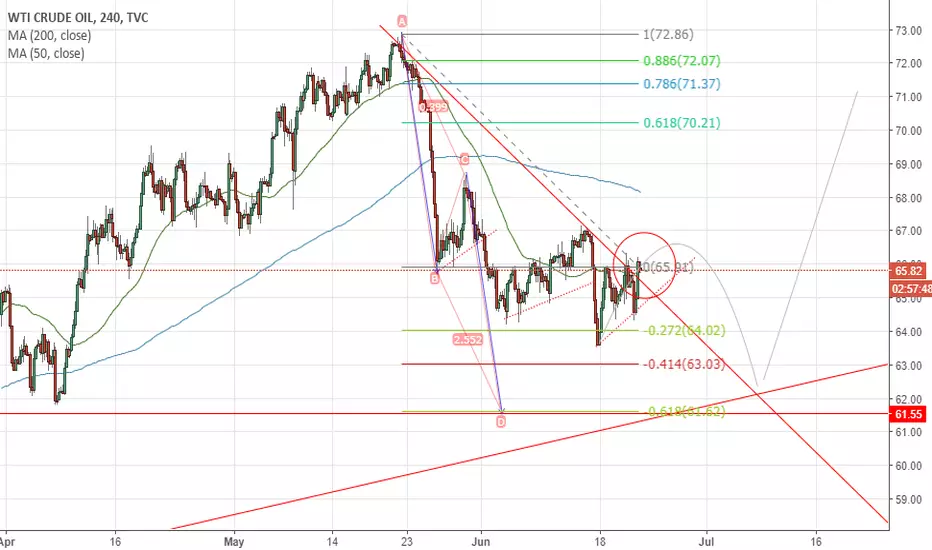
Light Crude possible short scenarioThis is just one of several scenarios that may play out: The recent down-move over the last 20 days has only extended 0.618 of the larger move (purple (A) wave) and may have an extended 5th wave that meets a 1:1 extension of (A). Saying that the recent move is a valid impulse wave down, and it could be the end of the bear-move. On a break of the wave 5 / (3) low this scenario will be in play. otherwise, primary wave 4 has completed and we should see some strong bullish action for the next few months.
I will be interested in either one of these outcomes.
This is published solely to further my own education.
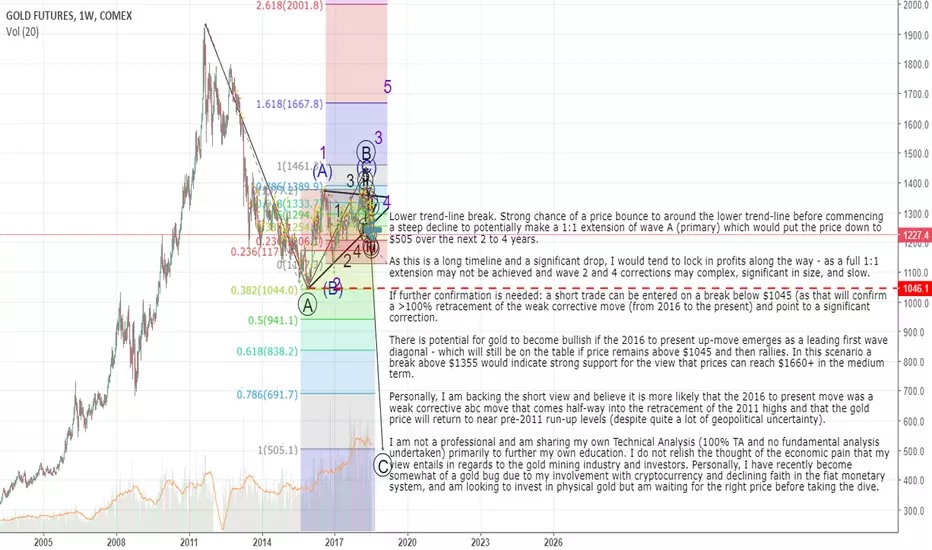
Gold long-term Technical AnalysisLower trend-line break. Strong chance of a price bounce to around the lower trend-line before commencing a steep decline to potentially make a 1:1 extension of wave A (primary) which would put the price down to $505 over the next 2 to 4 years.
As this is a long timeline and a significant drop, I would tend to lock in profits along the way - as a full 1:1 extension may not be achieved and wave 2 and 4 corrections may complex, significant in size, and slow.
If further confirmation is needed: a short trade can be entered on a break below $1045 (as that will confirm a >100% retracement of the weak corrective move (from 2016 to the present) and point to a significant correction.
There is potential for gold to become bullish if the 2016 to present up-move emerges as a leading first wave diagonal - which will still be on the table if price remains above $1045 and then rallies. In this scenario a break above $1355 would indicate strong support for the view that prices can reach $1660+ in the medium term.
Personally, I am backing the short view and believe it is more likely that the 2016 to present move was a weak corrective abc move that comes half-way into the retracement of the 2011 highs and that the gold price will return to near pre-2011 run-up levels (despite quite a lot of geopolitical uncertainty).
I am not a professional and am sharing my own Technical Analysis (100% TA and no fundamental analysis undertaken) primarily to further my own education. I do not relish the thought of the economic pain that my view entails in regards to the gold mining industry and investors. Personally, I have recently become somewhat of a gold bug due to my involvement with cryptocurrency and declining faith in the fiat monetary system, and am looking to invest in physical gold but am waiting for the right price before going long.
Gulf Coast Jet Fuel FuturesProposed EW count for Gulf Coast Jet Fuel Futures:
Box denotes the wave travel of the minuette wave (I am not careful about using the correct EW notations) travel. I was tempted to label that as inermediate wave (3) but it would be the shortest wave and that wouldn't stack up.
I would be looking for wave C to possibly make a 1:1 or 1:1.618 extension for sub-wave (c). If price is held by the approx trend-line then an extension of wave (5) is still in play, If the trend-line doesn't hold this would validate the count and point towards a retracement of the 5 wave move (no targets as yet - although $1.55 seems like a plausible initial target).

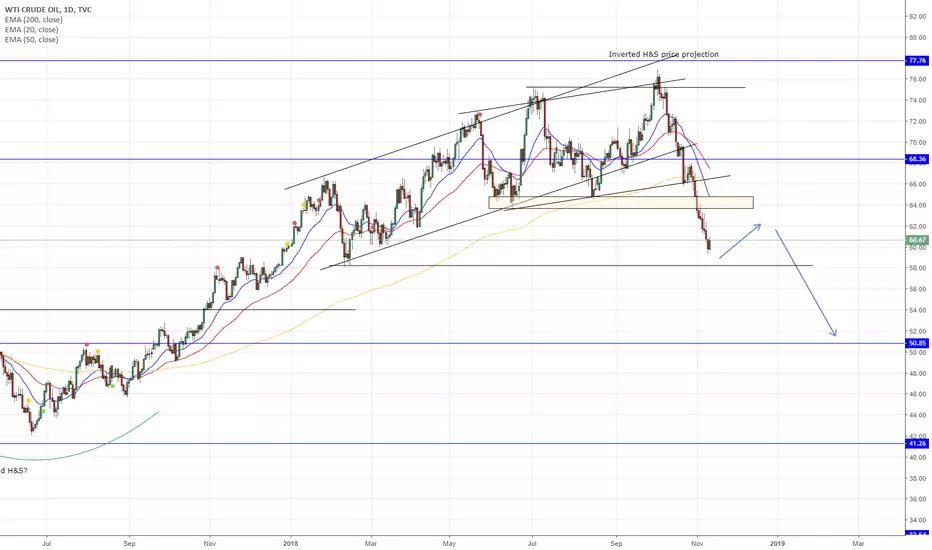
Crude oil breaks the downtrend line, or is it a false break? Crude oil continues to fall after we saw a squeeze over $70, the question is how low will it go? Today we look at the technicals and so far, still more downside to go. Combine with a monthly candle, the break of the downtrend line may be a false break, or it may not. Only time will tell...
Happy Trading, folks!
Cheers.
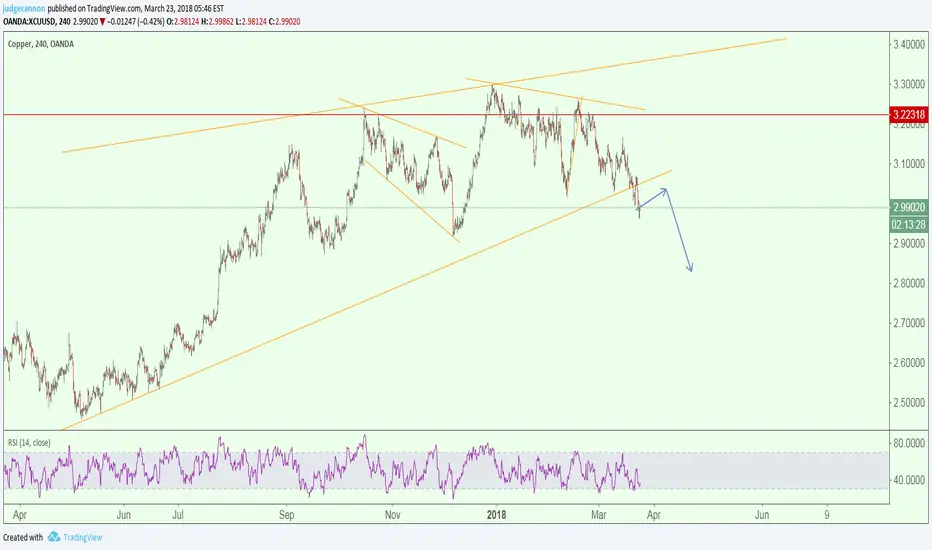
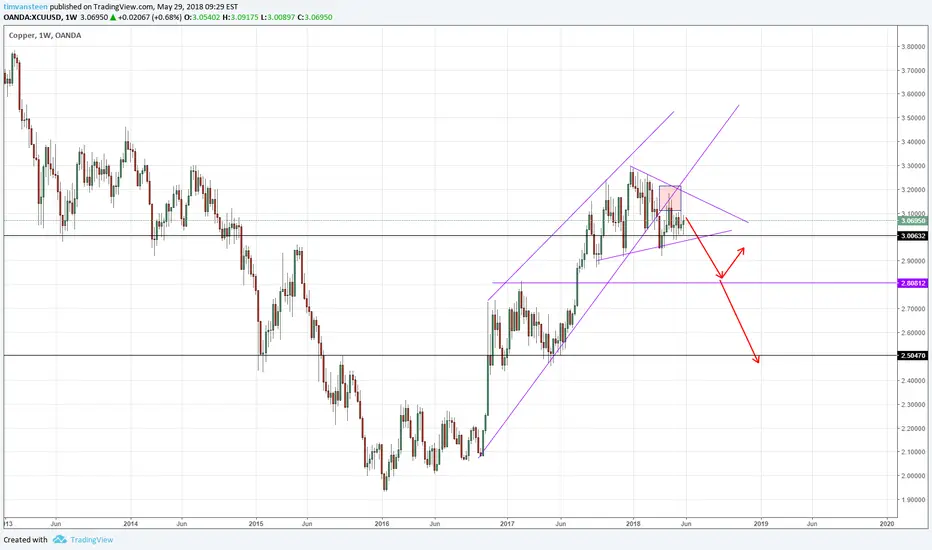
{XCU/USD] Struggles to aim higher; consolidation, look for shortPrice is trapped within a range, does not look like the uptrend(channel) is holding.
From what I see now, I would see price drop.
What can happen:
> Price aim for 2.8, maybe further targets down to 2.5
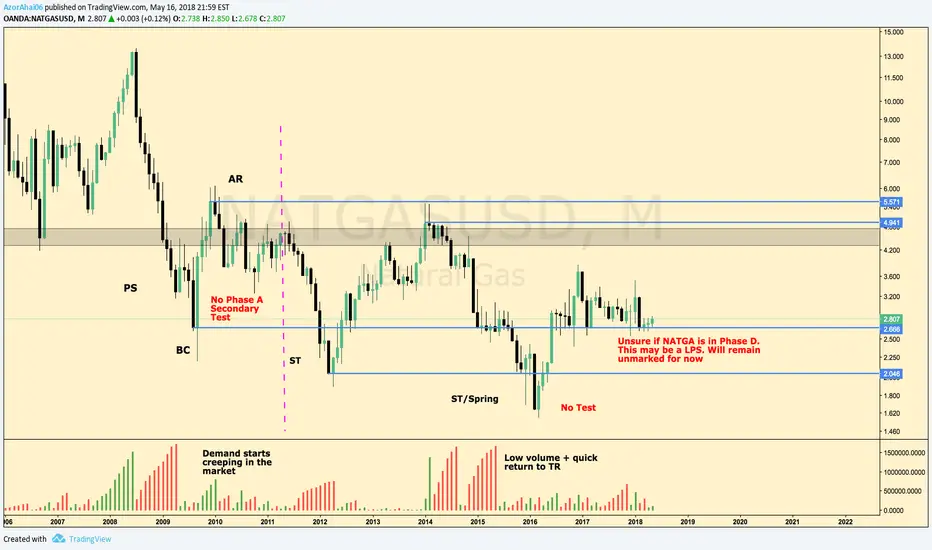
Natural Gas / USD Case for Wyckoff AccumulationAnother case for Wyckoffian Accumulation on Natural Gas. Will continue to watch this trading range. Some key characteristics seem to be missing.
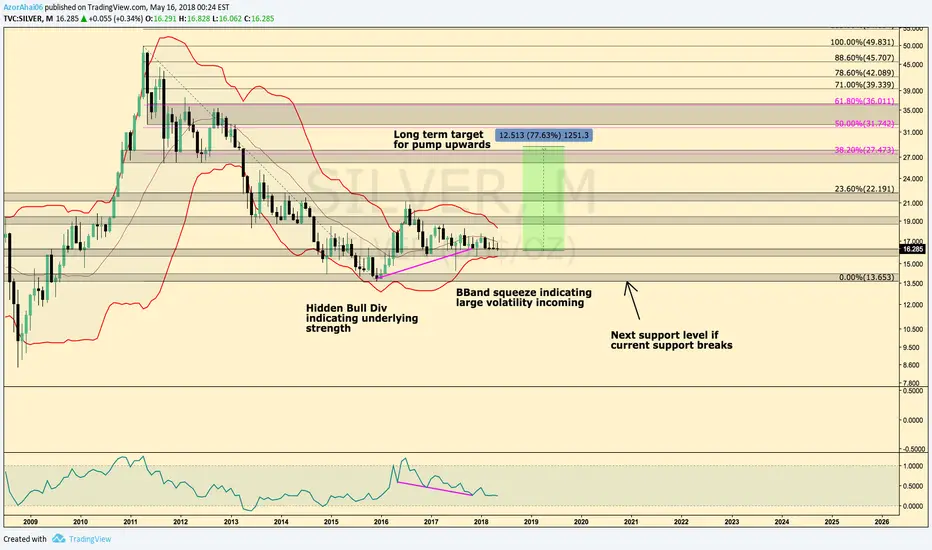
SilverAnnotations provided.
Silver is heavily manipulated. Unsure if break will be up or down. However, Hidden Bullish Divergence indicating a move upwards.
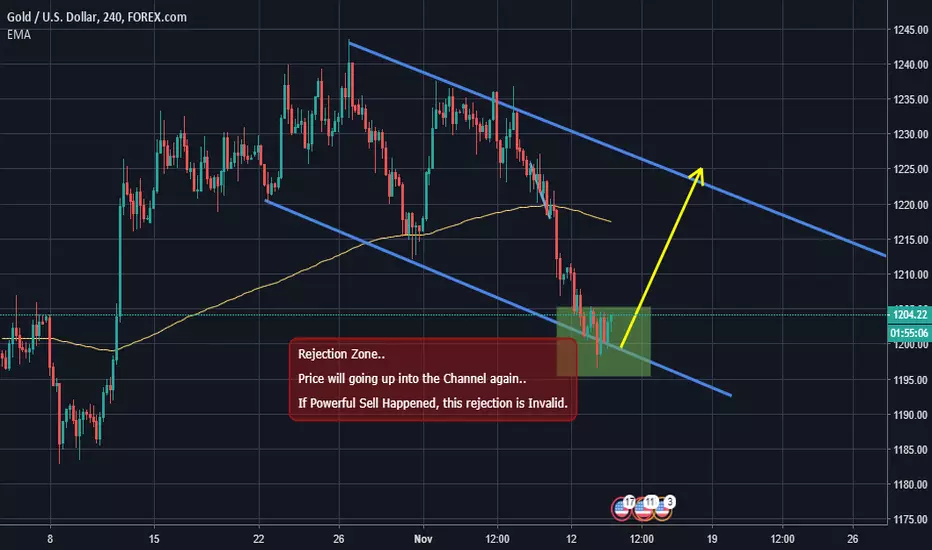
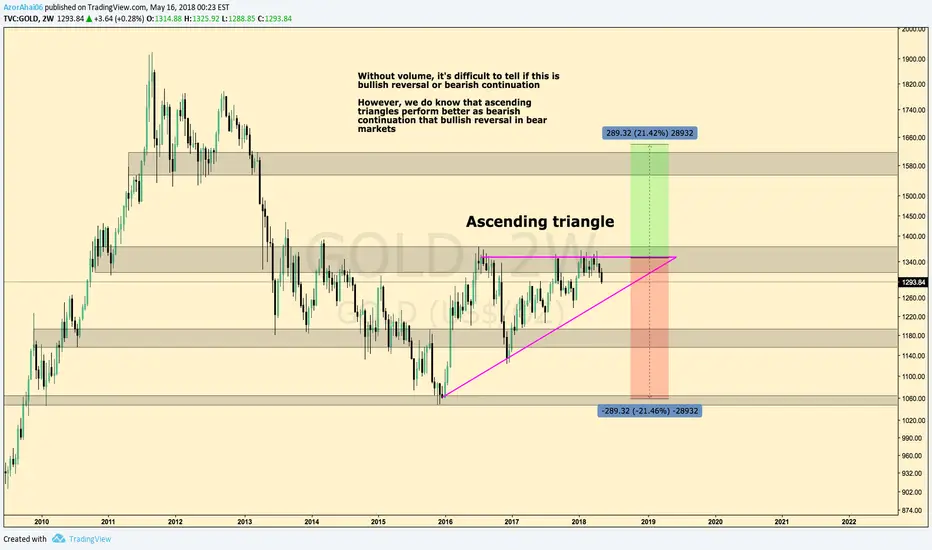
GoldAnnotations and S/R Levels provided.
I would wait for the pattern to finish (either breakout or break down) => break a level of structure => enter on the retrace to that level of structure
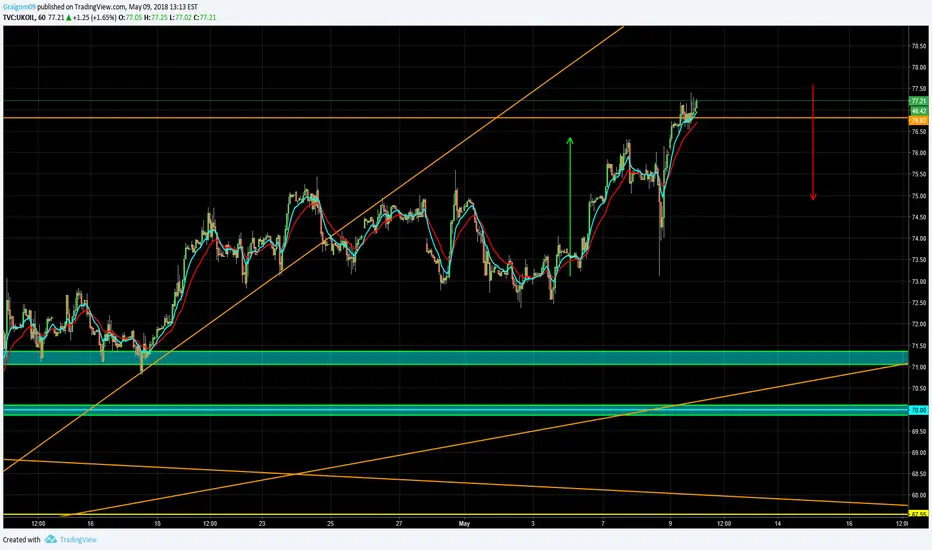
SHORT ON OIL COMING SOON GUYS!I could see a probable short coming very soon guys!
ARE YOU INTERESTED?!
Alright I'm expecting prices to reverse around the 78.00 price level all the way down to possibly the 75.00/74.50/73.00/72.50.
TP: 75.00/74.50/73.00/72.50
US sanctions on Rusal send Aluminium prices higherUS sanctions on Rusal send Aluminium prices higher.
Can Aluminium complete the trend reversal and
head into an new uptrend ?
Needs to break 3.802 to really confirm a new trend

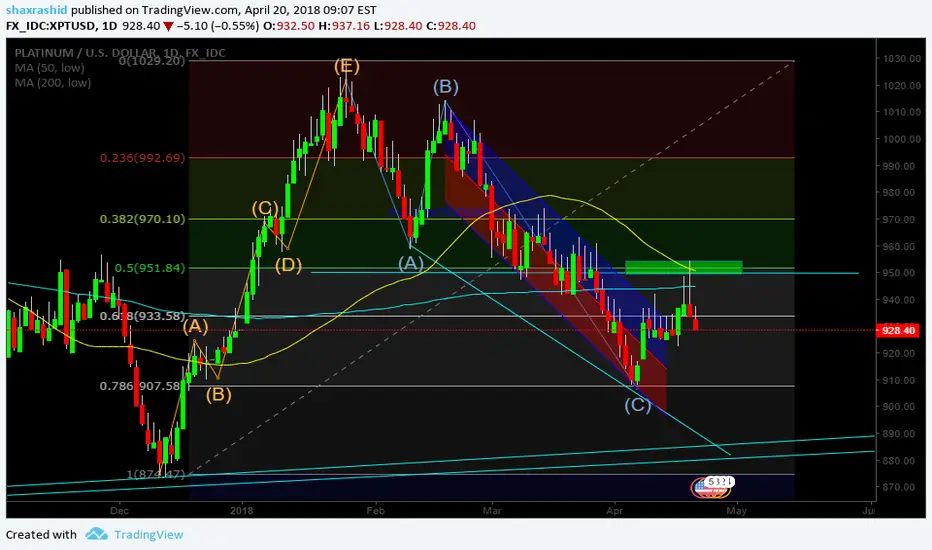
PLATINUM - Short PlayPlatinum falls sharply and will continue to fall while it looks for some support for a short term rebound which I (assume) could go to 945. However, if support at current level is not found than we are looking for another major fall towards previous lows and potentially even lower toward 885/80 Support area before it starts to rebound.
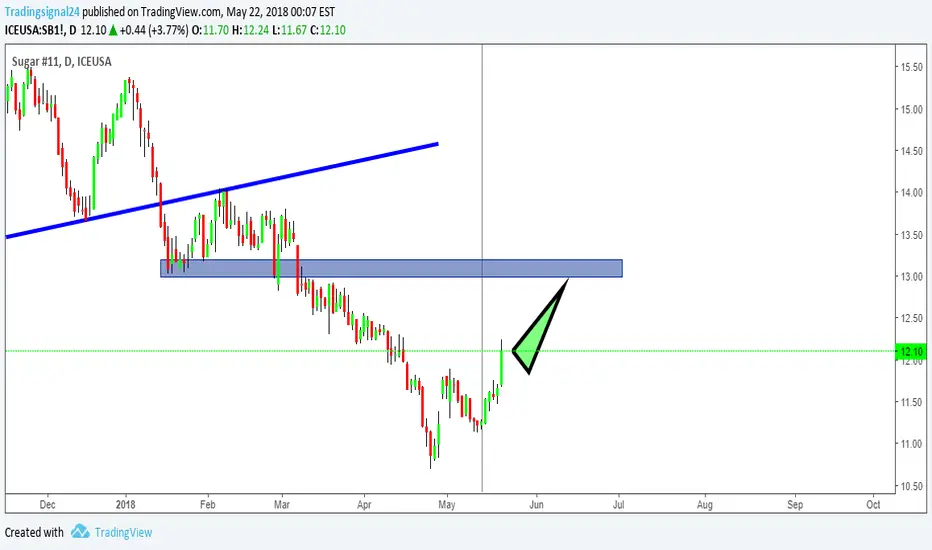
ICEUS SUGAR : The fifth wave is performing in diagonal triangle
The fifth wave is performing in diagonal triangle.After the completion of wave 5,
the market is expected to make a significant rally.

Crude Huge move in the worksIs there a huge Bullish move around the corner or a return to previous trend line??
Copper - Broken Trend Line - ShortI think we could see a large movement down for Copper in the next few months.