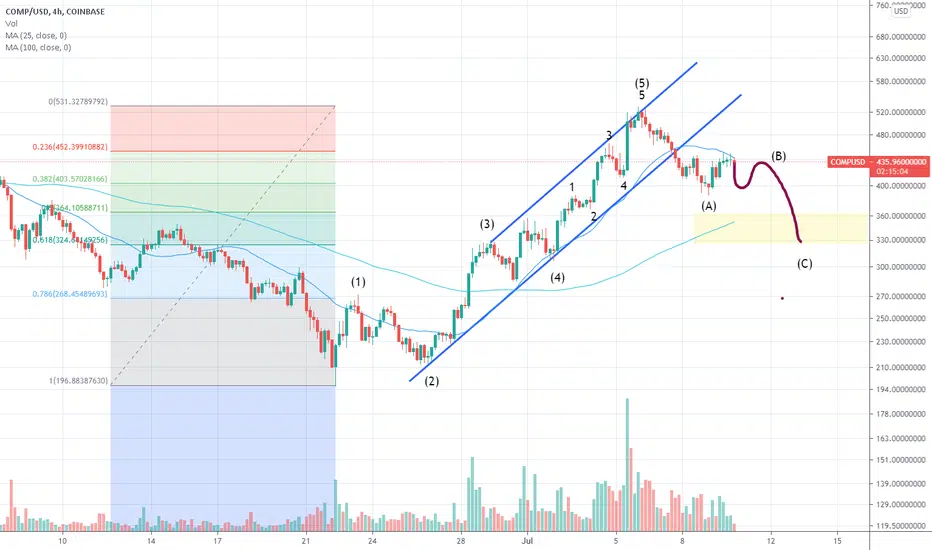
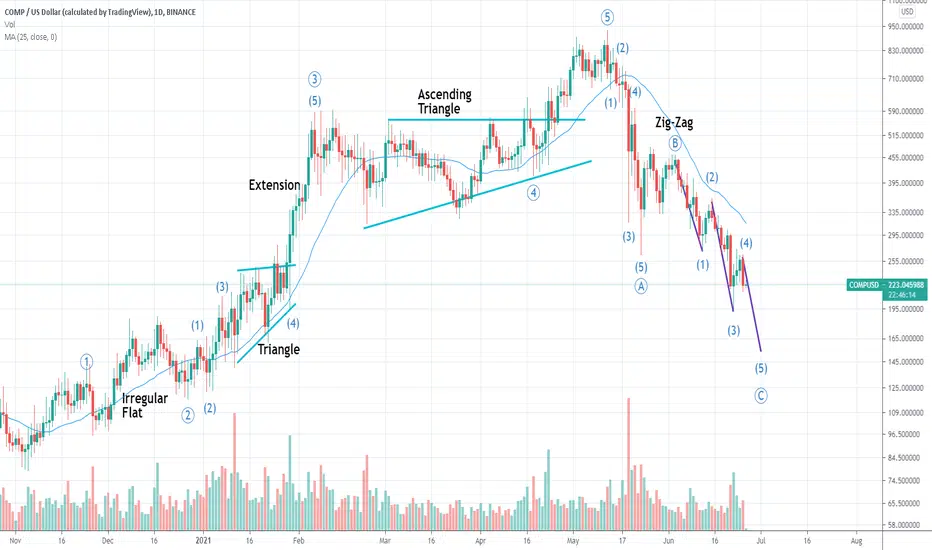
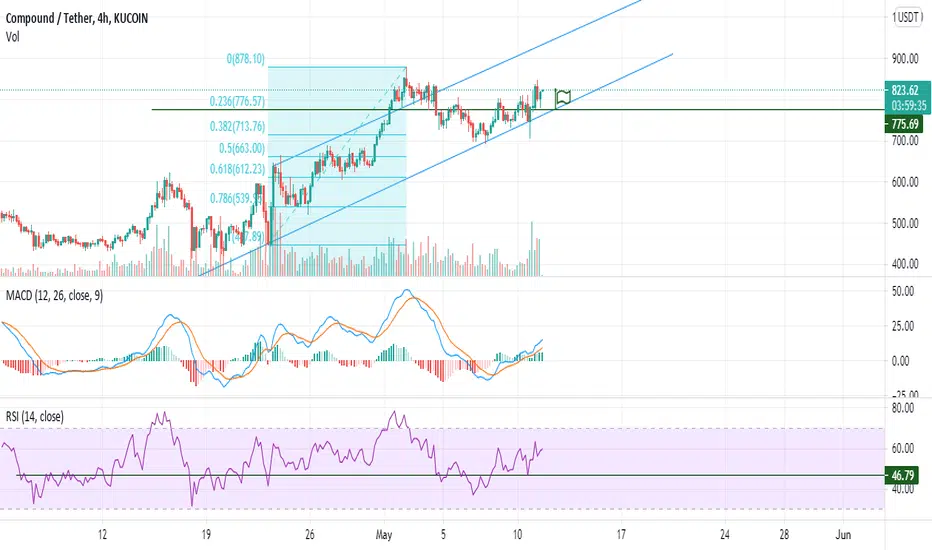
Compound: Simple Zig-Zag CorrectionCompound appears to have completed a set of 5 impulsive waves, with an extended sub-wave 5, for a first bullish wave 1. It is now correcting in the shape of a zig-zag, the most common pattern for a wave 2. Right now it is tracing sub-wave b of wave 2 and I expect a sub-wave c of wave 2 in the upcoming days that could push the price down to the $325-360 range, which would be an ideal long entry point. This range is derived from a Fibonacci retracement of between 50% and 61.8%, but the 61.8% being the most probable occurence.
Compound
COMP 1D Power is, the mind is not necessary. Where better to buyA very long time ago, we did not publish the idea of a trade pair of Compusdt
Today we decided to publish because COMP Token Compound is one of the few alts, which showed growth last week.
Over the past week, buyers showed an increased interest in the Compusdt pair, it can be seen in the combination price increase + high trading volumes. And we did not find some screaming news that could so push the price up. If we missed something, please write about it in the comments.
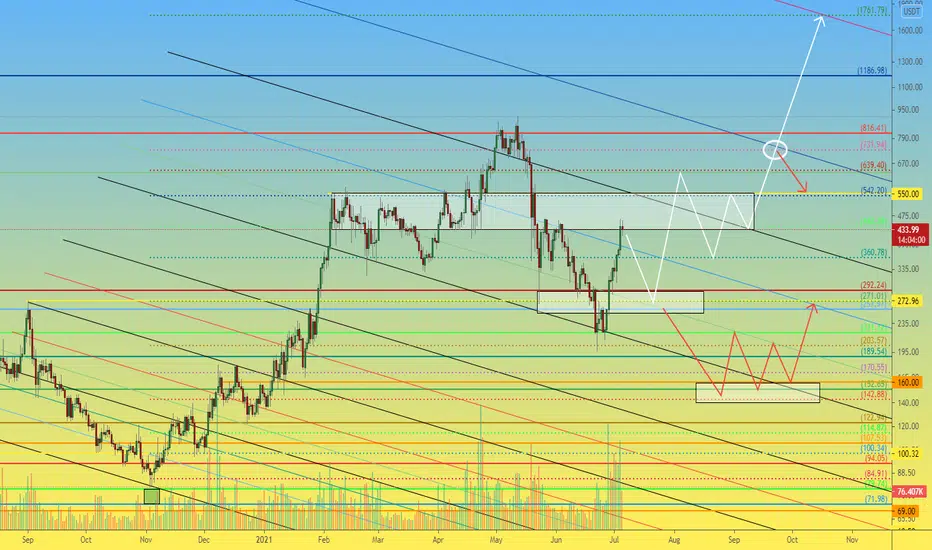
Now, the price hit a strong liquid area of $440-540 , which the last price was last checked for strength on the rebound after the May fall.
Now it is more logical that the price will fall for checking the strength of a $240-290 area . If buyers are activated in this zone again, it will be a clear signal for taking a Long position, because then buyers will show that they are strong and there are many of them. In this case, it will be possible to focus on further growth behind the white scenario.
If by that time, the negative mood in the cryptocurrency market will dominate, and the price of Btcusdt will update the minimum, then it is unlikely that the price of CompUSD will go against a common trend. In this situation, you will need to focus on the movement of the price behind the red scenario, and the area of $140-160 will be tasty to buy.
_______________________________
Since 2016, we have been analyzing and trading the cryptocurrency market.
We transform our knowledge, trading moods and experience into ideas. Each "like under the idea" boosts the level of our happiness by 0.05%. If we help you to be calmer and richer - help us to be happier :)
Retracement possible for $COMP100 day moving average and also a prominent resistance level are currently in the way. Bitcoin also has been moving lower (as of the last hour or so), which could influence this pullback even more. Notice the fib levels drawn as well, which line up with support levels, for possible areas of support on the pullback. If Bitcoin does not move significantly lower, this might be less likely to happen. Or even if it does, possibly. $COMP has been strong after recent bullish news.
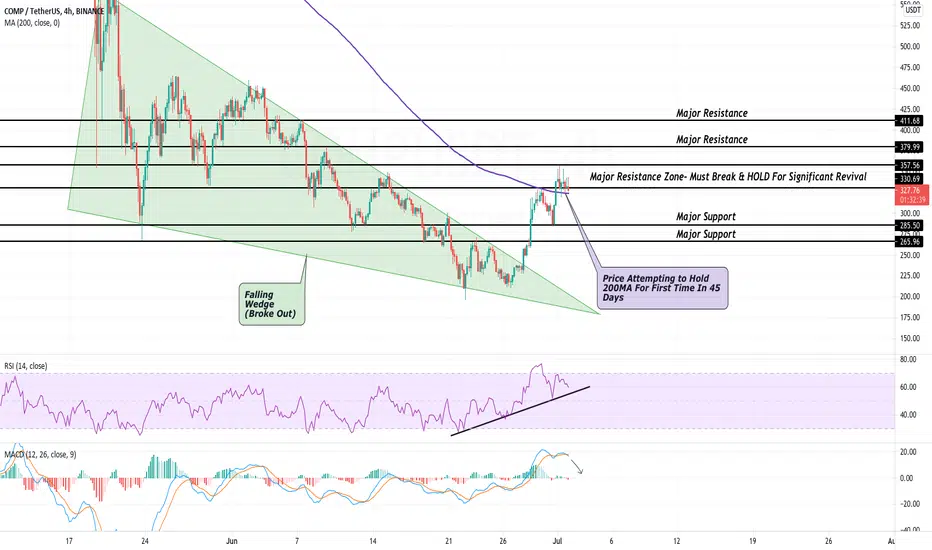
COMP Breaks 40 Day Falling Wedge Pattern-COMP has revived nearly 70% since its low of $195
-Price has recently broke a falling wedge pattern
-COMP needs to stay above 200MA to continue revival
Compound has recently grown much in light of its DeFi capabilities the last year. The price has seen some growth but not as much as its competitors as it is up a mere 85% over the past year. Unfortunately 99% of cryptocurrencies follow BTC’s price action which has left the majority of the market flat, including COMP. Although, a break out of its falling wedge pattern may signal a trend change Is upon us.
After breaking free of the 45 day falling wedge, COMP slashed right through its major resistances of $265 & $285. Since then, COMP has been playing with its major resistance zone of $330-$357. Compound must break and HOLD this area to be clear for significant revival. This area has proved to be an important zone the last 5 months and until COMP can fully clear this mark, it is still considered in a bearish downtrend.
Along with this major resistance zone, COMP has been attempting to hold above its 200MA for the first time in nearly 45 days. If price fails to hold this MA and falls below, it is very likely to see a retracement back to the major support of $285. In the case bears continue to hold control, COMP will test the $265 mark and will be in danger of a larger fall if that major support can not hold.
While looking at the RSI, it is easy to see a trend line has been respected since the low of $195 had formed. If strength stays above this trend, all is well and COMP will be in a great position to continue revival. The MACD is signaling a slight bearish bias as the MA’s have created a slight double top and have also crossed bearish. A retest of the 0 value looks likely.
COMP intraday levels
Spot rate: $327
Trend: Bullish
Volatility: Medium
Support: $285
Resistance: $330
Compound: One Last DowntrendThis DEFI lending platform is showing a clear Elliott Wave count: a gigantic primary zig zag, where there is only an intermediary wave 5 of primary c to finish. In other words, there is still -30% potential from current level, so the target would be $150. It seems like a crystal clear textbook count to me.

Compound (COMP) - June 15Hello?
Welcome, traders.
By "following", you can always get new information quickly.
Please also click "Like".
Have a good day.
-------------------------------------
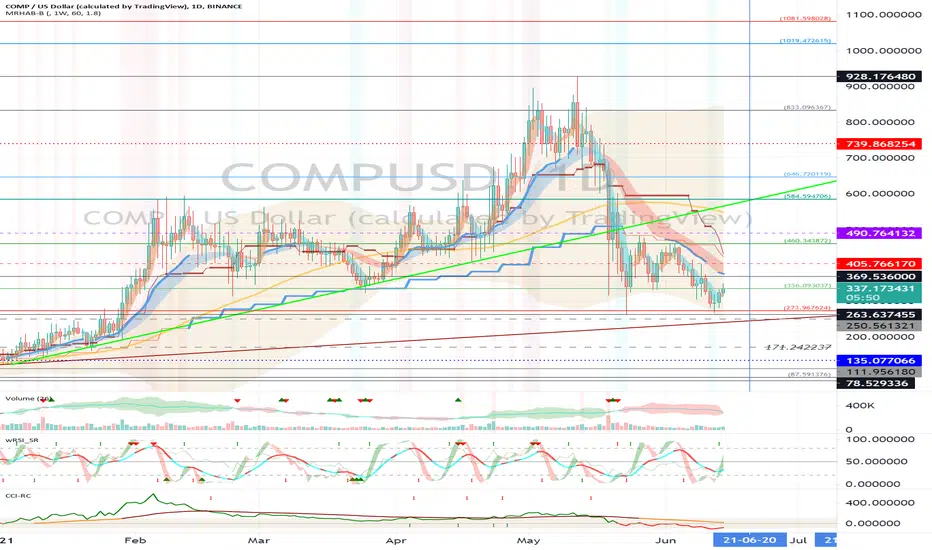
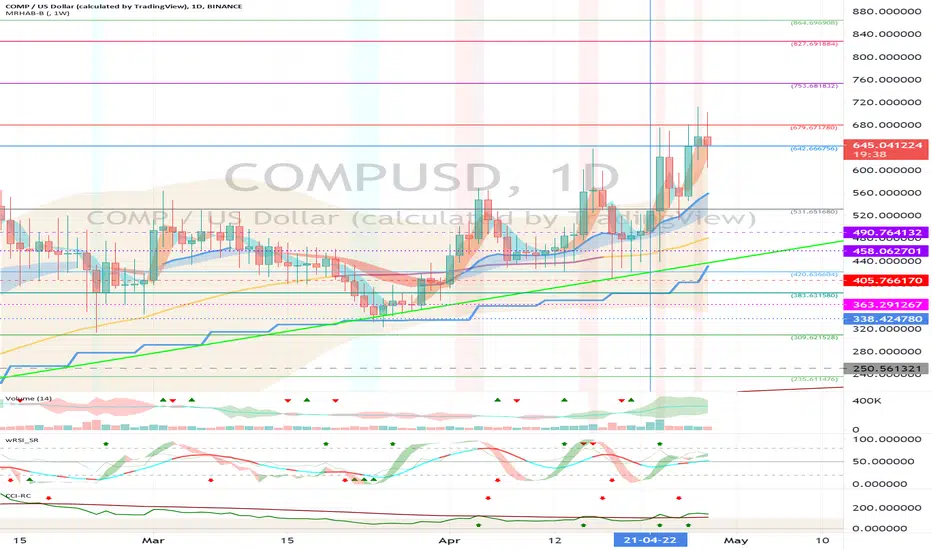
(COMPUSD 1W Chart)
If the price holds above the 250.561321 point, it is expected to maintain an uptrend.
(1D chart)
We need to see if it can move above the 336.093037 point to find support.
To transition into an uptrend, it needs to rise above the 369.536000 point and find support.
If the 460.343872-490.764132 section does not turn upward, it is expected that the downtrend will continue, so careful trading is required.
If it goes down, we should see support at the 250.561321 point and see if we can move along the uptrend line.
-------------------------------------
(COMPBTC 1W chart)
We need to see if we can break out of the downtrend line while maintaining the price in the 0.006573-0.011285 range.
To create a new wave, it must rise above the 0.013085 point.
If it falls below the 0.006573 point, it may take a long time to rise, so trade cautiously.
(1D chart)
We'll have to wait and see if we can move above the 0.008976 point.
If it goes down, you should check to see if it finds support at the 0.006526-0.007343 range.
To convert into an uptrend, it needs to rise above the 0.010745 point and find support.
------------------------------------------
We recommend that you trade with your average unit price.
This is because, if the price is below your average unit price, whether it is in an uptrend or in a downtrend, there is a high possibility that you will not be able to get a big profit due to psychological burden.
The center of all trading starts with the average unit price at which you start trading.
If you ignore this, you may be trading in the wrong direction.
Therefore, it is important to find a way to lower the average unit price and adjust the proportion of the investment, ultimately allowing the funds corresponding to the profits to regenerate themselves.
------------------------------------------------------------ -----------------------------------------------------
** All indicators are lagging indicators.
Therefore, it is important to be aware that the indicator moves accordingly with the movement of price and volume.
However, for the sake of convenience, we are talking in reverse for the interpretation of the indicator.
** The wRSI_SR indicator is an indicator created by adding settings and options to the existing Stochastic RSI indicator.
Therefore, the interpretation is the same as the traditional Stochastic RSI indicator. (K, D line -> R, S line)
** The OBV indicator was re-created by applying a formula to the DepthHouse Trading indicator, an indicator disclosed by oh92. (Thanks for this.)
** See support, resistance, and abbreviation points.
** Support or resistance is based on the closing price of the 1D chart.
** All descriptions are for reference only and do not guarantee a profit or loss in investment.
Explanation of abbreviations displayed in the chart
R: A point or section of resistance that requires a response to preserve profits.
S-L: Stop Loss point or section
S: A point or section where you can buy to make a profit as a support point or section.
(Short-term Stop Loss can be said to be a point where profit and loss can be preserved or additional entry can be made through split trading. It is a short-term investment perspective.)
GAP refers to the difference in prices that occurred when the stock market, CME, and BAKKT exchanges were closed because they are not traded 24 hours a day.
G1 : Closing price when closed
G2: Opening price
(Example) Gap (G1-G2)
COMP/USDT potential 82% setupHello, Traders!
After correction, the price of COMP returned to the active trading zone of $379 - $435.
MA100 acts as dynamic price support.
Cumulative delta analysis shows the presence of demand from buyers.
We may consider purchases in the range of $379 - $421
Stop-loss can be located under the price level of $292
Targets are the price levels
$492
$550
$608
$691
Good luck and watch out for the market

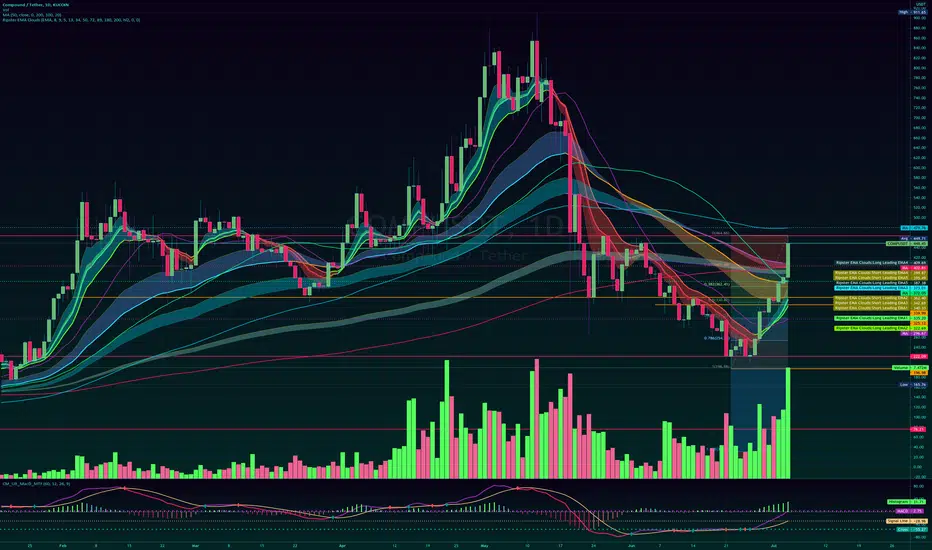
COMPUSD- Looking STRONG-67% Move Coming?!COMP/USD giving us multiple bull signals!
In the 1H, it's congquered the 55EMA! the 100 EMA,! the 200EMA! and is chasing the 300EMA (purple)! The last time this happened it made a 75% move! Also, notice the 55EMA is serving as support.
Since we've got aggressive price action in the 1H, it's possible it completes this move in a day.
Let's see how this plays out!
Just my humble opnion folks. Take care with all your trades. Good luck to all!

Compound (COMP) - May 29Hello?
Welcome, traders.
By "following", you can always get new information quickly.
Please also click "Like".
Have a good day.
-------------------------------------
(COMPUSD 1W Chart)
(1D chart)
We have to see if we can climb above the 383.631580 point and gain support.
If it continues to fall, it can touch the 338.424780 point, so you need to trade cautiously.
We will have to wait and see if the 383.631580-420.636604 section can move higher with volatility around June 1-7.
It needs to rise above the 490.764132 point and find support to turn into an uptrend.
It remains to be seen if the upward break above the 531.651680 point can accelerate the uptrend.
-------------------------------------
(COMPBTC 1W chart)
(1D chart)
It remains to be seen if the 10608 Satoshi-11425 Satoshi section can find support and move up along the uptrend line.
If it falls from the 10608 Satoshi point, Stop Loss is required to preserve profit and loss.
However, it may follow an uptrend line, so trade with caution.
The 9675 Satoshi-11285 Satoshi section is an important section, and if it rises in this section, it is expected to turn into an upward trend.
However, the key question is whether it can cross the downtrend line.
--------------------------------------
It is advisable to trade at your average unit price.
This is because if the price is below your average unit price whether the price trend is in an uptrend or in a downtrend, there is a high possibility that you will not be able to get a big profit due to psychological burden.
The center of all trading starts with the average unit price at which you start trading.
If you ignore this, you may be trading in the wrong direction.
Therefore, it is important to find a way to lower the average unit price and adjust the proportion of the investment, so that the funds that ultimately correspond to the profits can regenerate the profits.
-------------------------------------------------- -----------------------------------------------------
** All indicators are lagging indicators.
Therefore, it is important to be aware that the indicator moves accordingly with the movement of price and volume.
However, for the sake of convenience, we are talking in reverse for the interpretation of the indicator.
** The wRSI_SR indicator is an indicator created by adding settings and options to the existing Stochastic RSI indicator.
Therefore, the interpretation is the same as the traditional Stochastic RSI indicator. (K, D line -> R, S line)
** The OBV indicator was re-created by applying a formula to the DepthHouse Trading indicator, an indicator disclosed by oh92. (Thanks for this.)
** See support, resistance, and abbreviation points.
** Support or resistance is based on the closing price of the 1D chart.
** All descriptions are for reference only and do not guarantee a profit or loss in investment.
Explanation of abbreviations displayed in the chart
R: A point or section of resistance that requires a response to preserve profits.
S-L: Stop Loss point or section
S: A point or section where you can buy to make a profit as a support point or section.
(Short-term Stop Loss can be said to be a point where profit and loss can be preserved or additional entry can be made through split trading. It is a short-term investment perspective.)
GAP refers to the difference in prices that occurred when the stock market, CME, and BAKKT exchanges were closed because they do not trade 24 hours a day.
G1 : Closing price when closed
G2: Opening price
(Example) Gap (G1-G2)

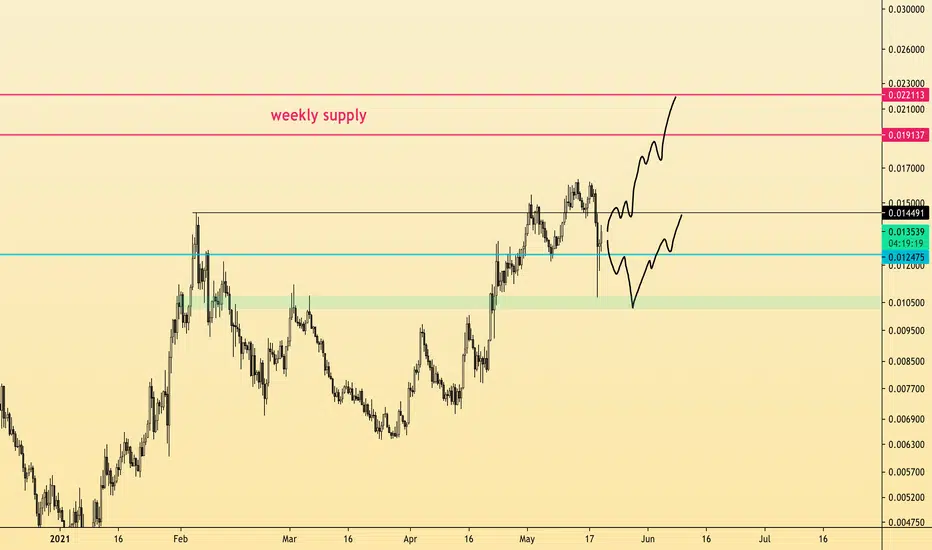
COMP/BTC Critical Level @ 145001. Watch reaction @ 14500 (black)
- flip as support --> higher lows made --> bullish MS --> target weekly supply @ 21000
- reject --> lose 12500 as support (blue) --> return to daily demand @ 10500 (green)
COMP is one of the few coins that made a higher low (with the daily candle close, wicks's don't count)
Many others aren't out of the woods yet
Let's see how this plays out!
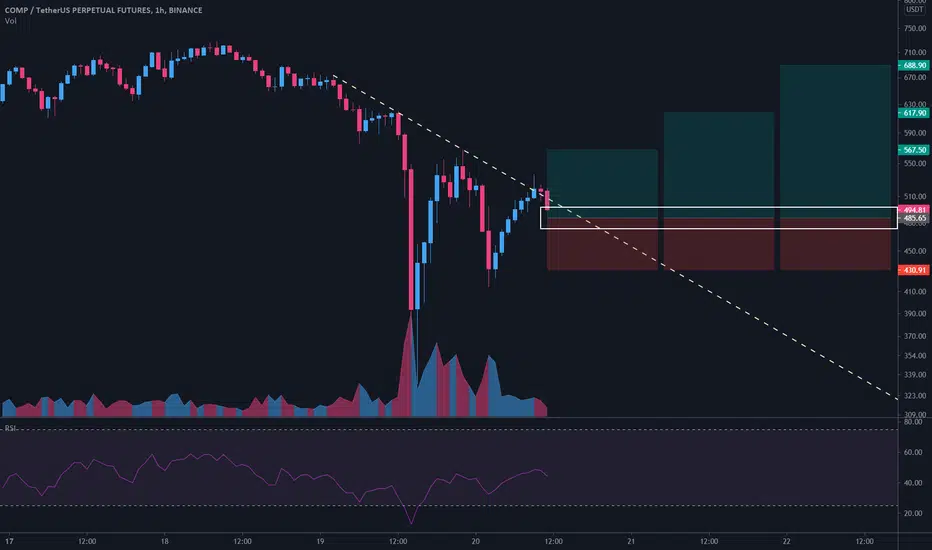
$COMP/USDT 1h (Binance Futures) Descending trendline breakoutCompound is looking ready for recovery after that local break-out.
Current Price= 494.81
Buy Entry = 497.60 - 473.70
Take Profit= 567.50 | 617.90 | 688.90
Stop Loss= 430.91
Risk/Reward= 1:1.5 | 1:2.42 | 1:3.71
Expected Profit= +33.70% | +54.46% | +83.70%
Possible Loss= -22.54%
Fib. Retracement= 1 | 1.272 | 1.618
Margin Leverage= 2x
Estimated Gain-time= 3 days
Compound Is Still Exhibiting Bullish Traits! BUY COMPUSDCompound is going through a period of consolidation, however, the market structure still suggests that bullishness is well supported. Having said that, i do expect this market to go down a bit further until at least we come in contact with the rising trendline support!

Trading idea for COMPUSDTCompounds has broken its current downtrend. If it continues its uptrend it may reach even a new ath soon. Do not forget to take profits and use stop loss.
Compound (COMP) - April 29Hello?
Dear traders, nice to meet you.
By "following" you can always get new information quickly.
Please also click "Like".
Have a good day.
-------------------------------------
(COMPUSD 1W chart)
(1D chart)
We need to see if we can get support and climb in the 642.666756-679.671780 section.
If it falls, you need to make sure you get support at 531.651680.
If you go down at 420.636604, you need Stop Loss to preserve your profit and loss.
If you break above 679.671780 and gain support, it is expected to create a new wave.
-------------------------------------
(COMPBTC 1W chart)
(1D chart)
We have to see if we can get support and climb at the 11425 Satoshi point.
If it falls at 8976 Satoshi, Stop Loss is required to preserve profit and loss.
--------------------------------------
It is advisable to trade at your average unit price.
This is because if the price flows below your average unit price, which was on an uptrend or downtrend, there is a high possibility that you will not be able to earn a large profit due to the psychological burden.
The center of every trade starts with the average unit price you start trading.
If you ignore this, you may be trading in the wrong direction.
Therefore, it is important to find a way to lower the average unit price and adjust the proportion of the investment, so that the money that ultimately corresponds to the profit can regenerate the profit.
-------------------------------------------------- -------------------------------------------
** All indicators are lagging indicators.
So, it's important to be aware that the indicator moves accordingly with the movement of price and volume.
Just for the sake of convenience, we are talking upside down for interpretation of the indicators.
** The wRSI_SR indicator is an indicator created by adding settings and options from the existing Stochastic RSI indicator.
Therefore, the interpretation is the same as the conventional stochastic RSI indicator. (K, D line -> R, S line)
** The OBV indicator was re-created by applying a formula to the DepthHouse Trading indicator, an indicator that oh92 disclosed. (Thank you for this.)
** Check support, resistance, and abbreviation points.
** Support or resistance is based on the closing price of the 1D chart.
** All explanations are for reference only and do not guarantee profit or loss on investment.
Explanation of abbreviations displayed on the chart
R: A point or section of resistance that requires a response to preserve profits
S-L: Stop Loss point or section
S: A point or segment that can be bought for profit generation as a support point or segment
(Short-term Stop Loss can be said to be a point where profits and losses can be preserved or additionally entered through installment transactions. It is a short-term investment perspective.)
GAP refers to the difference in prices that occurred when the stock market, CME, and BAKKT exchanges were closed because they do not trade 24 hours a day.
G1: Closing price when closed
G2: Cigar at the time of opening
(Example) Gap (G1-G2)
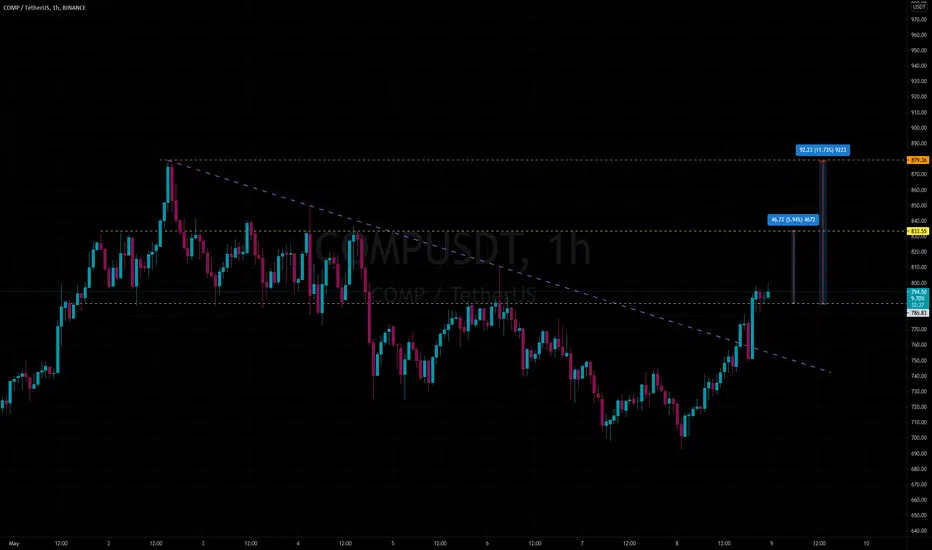
COMP next leg up soon ?COMP / USDT
price try to breakout strong resistance line
and show some accumulation below it
Dont forget this is resistance zone
So drop from here is easier than Breakout
So ..Only and only after breakout confirmation or after retest ....we can have potenial leg up
Best of wishes

COMPUSDTI got a feeling that too many of you guys are stuck in this coin day trading.
I did a great jump up, FOMO happened and here comes the dump.
If you still got it and your liquidation point isn't anywhere close, hold it.
It's got 2 strong supports + a strong lower Bollinger band which can activate support even more and stronger than before.
It's an alt coin so you won't end up losing money if you don't panic sell now.
This is not a trade setup, it's for the people who already bought this coin and are having panic sells.
⚠️ NOTE: This usually happens when a coin gets hot on crypto platforms: it might go down by a little and then get back up to a new high.
Good Luck 🎲
Tell me your ideas. Like and Share 🗣✅

COMP: SHY OF A CROSS TO JUMP HIGHEREverything is aligned for COMP to climb higher. When the probable cross happens between MA20, MA30, & MA 50, COMP could be ready to fly!

Compound: Breaking OutTo stay up-to-date with the latest market developments, be sure to subscribe to Kraken Intelligence at kraken.com
With DeFi largely underperforming its peers over the past few months, it comes as no surprise that we're starting to see bullish momentum rotate back into the space over the past few days. This is evident when looking at DeFi's total value locked (TVL), which just jumped from $52.5B on Monday to today's reading of $59.8B. Compound (COMP) is among the various DeFi plays that appear to be regaining bullish momentum...
If you're not familiar with Compound, what you should know is that Compound is a software running on Ethereum that aims to incentivize a distributed network of computers to operate a traditional money market. Compound uses multiple cryptoassets to provide this service, enabling the lending and borrowing required without a financial intermediary like a bank. Put simply, Compound allows users to deposit cryptocurrency into lending pools for access by borrowers. Lenders then earn interest on the assets they deposit. Once a deposit is made, Compound awards a new cryptocurrency called a cToken (which represents the deposit) to the lender. Examples of cTokens include cETH, cBAT and cDAI.
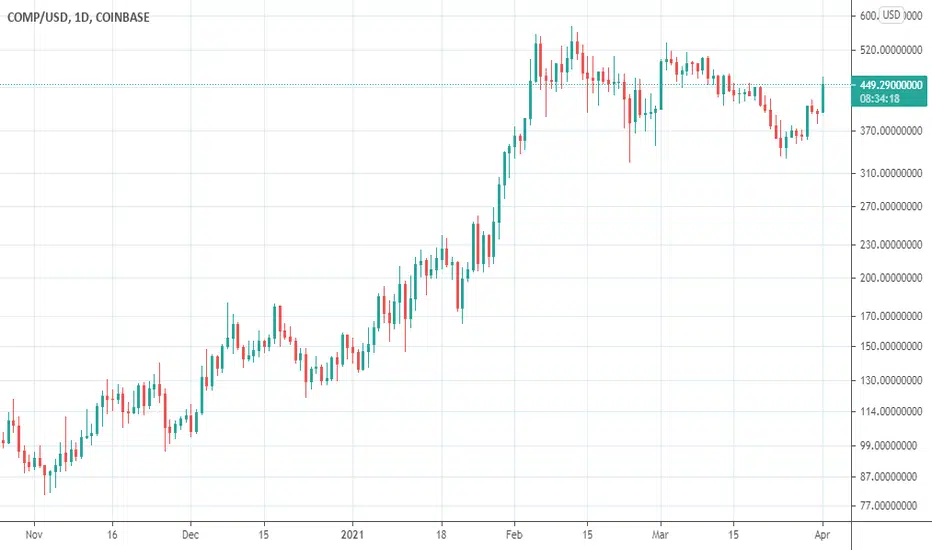
Now, moving onto the technicals... Per the 1-day chart provided above, we can see that COMP punched through $555 resistance earlier today and climbed to an all-time high of $593. With COMP having traded between $400 and $555 since February, today's breakout appears to have bucked said trend. Assuming we see COMP close above $555, and turn said resistance into support, we could see COMP enter back into price discovery mode as DeFi heats up yet again. But as always, where BTC trends next will likely dictate whether or not COMP can push higher.


COMP Inverse H&S BreakoutCompound looks to be another alt that is experiencing a neckline breakout from an inverse head and shoulders pattern.
It looks like a slight retracement is now occurring which has the potential to break down below the neckline still, however, assuming the trend continues, it has a bit of potential upward as indicated by the head to neckline length extended after the breakout (dashed blue line).
There is a similar breakout occurring against COMPBTC, so it looks like there is some potential to outpace BTC over the next few days as well if the breakout continues. I suppose we shall see soon if the breakout becomes more definitive in the next day(s) or so.

Picking up some COMPI should've got some COMP back in the move over 175. Or the momentum move through the 200's. Or during the previous consolidation in the mid 300's. However I didn't so I'm chasing momentum here. Not a great entry but I think there's more to run. I'm super bullish on Ethereum right now but I'm already in that position so putting a little in COMP as a related play as people discover how big the Ethereum space is and all the ways money is being made there. We're still in the middle of the crypto bull run so even mistakes are likely to eventually get bailed out (looking at you XTZ).