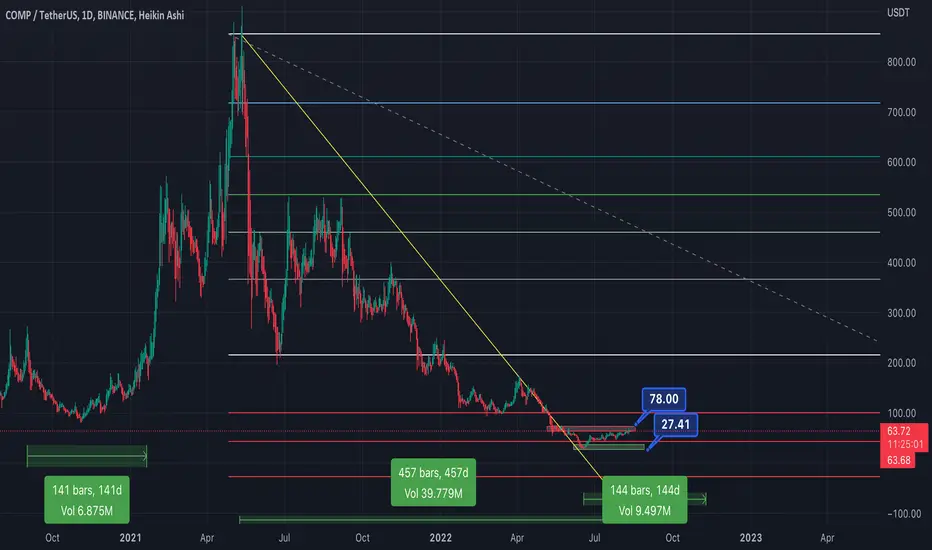
COMP next accumulation phase before bull runBINANCE:COMPUSDT
✅Before we start to discuss, I would be glad if you share your opinion on this post's comment section and hit the like button if you enjoyed it.
Thank you.
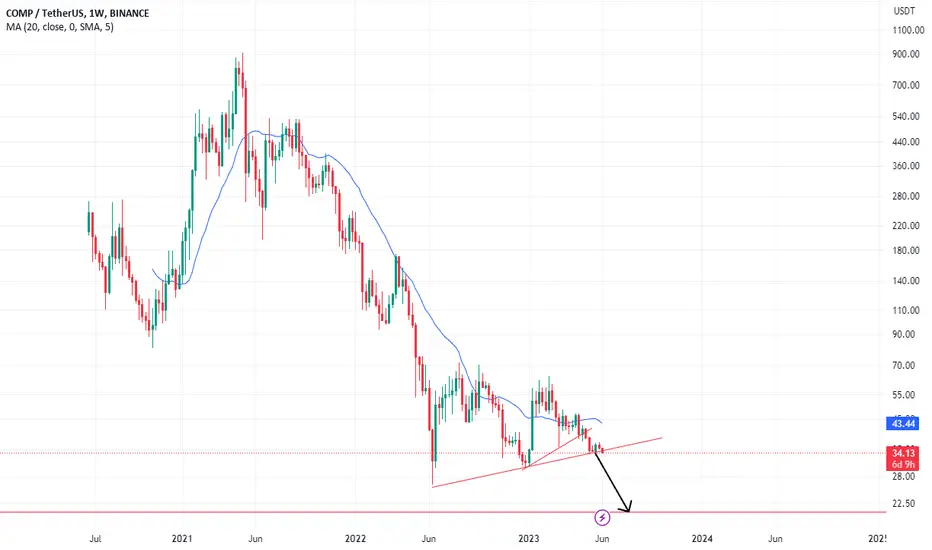
Around 460 days we are in downtrend! Last time for Comp was enough 145 days for accumulation stage before pump, lets see how it plays this time. Sellers and buyers local block I marked red and green! If we out over 72$ its will be good sign for continuation, but honestly even BTC reach 29 I think at 70-72 Comp meet strong sellers orders and going back to test even 30$. Everything can happen.
Hope you enjoyed the content I created, You can support with your likes and comments this idea so more people can watch!
✅Disclaimer: Please be aware of the risks involved in trading. This idea was made for educational purposes only not for financial Investment Purposes.
* Look at my ideas about interesting altcoins in the related section down below ↓
* For more ideas please hit "Like" and "Follow"!
Compound
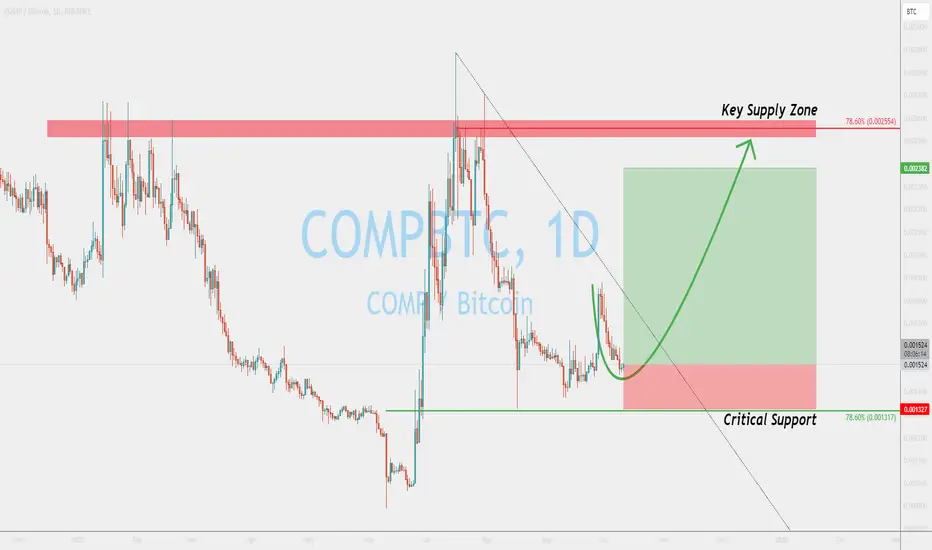
Smart Trading Moves: Navigating COMPBTC Potential RallyIn August, COMPBTC exhibited a precise bounce off the 78.6% Fibonacci support level, marking a significant turning point. Subsequently, the price has primarily traded within a range, all while staying below the downtrend trendline. However, a noteworthy development is the emerging pattern of higher highs and higher lows, hinting at potential preparations for an upward rally.
With the ongoing respect of the Fibonacci support, the scenario suggests a potential price surge towards the crucial supply zone, aligned with the 78.6% Fibonacci resistance level. We've established our trade setup, which boasts a favorable risk-to-reward ratio. As we closely monitor price action, we'll keep you updated on any noteworthy changes.
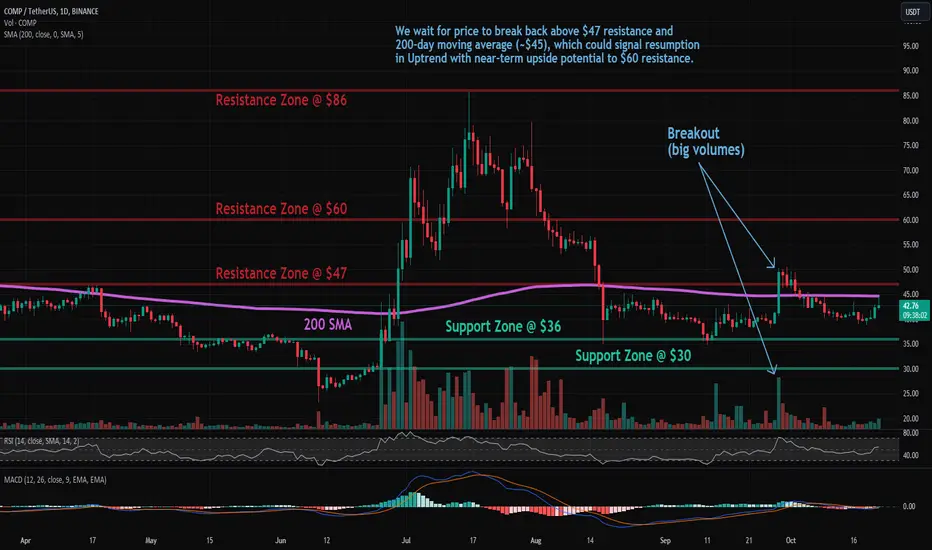
COMP: Approaching ResistanceCompound (COMP) technical analysis:
Trade setup : We wait for price to break back above $47 resistance and 200-day moving average (~$45), which could signal resumption in Uptrend with near-term upside potential to $60 resistance.
Trend : Downtrend across all time horizons (Short- Medium- and Long-Term).
Momentum is Mixed as MACD Line is below MACD Signal Line (Bearish) but RSI ~ 50 (Neutral). MACD Histogram bars are rising, which suggests that momentum could be nearing another upswing.
Support and Resistance : Nearest Support Zone is $36, then $30. The nearest Resistance Zone is $47, then $60, and $70.
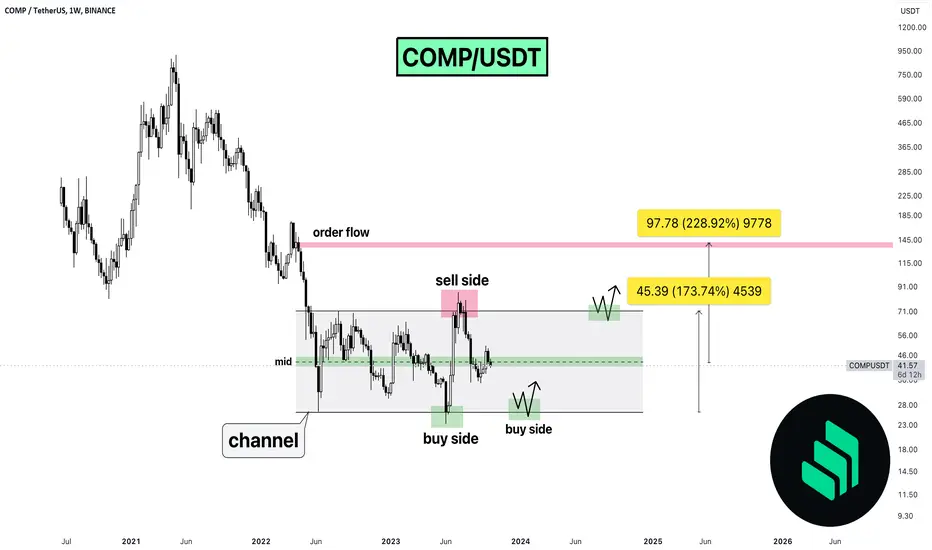
🔥COMP Is At a Channel Mid: What's Next? 2 Options!Compound grew by +180% from bottom to channel top. It's very volatile altcoisn which can impress traders and investors, but now it's indise the channel mid.
The first confirmation of the upcoming growth will be the close of the Weekly candle above the mid of the channel. Usually, it becomes good support.
💥The targets in case of fall or close above the channel are diffrent. If the price fall to the channel bottom, the target will be at the top by +180%.
If the price close above the mid channel, the targets will be at the channel top by +70% and the order flow +229%.
I want to remind you, that these targets are only for the local growth. It will skyrocket during the full-fledged bull market!
like❤️ and follow
Check the links and get a BONUS🎁 from me👇
Long Comp to $58Got stopped out of my last position in COMP due to a trailing stop. Not mad tho. Ended up with 21% profit in the pockets. I hate to be out of this trade esp. since the MM's have been moving everything up during off hours. This bull flag here looks primed and prepped. Additionally, we have a hammer candle on the daily. Entry was 43.73. I'll target 58. SL will be 39 but trail upon profit as always.
Not fin advice.
Best,
Stew

Spotlight on COMP: Imminent Breakout and Bullish Momentum🚀 💎Yello Paradisers! Get ready for a thrilling venture with COMPUSDT. We've detected a triumphant escape from the descending channel, paving the way for a potential bullish ascent.
💎From our prior assessments, we witnessed the metamorphosis of demand into supply, with COMP revisiting the falling channel support.
💎At this time, the substantial volume in VRVP is signaling a probable bullish trajectory in the near future. Overcoming the monthly resistance is poised to reinforce this ascending momentum.
💎Conversely, if the price breaches the 45.45 level, it could amplify the bearish momentum, making it plausible for the price to revisit the former support level.
💎Trade with caution and implement stringent stop-loss measures. Stay vigilant to the evolving market conditions and keep abreast of further insights!

COMPUSD Huge bullish divergence can take it to 130.COMPUSD is consolidating under the MA50 (1w) since mid August with the RSI neutral/ borderline bearish.
There is a Rising Support on the RSI (1w), which is filled before every rally.
The Support Zone has priced all 3 of those RSI bottoms.
Trading Plan:
1. Buy the next pull back on the Support Zone.
Targets:
1. 130.000 (Rising Resistance as well as slightly under Fibonacci 0.5).
Tips:
1. The RSI's (1w) Rising Support is a huge Bullish Divergence. Those are typically formed during long term market bottoms and usually an aggressive break out follows. The next rally can be even stronger than we expect.
2. The MA100 (1w) is the last Resistance standing and its crossing can potentially accelerate the rally we just talked about.
Please like, follow and comment!!

Why You Must Trade and Not Invest. (2 Significant Reasons)Trading is a powerful term in the lexicon of financial conversations, often grouped with investing, indicating a strategy focused on gaining profits in the market. But dig a bit deeper, and you'll find that trading is not only different from investing, but it also offers its own unique set of exciting options for those who want a bit of adrenaline rush coupled with chances of quick returns and the prospect of compounding interest.
The Varied Landscapes of Trading and Investing
Trading and investing might seem similar, but they travel distinct paths toward wealth accumulation. Investing is a more leisurely stroll, buying and holding assets for a long-term ride, expecting to see capital appreciation and income generation. Trading, however, is more akin to a fast-paced sprint, with frequent buying and selling of financial instruments to bank on short-term price fluctuations.
Playing Safe: Risk Management in Trading
Trading tends to catch more than a few astute eyes due to its emphasis on risk management. Successful traders know that risk reduction and capital preservation are the cornerstones of their profession. Through stop-loss orders, they create a safety net, defining exit points in advance to sell, if the price trends go against their favor. This key tool helps them guard their investments and tame the untamed volatility of the market.
Spreading it Out: Benefits of Diversification
Where trading really shines is its ability to offer flexibility in portfolio diversification. Traders can quickly reallocate their capital based on shifting market conditions, constantly adapting, and making the most from potential profit opportunities.
*This is the example of the backtesting data that I am using for Algo-Trading
As you can see, if there are two different people who wants to trade and invest each, they would face total different result after years because the trading has stoploss to reduce the volatility of fluctuation and account value reduced and able to compound bigger amount of the money. In this example, trade shows +4012% but the invest(holding) shows +53% only.
Augmenting Wealth with Compound Interest
Commonly referred to as the 'eighth wonder of the world', compound interests serve as a reliable ladder for traders to climb the wealth mountain. The power of compounding accelerates profit accumulation, particularly when compared to traditional investing's reliance on long-term appreciation and reinvestment of dividends. Given appropriate strategies and risk management techniques, the compounding effect can yield truly remarkable returns.
Practical Guidelines to Mastering the Trade
Master the art of technical analysis: The more you understand chart patterns, indicators, and market trends, the better-equipped you will be to predict price movements, thereby making well-informed trading decisions.
Develop a robust trading strategy: The foundation of successful trading is a well-detailed strategy encompassing entry and exit criteria, risk management principles, and diversification guidelines.
Practice disciplined risk management: Adhere to set stop-loss orders religiously and never risk more than a predefined percentage of your trading capital on a single trade.
Learn from both successes and failures: Trading is a journey of constant learning, and every trade holds a lesson. Examining your trades, spotting patterns, and understanding both winning and losing situations can improve your decision-making skills tremendously.
Closing off, trading brings with it its fair share of excitement, quick returns, and the potential for compound interest gains. Armed with knowledge on risk management and diversification, and abiding by well-defined trading strategies, you can confidently venture into the markets. It's key to remember that trading also presents its own risks and needs constant learning and practice. If you're ready to set sail on a thrilling journey, trading might be your desired route. All the best, and here's to happy trading!
Follow and Boost for your financial success !
Write your thoughts in the comment section.

COMP Trade UpdateTraders,
Just realized I wasn't able to post the very fortunate trade entry that was made by me during our most recent flash crash a few days ago. I missed this post due to being briefly banned by TradingView for inadvertently violating House Rules.
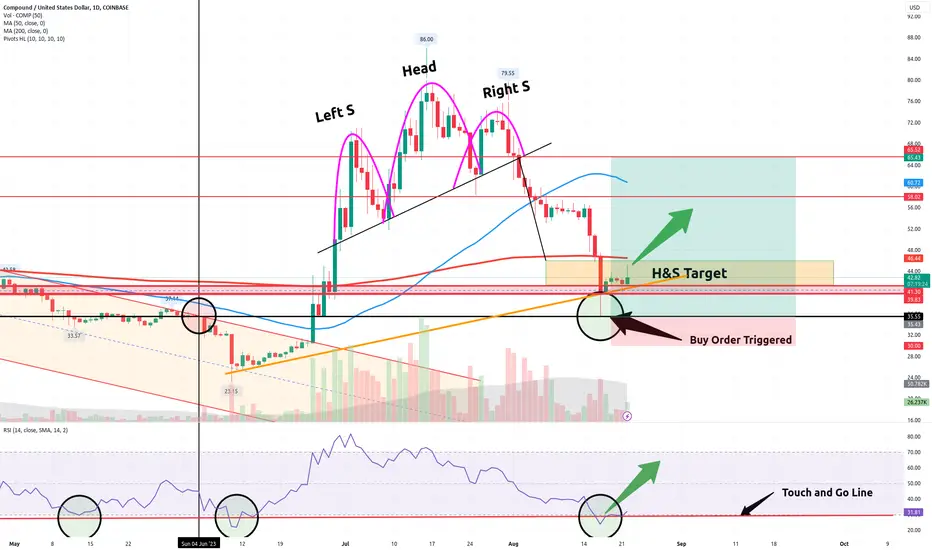
Long story short, I happened to be sitting at my computer that evening and was perusing the charts per the usual manner. I noticed that COMPUSD had reached its target down from the recent Head and Shoulders pattern seen. But because the selling pressure was so heavy I decided to set my buy order even lower per chance I might get the order triggered and filled. Therefore, I looked for the next best level down and found that level at 35.55. This is where I set my buy order. Lo and behold it was filled! In fact, my chart which gathers data from the Coinbase exchange here, shows the candle wick bottomed only a few cents lower at 35.43! This, traders, is why charting levels, trends, and patterns can be very helpful.
Technical analysis is not always right. In fact, we have to count on a good percentage of our analysis being wrong. Such was the case in quite a few of my last entries which were stopped out during this flash crash. But TA gives us much better insight into what the probability of the trade becoming profitable might be. Pair TA with some fundamental analysis and you are well on your way to becoming a seasoned trader.
Back to this chart. You can see that we remain in the H&S Target box. From a technical perspective, this remains a good re-entry area.
Here are the positives:
RSI back above support
RSI still near oversold
Price in H&S Target Box
Price above good support (red area)
Here are the negatives, including fundamental considerations:
China FUD re: Evergrand bankruptcy
Elon FUD selling BTC
Macro-economic uncertainty = risk-off
Fed Powell Speech Friday
And one TA negative is that current candle is a shooting star
As you can see, technically the trade remains in your favor. But there is a lot of FUD out there. Be cautious. Never risk more than you can afford to lose.
Best,
Stew
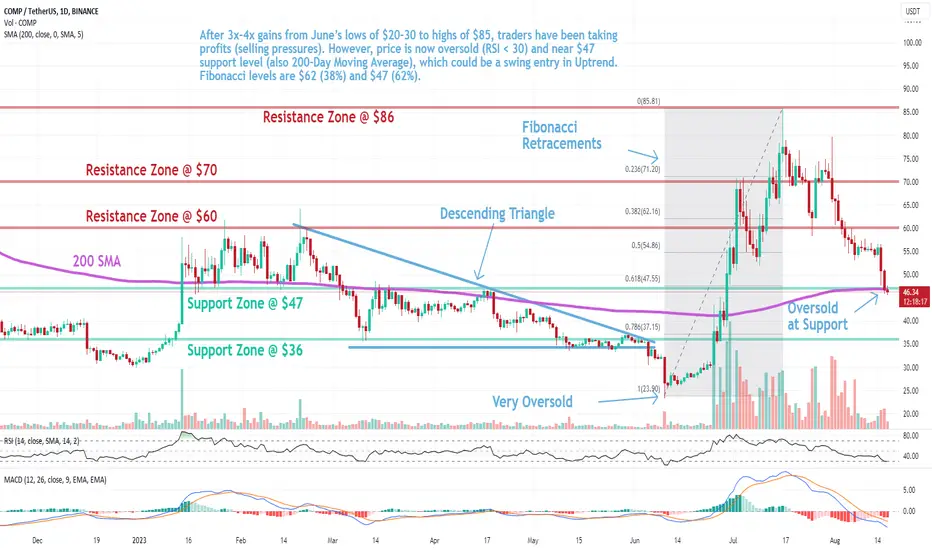
COMP: Oversold at SupportCompound (COMP) technical analysis:
Trade setup : After 3x-4x gains from June’s lows of $20-30 to highs of $85, traders have been taking profits (selling pressures). However, price is now oversold (RSI < 30) and near $47 support level (also 200-Day Moving Average), which could be a swing entry in Uptrend. Fibonacci levels are $62 (38%) and $47 (62%).
Trend : Downtrend on Short-Term basis, Neutral on Medium-Term basis and Uptrend on Long-Term basis.
Momentum is Bearish (MACD Line is below MACD Signal Line, and RSI is below 45).
Support and Resistance : Nearest Support Zone is $47, then $36. The nearest Resistance Zone is $60 (previous support), then $70, and $86.
.618We’re at the .618 area of retrace,ent which typically has some support but I believe we could se a further drop to $43 or even $38…. $28 is the last resort….Plan to see some movement in these areas, and hold for the long term gain. Once we break back over $78 we could see it follow the strong bull market.
There is a possibility of getting a scalp trade from $61-$63 off this level, but let’s not try to catch a falling knife. Only when we see some more stable support and volume would it be a good idea to scalp.
Good luck and have fun with it
Fair Value Gap around $48 | Good zone to buyChart 4H TF
Compound BINANCE:COMPUSDT is pulling back to resistance around $56
If price reject that level again, you know what need to do
Just wait reaction at that level and decide
COMPUSDTHello traders
AS the USDT.D is seizing all the market focus on short positions .
COMP one of the best for buy when hit the drawn support.
Dangerous trendline is broken .
COMPUSDT Can Explode at Any Moment | Compound Analysis Today💎 COMPUSDT is showcasing an optimistic outlook, poised to accelerate its momentum imminently.
💎 Notably, COMP has been tracing the Elliot Wave sequence from 1-5. Post this wave, the price underwent a correction and revisited its support.
💎 At this juncture, COMP has secured liquidity and seems prepped for its subsequent ascent. Yet, caution is advised as a dip below the $49-$47 support range could alter the course.
💎 The primary and secondary support zones emerge as promising entry points to capitalize on this anticipated bullish surge.
💎 In the ever-evolving realm of crypto, staying informed is the key to thriving. Stay tuned and navigate your trading journey wisely with #MyCryptoParadise.

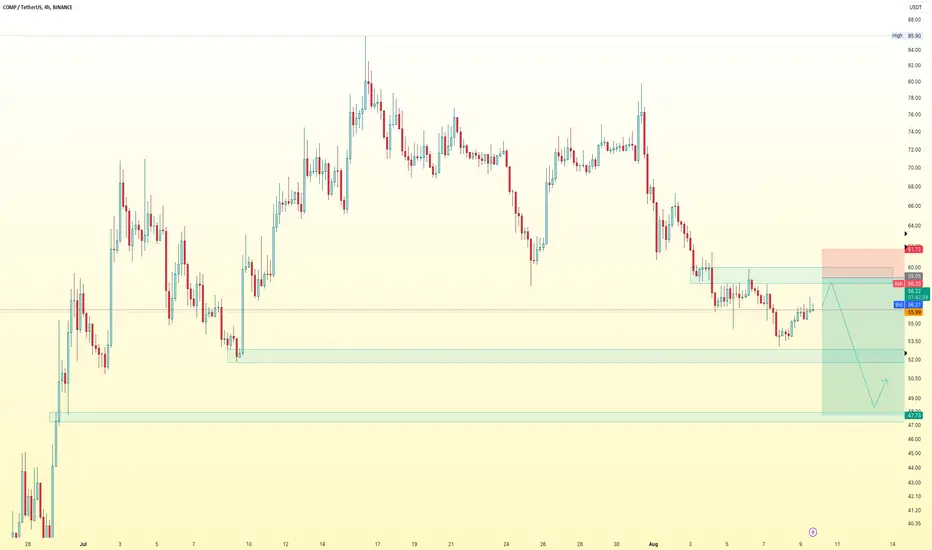
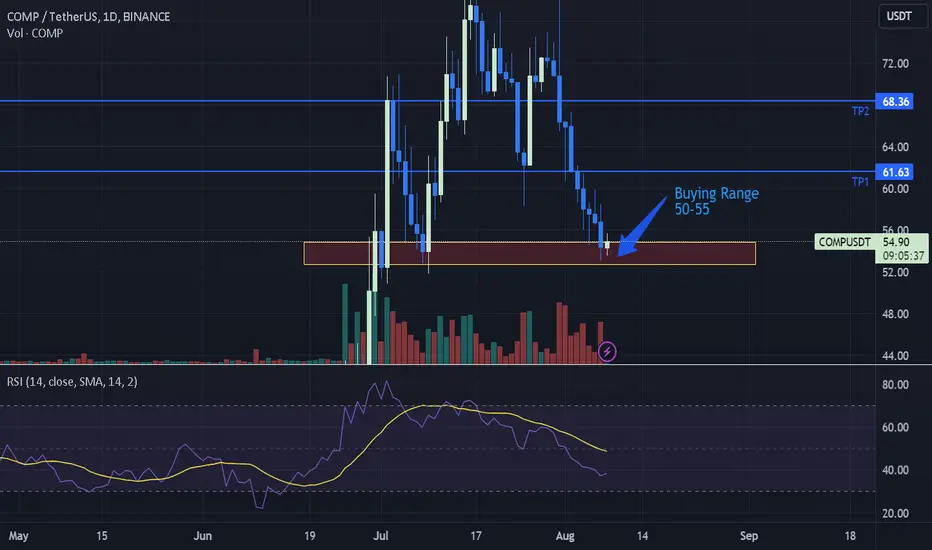
COMP/USDT Swing setupSmaller allocation as the entire market is a bit strong on the bearish side. Buying range and TPs mentioned.
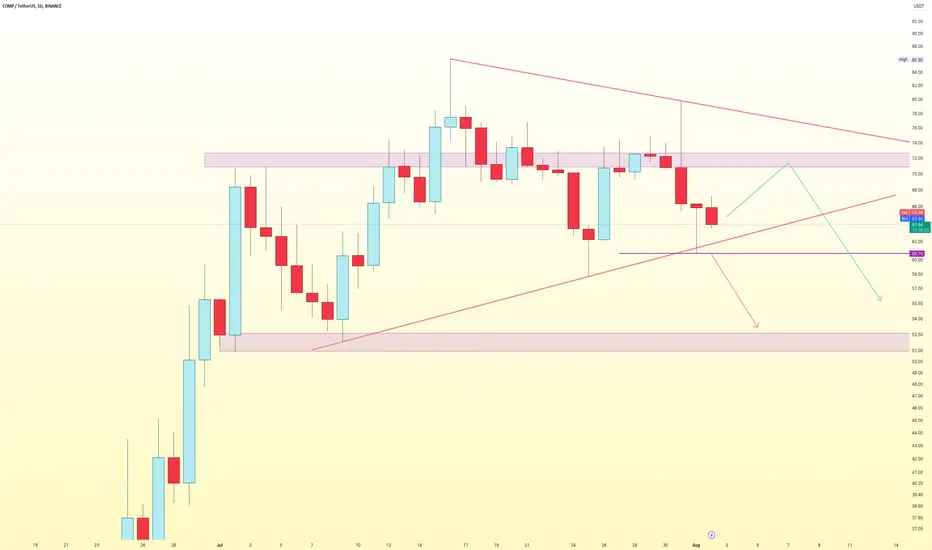
Triangle Pattern | $52Daily Chart
Compound BINANCE:COMPUSDT is in the triangle pattern and trading at 63.9x
Compound rejected 3 times from the support. That means it can go up to the resistance around 72 or further higher trend line
If Compound close below 60, it will go down the support around 52
Wait for next move
Beware H&S comingI don't like what compound it's drawing in daily time frame, so beware if the resistance will break, surely we will touch 44/33 USD
Compound COMP price rose from the dead)The Compound project was fundamentally quite strong when it was sold / presented to crypto market participants)
However, over the 2 years of being in a downward trend, the price of t he COMP token has fallen 39 times from a high of $910 to a low of $23.
And now, in the last two weeks, a miracle has happened, the price of CompUSDT has come to life and is showing steady growth. Moreover, it is catching up with the crypto market, which started growing much earlier.
Currently, looking at the chart, we do not believe that the CompUSD price will break through and consolidate above the strong resistance zone above $55-65 at the first attempt.
Unless you have an insight as to why the COMP price should grow non-stop right now, then please share it in the comments)
In all other cases, we consider it safe to buy COMPUSDT only when the price is firmly established above $65
_____________________
Did you like our analysis? Leave a comment, like, and follow to get more

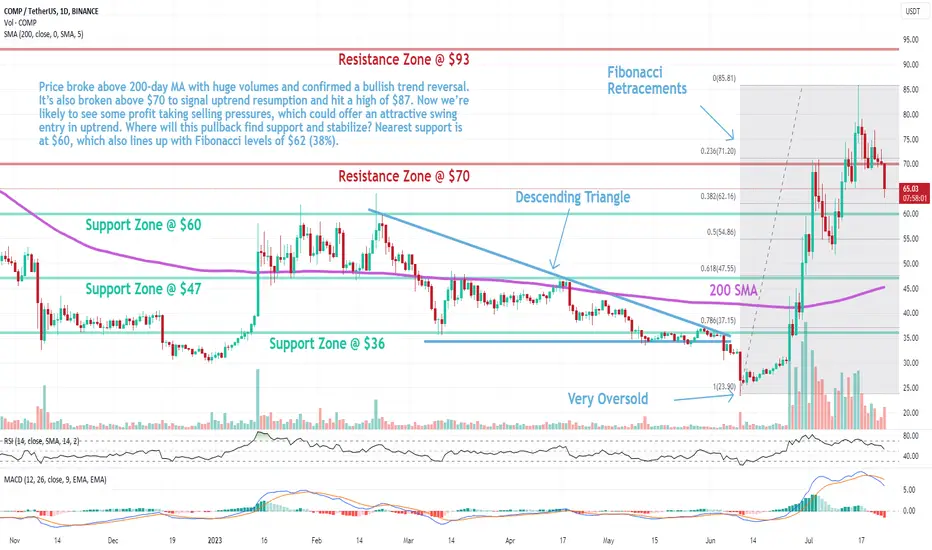
COMP: Pullback in UptrendCompound (COMP) technical analysis:
Trade setup : Price broke above 200-day MA with huge volumes and confirmed a bullish trend reversal. It’s also broken above $70 to signal uptrend resumption and hit a high of $87 where some trader began taking profits. Priced pulled back to the nearest support of $60, which also lines up with Fibonacci levels of $62 (38%) and bounced right off of that. Upside potential to $90 next.
Trend : Uptrend across all time horizons (Short- Medium- and Long-Term).
Momentum is Mixed as MACD Line is below MACD Signal Line (Bearish) but RSI > 55 (Bullish). MACD Histogram bars are rising, which suggests that momentum could be nearing another upswing.
Support and Resistance : Nearest Support Zone is $60 (previous resistance), then $47. The nearest Resistance Zone is $70, which it broke, then $93.

COMPUSD: 1W candle turning green pointing to a rally continuatioCOMPUSD has been a very profitable crypto for us lately (last idea at the bottom) and as it crossed above the 1 year Channel Down invalidating it, the 1W timeframe turned bullish (RSI = 65.140, MACD = 5.050, ADX = 32.042).
If the 1W candle closes green on this bullish pinbar, we will buy again and target the 1W MA100 (TP = 100). The upside potential is significant as the recent Bullish Cross on the 1W MACD was formed under the 0 level.
Prior idea:
## If you like our free content follow our profile to get more daily ideas. ##
## Comments and likes are greatly appreciated. ##

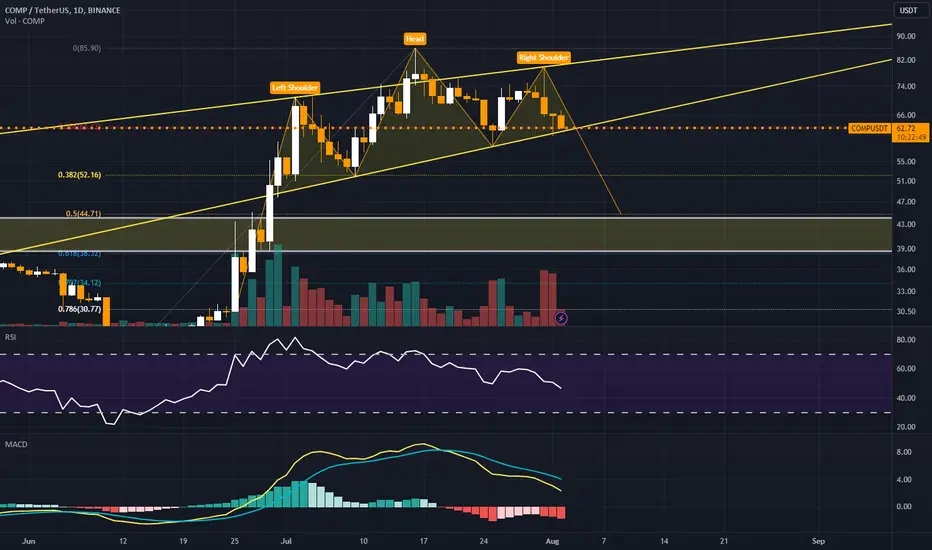
COMP: Pullback in UptrendCompound (COMP) technical analysis:
Trade setup : Price broke above 200-day MA with huge volumes and confirmed a bullish trend reversal. It’s also broken above $70 to signal uptrend resumption and hit a high of $87. Now we’re likely to see some profit taking selling pressures, which could offer an attractive swing entry in uptrend. Where will this pullback find support and stabilize? Nearest support is at $60, which also lines up with Fibonacci levels of $62 (38%).
Trend : Uptrend across all time horizons (Short- Medium- and Long-Term).
Momentum is Mixed as MACD Line is below MACD Signal Line (Bearish) but RSI > 55 (Bullish).
Support and Resistance : Nearest Support Zone is $60 (previous resistance), then $47. The nearest Resistance Zone is $70, then $93.
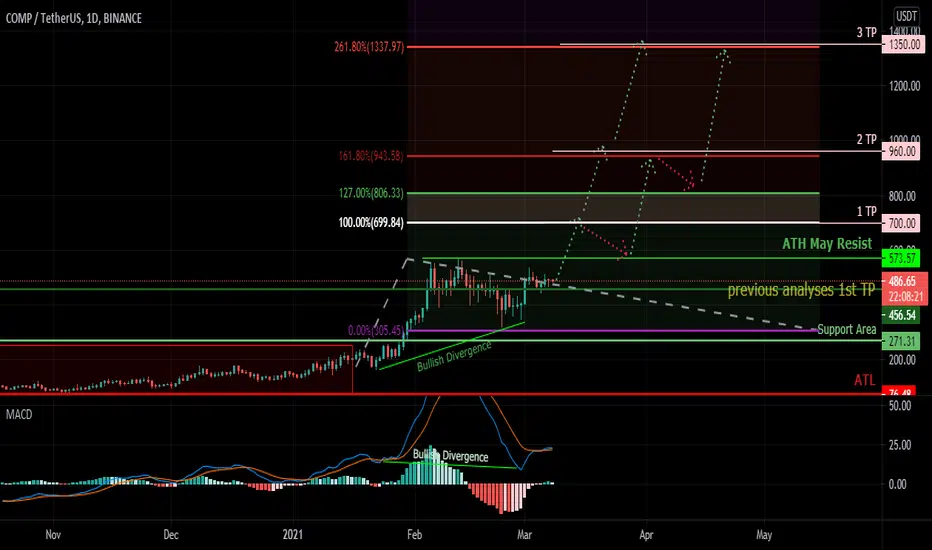
Compound Token (COMP) Analysis 08/03/2021we had our previous Publications TP Achieved
currently we can see a Bullish Hidden Divergence of price with MACD, which is the sign of trend continuation,
using Fibonacci Projection for the Target Specifications.
1TP is the parallels leg of Fibonacci projection and easy to achieve by nest impulse wave after the current retracement.
if 2TP triggered with the first rally then we may have a price correction and our 3 TP is confirmed.
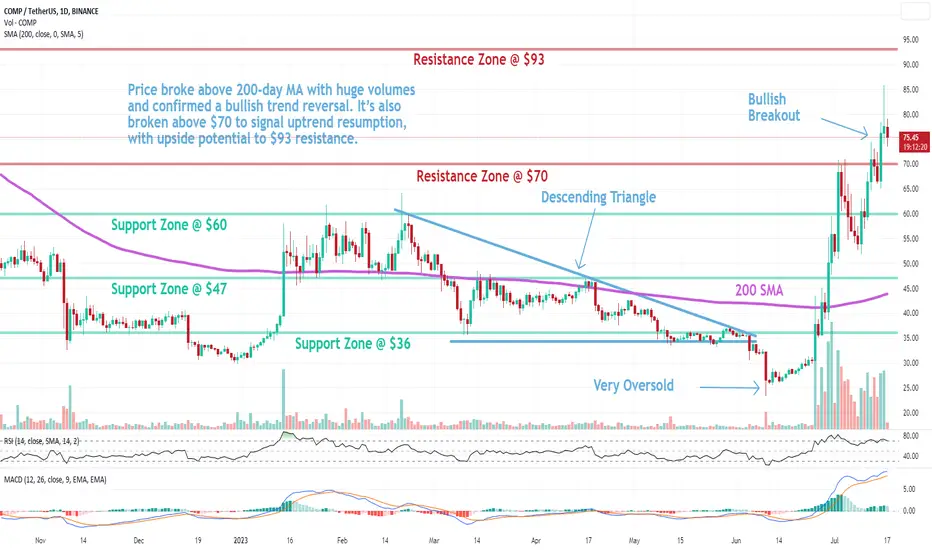
COMP: Resistance BreakoutCompound (COMP) technical analysis:
Trade setup : Price broke above 200-day MA with huge volumes and confirmed a bullish trend reversal. It’s also broken above $70 to signal uptrend resumption, with upside potential to $93 resistance.
Trend : Uptrend across all time horizons (Short- Medium- and Long-Term).
Momentum is Bullish (MACD Line is above MACD Signal Line and RSI is above 55).
Support and Resistance : Nearest Support Zone is $60 (previous resistance), then $47. The nearest Resistance Zone is $70, which it broke, then $93.