FTM Major Breakout or Rejection Incoming?!?Lets take a look at this beautiful confluence on FTM. A confluence this clean from major pivot highs do not come around often and what I can say is that the smart thing to do at these levels would be to enter a short position with stop above the wick high.
Some people might trade this as a potential breakout, with a stop loss 1% to 2% below entry while managing your position size isn't a terrible idea but the most probable outcome is for price to reject a little from here.
Calculate Your Risk/Reward so you don't lose more than 1% of your account per trade.
Every day the charts provide new information. You have to adjust or get REKT.
Love it or hate it, hit that thumbs up and share your thoughts below!
This is not financial advice. This is for educational purposes only.
Confluencetrading

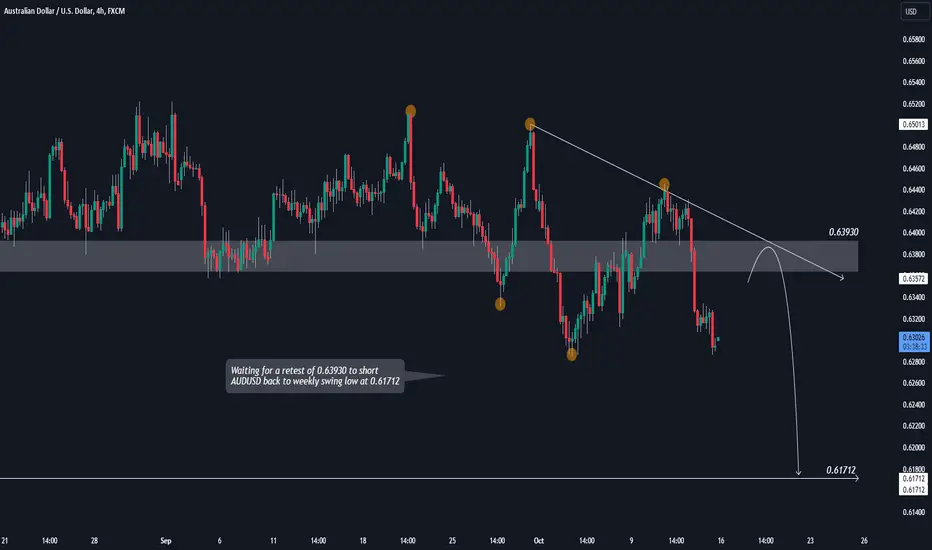
AUDUSD SHORT - WAITING FOR A PULLBACK!Waiting for a retest of 0.63930 to short AUDUSD back to weekly swing low at 0.61712
If you agree drop a like and if you have any questions leave a comment :)
USD/CAD HTF Bullish Confluence? Multiple Breakout OpportunitiesBullish Outlook
In this post (Bearish Outlook and former post update below), I highlight the potential bullish confluence we’re seeing on multiple higher time frames. This HTF reversal could begin with the former strong support level that we broke through but could act as support again – this would create an extremely convincing Inverse H&S as our left shoulder has tons of liquidity already built up.
Current Buy Trades:
On the Mid Time frame (2hr) - If we do break out on the 2HR with a healthy retest and bullish CHoCH, we will reconsider for a potential IHS signal upward toward the mitigated HTF supply zone and attempt to create a Major CHoCH to the upside.
On the higher Time Frame: we should keep an eye on the weekly and daily charts for pattern confluence and strong level breakouts.
This potential confluence of the bullish flag and Inverse H&S on the weekly is showing strong signs as the selloff has been controlled within this channel and if we do see a breakout of channel and neckline, we could make our HTF move up.
Confluence:
If we do see some bullish structure start to form, we might see confluence on multiple time frames which would be a very bullish HTF signal:
1. 2HR – Bullish breakout of ascending triangle and CHoCH
a. Subsequent BOS and LTF trade signal to upside.
2. Daily – Inverse H&S neckline retest and breakout
a. Resistance to turn support
3. Weekly – Breakout of bullish flag upper channel and neckline of IH&S.
LAST POST Summary and Update: (Bearish Outlook)
As I mentioned in my previous post, on the higher time frame weekly chart we mitigated our demand zone and hit expected resistance at the top of our bearish channel and failed to make a higher high. We then smashed through a strong support level and created a major CHoCH. We just recently mitigated that higher time frame supply zone but failed to make a high so we are currently on the bearish path toward a new lower low.
Our projected trade from last post (linked below) is still in play and awaiting its Choch signal. As we can see we have twice mitigated our LTF supply zone as I mentioned would occur in my previous post (linked below), and are awaiting an entrance signal via 2HR (MTF) CHoCH and subsequent 15min supply zone mitigation.
Current 2HR Sell trade:
We are now creating an ascending triangle and although typically a bullish signal, due to the HTF outlook, I’m looking for a potential liquidity grab from the upper resistance level and a fake out. If we do grab liquidity and see a strong move I’m looking to short this on the rejection of the triangle breakout.

Buyers need this liquidity. Multi-TF confluence short tradeEUR/CHF – 9.27
We are at the top of our HTF Supply zone where we are just breaking through the strong resistance at the top of a HTF symmetrical triangle. I’m not convinced of this breakout and am expecting this to be a liquidity pull above former structure. I see an opportunity here to short the liquidity grab and ride price back down into the triangle and toward required liquidity.
Why I think it’s going down short term:
1. We just created a major CHoCH on the daily and have yet to mitigate the major demand and liquidity zone that it created below
2. That same demand zone is sitting at a HTF support level so it is the ultimate liquidity source for bulls
3. We also just broke out of and retested a MTF ascending wedge which typically indicates a reversal in trend
4. Rejected at major resistance above - lacking liquidity to push higher
Good R:R trade opportunity considering we are at the top of potential reversal – LTF just made a CHoCH and we are awaiting a LTF Supply zone mitigation to enter our trade.
There is also a bigger R:R opportunity for our TP2 which is the bottom of the triangle and another strong HTF support level.
For this trade , we are awaiting a post-CHoCH reversal confirmation with a supply zone mitigation and LTF (5/1min) BOS
Stop loss is above our MTF (2HR) supply zone
TP1 at retest of upper triangle & HTF support level = 2.2 R:R
TP2 at retest of lower triangle support = 4.9 R:R

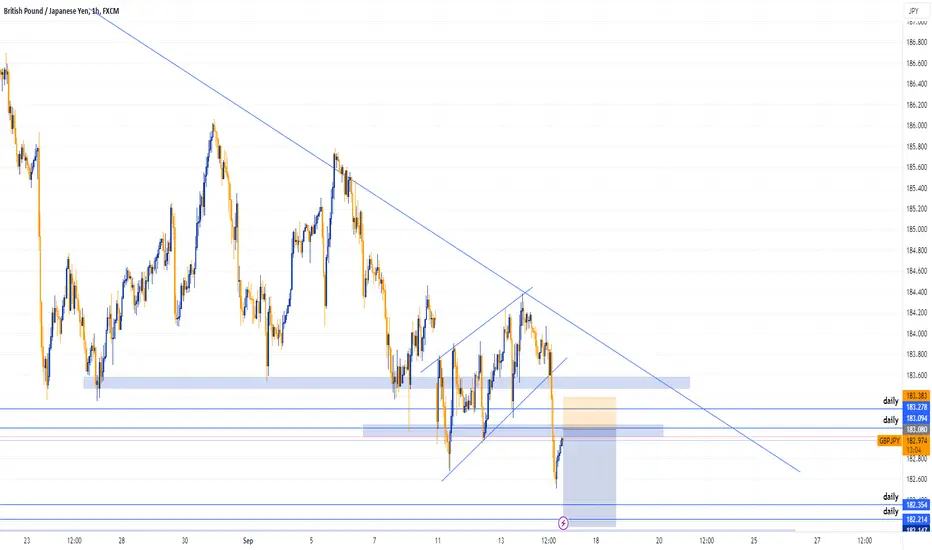
GBPJPY SellFX:GBPJPY
GBPJPY broke below 183.094 Daily support and made a retest to previous support now turned into resistance. I am anticipating a move to the downside during the Asian session going into London session.
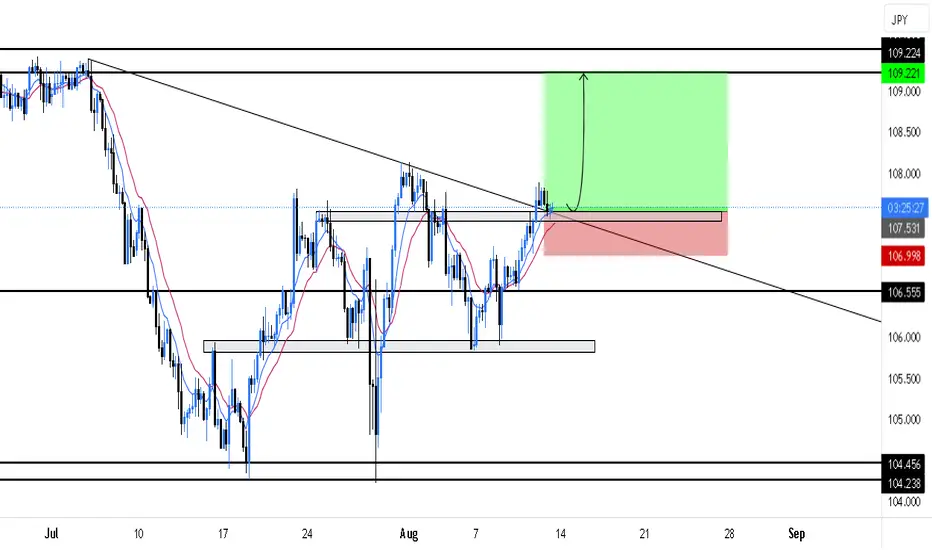
CADJPY LONGWith both EMA's showing a correlation on the Daily and H4 timeframe signaling a strong upwards momentum. A trendline and H4 support are being retested after a break and closure above both levels. CADJPY is currently giving us the confluence to go long.
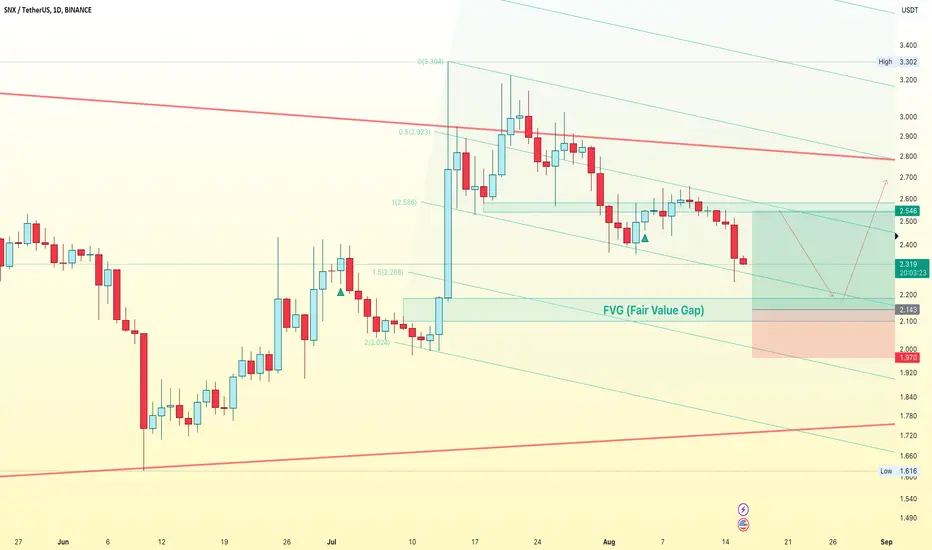
Good Signal for Long PositionWeekly Chart
BINANCE:SNXUSDT has tested and failed Head Shoulders Pattern so it's still in Triangle Pattern
We zoom out to daily chart
Now, it's trading at 2.31x and can be down more
I found a fair value gap (FVG) around 2.15 and this level is also a confluence zone by 0.618 Fib Re and 1.618 Fib Re
That's why I think SNX will bounce back with nearly 20% profitable
Wait and see what happen
What do you think, share it to me
EURGBP LONG - ONE MORE LEG HIGHER!Waiting for a retest of 0.66230 to long EURGBP back to 4H swing high at 0.86847
If you agree drop a like and if you have any questions leave a comment :)

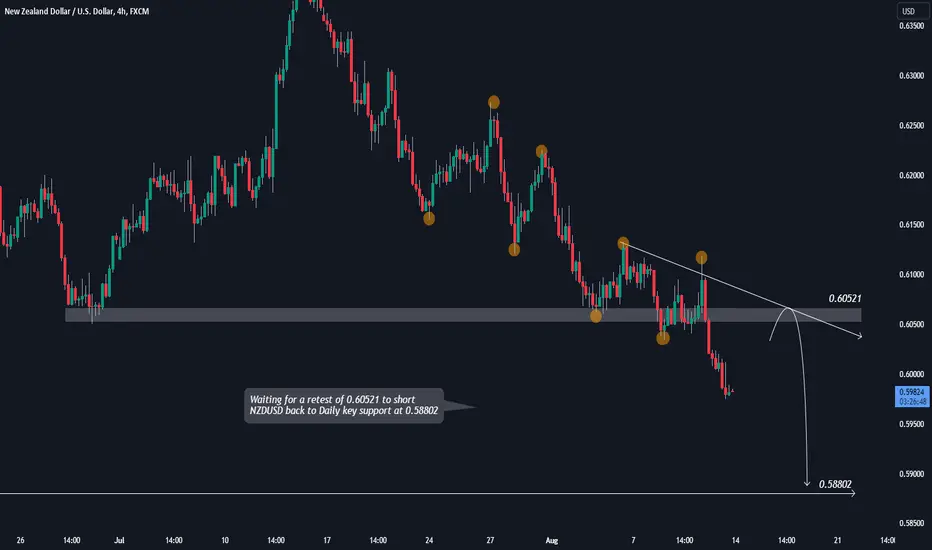
NZDUSD SHORT - STILL A LONG WAY TO GO!Waiting for a retest of 0.60521 to short NZDUSD back to Daily key support at 0.58802
If you agree drop a like and if you have any questions leave a comment :)
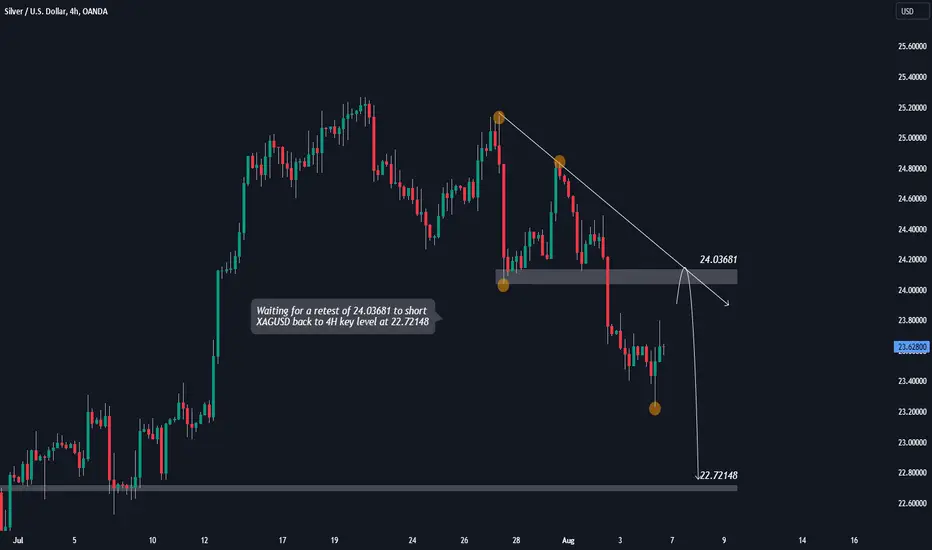
XAGUSD SHORT - WAIT FOR A CORRECTION!Waiting for a retest of 24.03681 to short XAGUSD back to 4H key level at 22.72148
If you agree drop a like and if you have any questions leave a comment :)
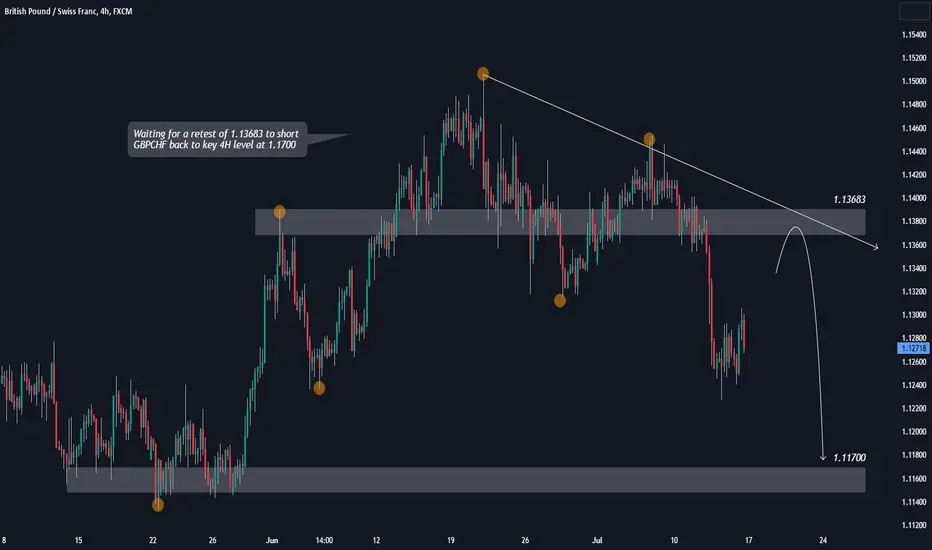
GBPCHF SHORT - KEY AREA OF CONFLUENCE!Waiting for a retest of 1.13683 to short GBPCHF back to key 4H level at 1.1700
If you agree drop a like and if you have any questions leave a comment :)
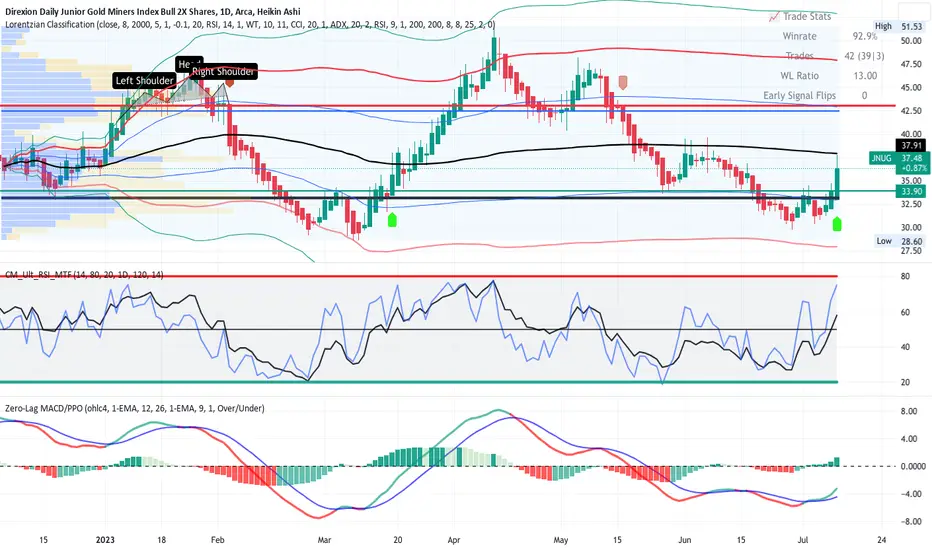
JNUG- Gold is Going Higher ( LONG)Gold is rising and so also JNUG the triple-leveraged junior miner ETF which has components
of miners that have the most to benefit from rising. On the daily chart, price dropped from
a winter pivot high with a head and shoulders pattern into a trend down with a bounce off
the lows in early March followed by a YTD pivot high in mid April followed by a trend down
into the July 4th holiday where the reversal from the low into the current price movement
is supported by the MTF RSI indicator showing both the low and high TF RSIs crossing the 50
level. The zero-lag MACD shows the histogram going negative to positive simultaneously
with the K /D lines crossing from underneath and beginning to rise. Importantly the Lroentzian
machine learning AI indicator using a variety of indicators and factors printed a buy signal
earlier this same trading day. I will go long in a swing trade expectant of great profit. I can see
that price is approaching the long term mean VWAP and has crossed over the POC line of
the lower high volume area. The target of 43.2 is the POC line of the upper high volume
area confluent with the first standard deviation above that mean VWAP and also the neckline
of the H & S this past winter. The analysis is strong from the confluences and so
expectant of 15-20% profit.
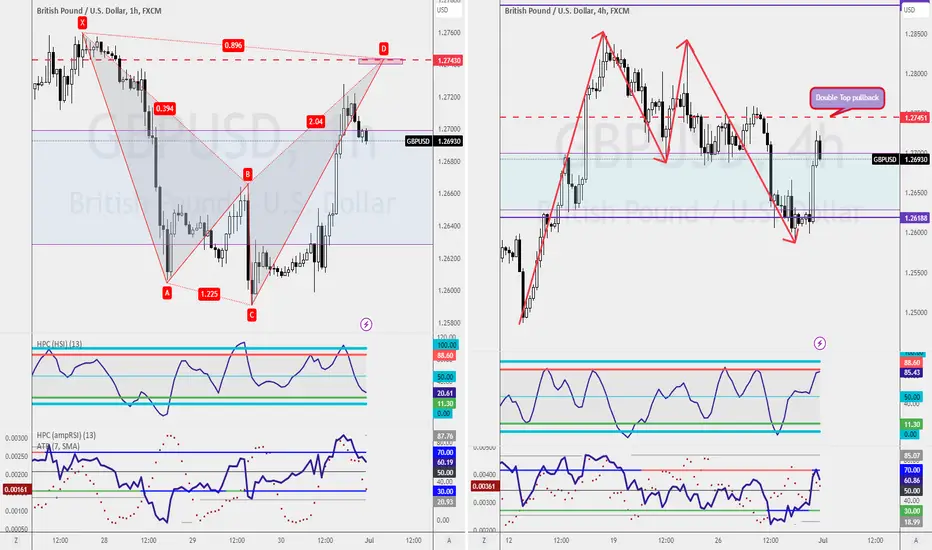
Aggressive Buying🔍 Current Situation: No favourable buying opportunity on GBPUSD, but counter-trend trading possibilities exist.
🔴 Retest of Double Top: Watch for a retest of the double top pattern completing at 1.2745 on the 4-hourly chart. Traders eyeing a reversal will be attracted. #DoubleTopPattern
🦈 Bearish Shark Pattern: Keep an eye on the Bearish Shark Pattern completing at 1.2743. Short-savvy traders may join in. #SharkPattern
💥 Market Reaction: As two trader groups converge at 1.2745, expect heightened volatility and rapid movements. Stay prepared! #VolatilityAlert
📊 Trade Strategy: Exercise caution with counter-trend trades. Set conservative targets and manage risk effectively. Scale in wisely. #RiskManagement
👀 Stay Vigilant: Continuously monitor price action and adapt your approach as the market unfolds. Protect your capital! #StayAlert
Navigating the Golden Realm❣️"Unveiling Secrets of the Gold Market for Traders"
Welcome to the captivating world of the gold market, where you as (new) trader embark on a metaphorical journey filled with price movements , trends , and profitable opportunities .
In this comprehensive guide , i will delve into the intricacies of trading gold, empowered with knowledge that will enhance trading strategies. From deciphering patterns to understanding correlations , i will unlock the secrets of the golden realm, equiped with the confidence to make informed decisions.
So fasten your seatbelts and get ready to navigate through the twists and turns of this enchanting market.
Range Trading - The Breakfast Feast
Picture yourself at a lavish breakfast buffet, where a wide array of options tempts your taste buds.
Similarly, range trading in the gold market offers a delectable spread of trading opportunities. By identifying key support and resistance levels , you can effectively navigate within a defined price range. Just as you would choose from a buffet, traders can enter buy positions near support and sell positions near resistance.
Deciphering Trends - The Path to Success
In the golden realm, trends serve as beacons of guidance for traders. Analyzing price movements over time helps uncover valuable insights into the direction of the market. By identifying uptrends, downtrends, or sideways trends , strategies can be aligned accordingly. Utilizing tools like moving averages and trend lines, may create a clearer picture of the market's path, allowing you to ride the waves of success.
Breakouts - Seizing the Golden Moments
Just as a phoenix rises from the ashes, breakouts in the gold market signify the birth of new opportunities. Breakouts occur when the price breaches a significant resistance or support level, often indicating a shift in market sentiment. Trades will be positioned to take advantage of these golden moments by entering in the direction of the breakout. However, it is crucial to denote confluences and employ proper risk management techniques or wait for confirmation before diving into the fray.
Correlations - Unveiling Hidden Connections
The gold market is not an isolated realm; it is intricately connected to other financial markets. Understanding correlations between gold and other assets can provide valuable insights. For instance, a negative correlation with the U.S. dollar may indicate that a weaker dollar could lead to increased gold prices. By monitoring these relationships and recognizing their impact, you can make more informed decisions and maximize profit potential.
Retesting - A Second Chance
In the golden realm, opportunities often come knocking twice. Retesting occurs when a price level that was previously broken acts as a new support or resistance. Traders can capitalize on retests by entering positions in the direction of the original breakout. This phenomenon can provide a second chance to those who missed the initial move or wish to reinforce their existing positions. By identifying and evaluating retesting scenarios, you will enhance your trading strategy and seize these hidden but well-known opportunities.
☆
As we conclude this journey through the golden realm, you could now posses a deeper understanding of the gold market's intricacies. By embracing range trading , deciphering trends , seizing breakout moments , unraveling correlations , and recognizing retesting opportunities , you can navigate this enchanting market with confidence. Armed with technical indicators, pattern analysis, and an awareness of session transitions, you will unlock the potential for profitable opportunities.
So, fellow aspiring traders, step into the foreign exchange golden realm armed with knowledge and embark on your path to success, b e ready to make informed decisions and claim your share of the golden treasures.
HappyTrading 🤠 J

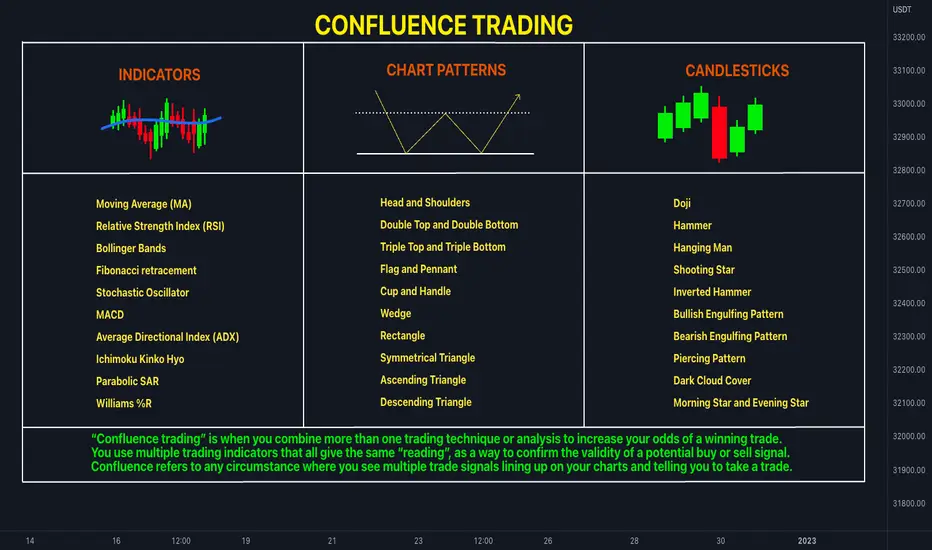
✔️Confluence Trading📍What is “confluence trading”?
“Confluence trading” is when you combine more than one trading technique or analysis to increase your odds of a winning trade.
You use multiple trading indicators that all give the same “reading”, as a way to confirm the validity of a potential buy or sell signal.
Confluence refers to any circumstance where you see multiple trade signals lining up on your charts and telling you to take a trade.
Here are some indicators, chart patterns and candlestick patterns you can use for confirmation of your trade.
🔹Indicators
Moving Average (MA)
Relative Strength Index (RSI)
Bollinger Bands
Fibonacci retracement
Stochastic Oscillator
MACD
Average Directional Index (ADX)
Ichimoku Kinko Hyo
Parabolic SAR
Williams %R
🔹Chart Patterns
Head and Shoulders
Double Top and Double Bottom
Triple Top and Triple Bottom
Flag and Pennant
Cup and Handle
Wedge
Rectangle
Symmetrical Triangle
Ascending Triangle
Descending Triangle
🔹Candlestick patterns
Doji
Hammer
Hanging Man
Shooting Star
Inverted Hammer
Bullish Engulfing Pattern
Bearish Engulfing Pattern
Piercing Pattern
Dark Cloud Cover
Morning Star and Evening Star
👤 @AlgoBuddy
📅 Daily Ideas about market update, psychology & indicators
❤️ If you appreciate our work, please like, comment and follow ❤️
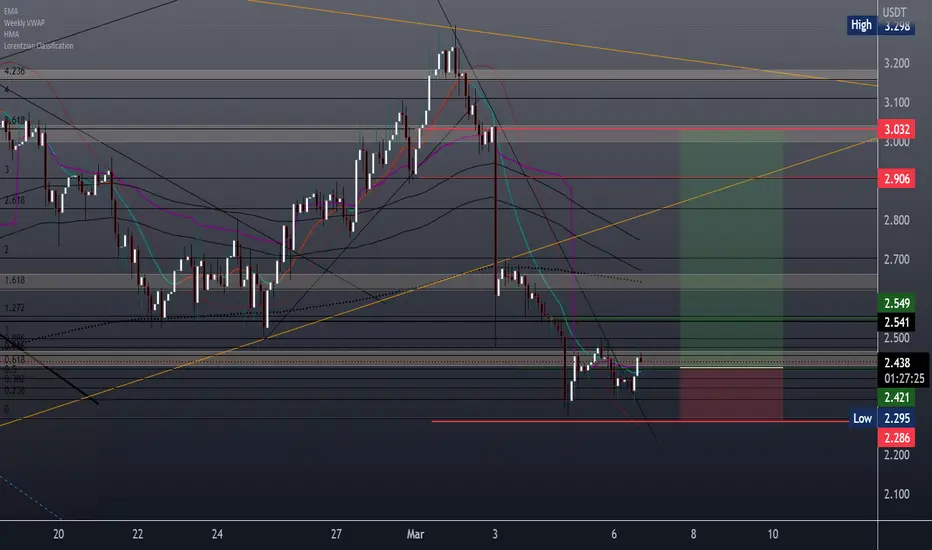
DYDX Long
DYDX Long Immediate input or limit to the value indicated for 1 input.
]You can make a 2 enter mai above and share the amount so as not to pay a expensive myth stop.
Input above the weekly VWAP, already broke the downtown trendline then and good signal.
Output in the largest volume area in the volume profile with confluence of Fibonacci Areas.
Not the finance Advice
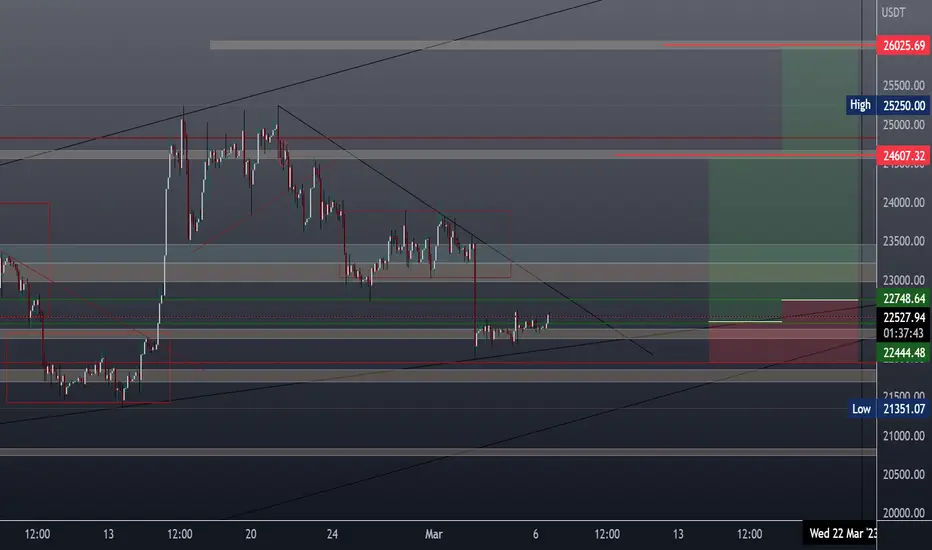
BTC swing Long
2 BTC long entries above the weekly VWAP awaiting the disruption of Trendline from the 2 Hours Lower.
The first breaking entrance, the second entry a Pullback purchase.
The 2 outputs are in profile confluence areas with Fibonacci areas.
It is not a financial advice.
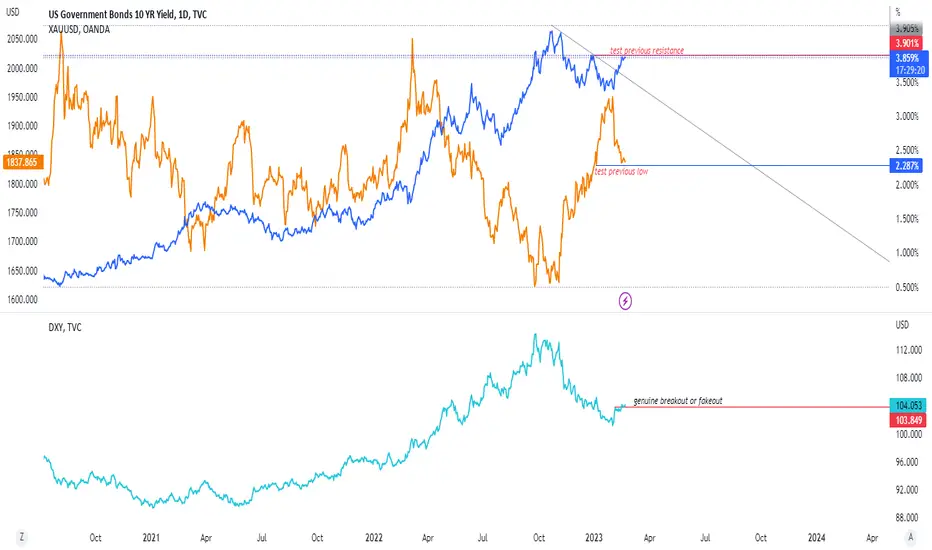
US10Y, XAUUSD AND DXY CONFLUENCE Hi trader
The xauusd is trying support and the us10yr is testing previous resistance, but the dxy is already in a breakout phase, so guess? :)
My trading strategy isn't intended to be used as a signal service. It's a process of gaining knowledge of market structure and improving my trading abilities.
Like and subscribe and happy trading to all
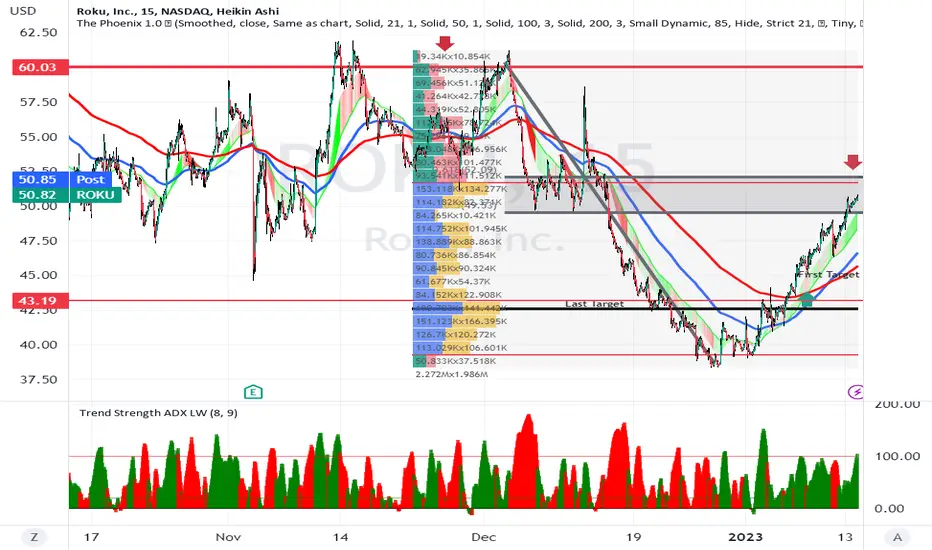
ROKU setting up a SHORT TRADE ROKU double topped on November 14 and December 2 and then dropped in a downtrend
until 12/28 and reversed. The mid Fib levels of the retracement a drawn onto the chart
are being approached.
I look for ROKU to bounce down off the Fib Level at 52. 2 and drop to approach the SMA 200 ( Red Line)
after first crossing under the SMA 100 ( Blue Line ) and then to the POC line of the volume profile
where buyers should take over and support price. Overall three targets ( SMA 100, SMA200, POC)
and a three tier take profit scheme for a very conservative trade.
NAS100 LONGCURRENCYCOM:US100
Nasdaq is moving bullish after breaking out of a resistance level and retesting on the same resistance it broke out, turning it into support. Price retraced at the 38.2% Fibonacci retracement level and a bullish engulfing candle to create a high confluence setup for a buy on Nasdaq.

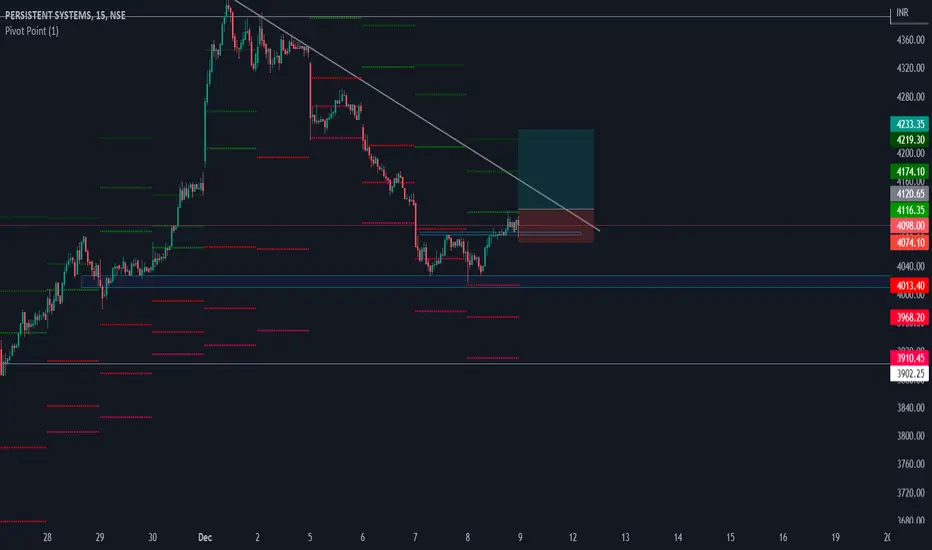
Persiste Price PredictionBest Confluence Setup For Trading
Perfect Setup For Intraday & BTST
It just took a bounce from 50% fib level in daily time frame, In 15m it formed a W pattern and broke out of it.
We have a resistance at 4120.50 if we get a 5m candle closing above this we can take a long trade in the first half.
There is 200 EMA & Pivot as well around 4120.50 so watch out this level,
As per the OI we have 4100 as resistance.
Buy at or above 4121
Comment if you have any question or query.
Happy Trading !
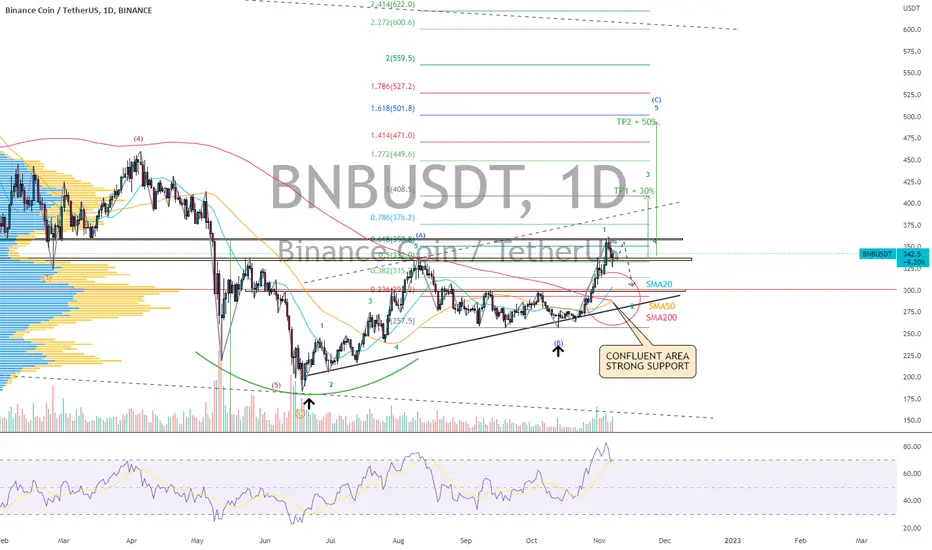
BNBUSDT | Wave Projection | Short Term Retrace - Bull Look +60%Price action and chart pattern trading:
> A possible CUP & HANDLE pattern with a short term 2-wave retracement to the next strong support area of confluence where SMA20 X SMA200 golden crossed and volume profile point of control key level.
> Entry @ pullback retracement SMA200 zone and lower uptrend channel support zone.
> Target @ TP1 Handle 1.0 extension + 30-40% upside and TP2 Cup 1.618 ext. zone +50-60%
> Stop @ B-wave position -10-15% downside
> RSI indicator: OB + bearish signal about to cross MA line