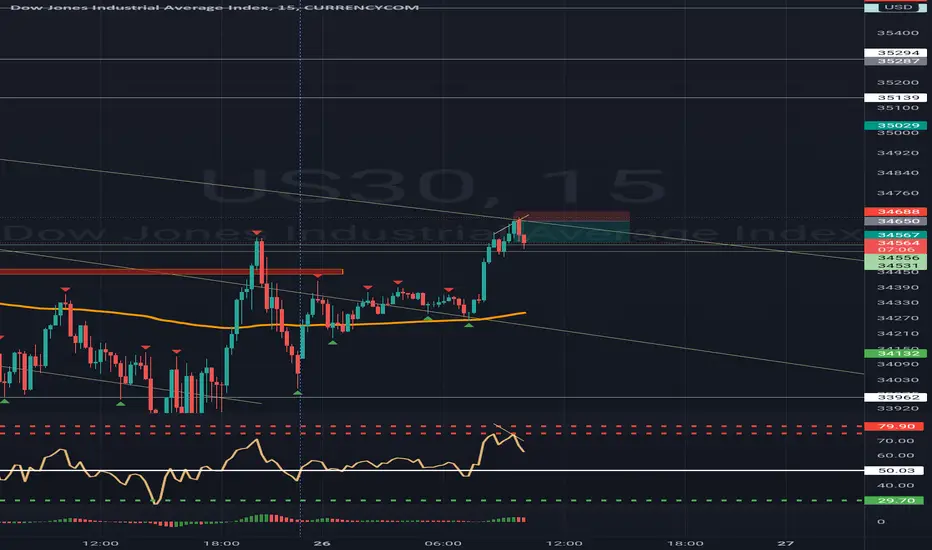
I grab liquidities for a living lolololDivergence is no joke at all...I spotted divergence in M5 and I had sell positions stacked just above the 34600 level and I saw telegram message from a group that called buys, they went all in, I mean like all in and once there was enough volume in the market, price started selling and voila, it hit my target however little it was and for that group, I believe it hit their stop losses 🛑 and that was that !.
Learn to trade divergences, learn to spot it at overbought and oversold levels in any of your technical indicators, it will be very helpful when making trading decisions !.
Confluencetrading
Just my perspective on NASDAQThis is just my perspective on how NASDAQ will move in the coming days. This is purely based on the area of the confluence trap, Demand, and supply.

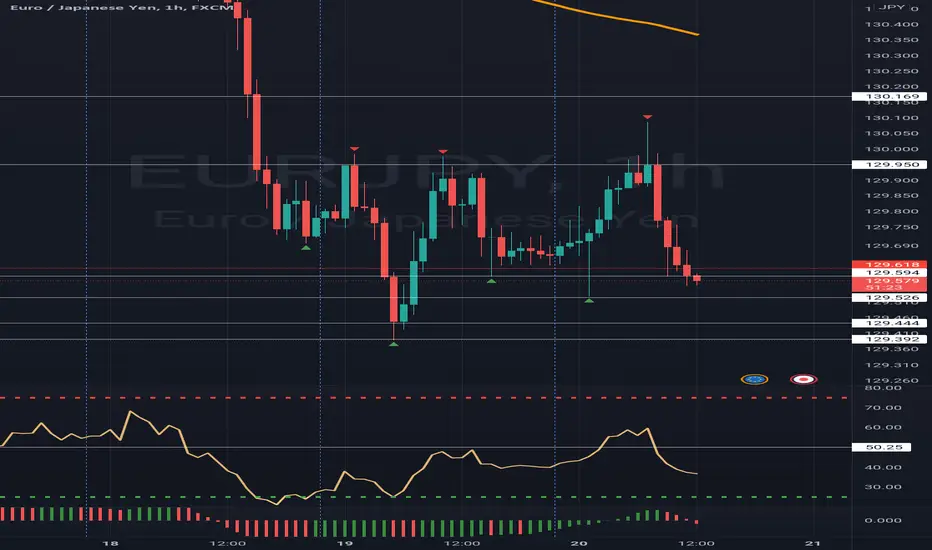
Wait till it hits the strongest supportEURJPY is already oversold in M15 but that alone is not the only reason for this trade, there are 2 support levels below...one is a psychological level @129.393 and the other which is @129.444 is not too strong of a support but it might hold during NYSEsession but we shall definitely find out in a few minutes !.
I have buy limits set already, you can hop on after making your own analysis.
Why confluence works?Why candles wick the way it wicks?
why 95% of the market fails to make money trading crypto?
what I'm about to show you is really top secret analysis only top 5% or less knows.
That my friend is confluence, why do you think 16th jan made a wick at 43.7k ? you might say its market being volatile but it was very clear on 14th jan we had naked POC at that level, it was very juicy as we saw 4hr nPOC at that same level.
I get it this might not work 100% of the time but this confluence trading makes me think almost all indicators are lagging, only levels matter.
Check out exo charts for getting nPOC and other stuffs. You have to put in the hard work to find these levels.

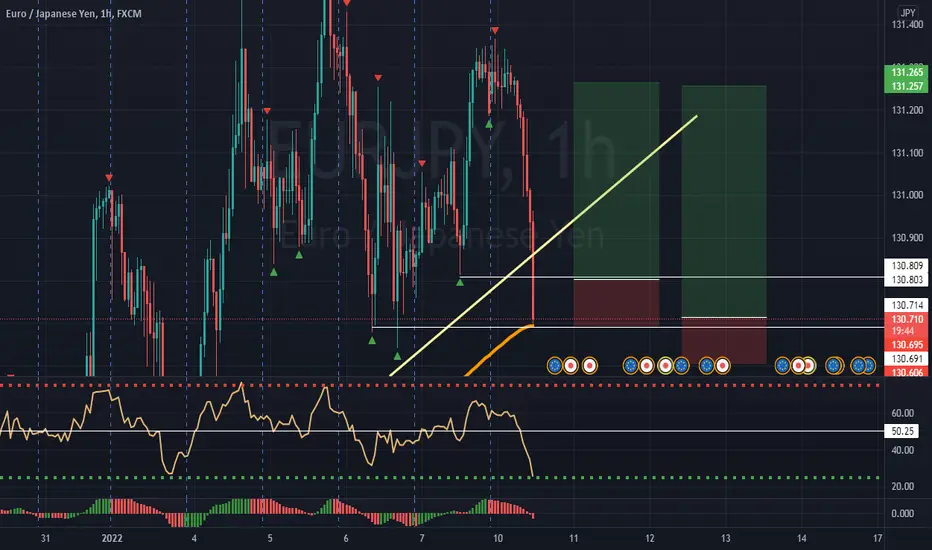
My new favorite pair !.All EURJPY asks of you is that you be patient with its price because once it hits major supply and demand zones or as you know them, support and resistance but in this case, we are dealing with support !.
Hop on this sweet 50 pips buy trade with me, i have been monitoring it since yesterday and it just hit my zone, i have been scalping 10-20 pips off of it because it hasn't started its major buy move yet but since it's already in it's zone, you can start buying to 131.30 or thereabout.
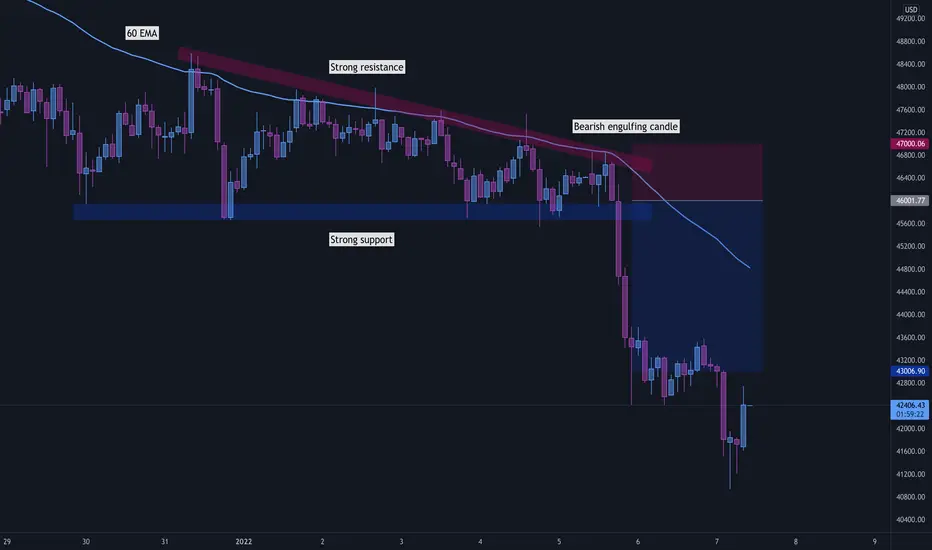
Power of multiple confluences in tradingThe rule is pretty simple: if you have many technical confluences backing your setup, the probability of your trade succeeding is really high. On the illustrated BTC chart, a number of confluences is listed. To be precise, there are 4 confluences examined, and they will be all scrutinized below:
1) The current direction of the market is bearish, meaning we are in a downtrend. As a rule of thumb, in a bearish market we look for SELL positions rather than going long (fading the short-term trade against the long-term trend).
2) A nice descending triangle pattern has been formed, indicating that a bearish breakout is highly possible, and that the price may keep dropping deeper down.
3) 60 EMA perfectly lines up with the upper boundary of the descending triangle, which is a crucial zone of resistance that the price can’t seem to penetrate.
4) A nice bearish engulfing candlestick pattern was formed before the massive drop happened, which serves as another indicator of bearish pressure.
After having all confluences ready in hand, it is time to execute. The Stop Loss is place a few pips above the zone of resistance, and the Target Profit is set at 3% gains, as the risk-to-reward based method is utilised.
NOTE: Even though having multiple confluences backs up your technical setup, gives you confidence, and provides your graphical setup with a higher chance of succeeding, risk-to-reward principles should be strictly followed in all cases! We cannot control the market, but we can control our capital, risk, and emotions.
Have a great upcoming weekend, everyone!
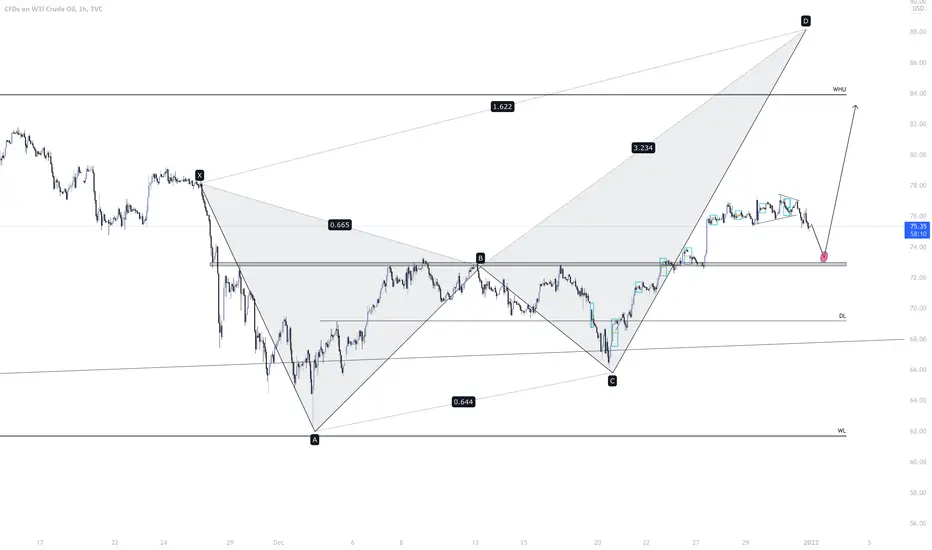
Potential Crab Forming 🦀 (Short then Long) USOIL - Daily Crab is still valid price is moving nicely up towards the D point.
However we had a big bullish push on the 27th that sent price into a consolidation leaving a large imbalance before price started to break to the downside again.
We have confirmation for shorts using the LTF BOS etc, once the markets open, I'll wait for price to settle and then I want to see price fill this imbalance and trade from the OB, S/D zone up to towards the weekly highs!
Such a beautiful zone of confluence! A++ trade if price gets there!
Let me know your thoughts!
** Disclaimer ***
These ideas I never trade until the end target with my initial lots, I focused on high probable entries with higher lots and use a specific partial taking strategy giving me a very high win rate and take most of my profits very early, I only leave a small % of my capital to run the entire trade. On the flip side im constantly monitoring LTF momentum and will close early if things change, these analysis's are for research purposes only.
SMDR, 4H, Confluence TradingIf SMDR rebounds around the 0.618 level, it will both be a golden ratio rebound as well as a strong support rebound, which makes it a good confluence trade.

SHORT ON UKOILWe take a look at UKOIL because we have interesting price action unfolding. Check out the breakdown and leave a comment if you feel the content is of value to you. Will update as time goes on, stay tuned!
Good Luck.
God Bless!

Here's my Shorting idea for The Loonie.Price is approaching resistance which also acted as shoulders in the head & shoulders pattern seen in our daily chart. Also, we have our upper trendline around this zone which we expect price should coincide with as it throws back into the zone. Another sell confluence is the blue trendline currently being retested.
If you like this idea, please, don't forget to follow for more analysis updates.

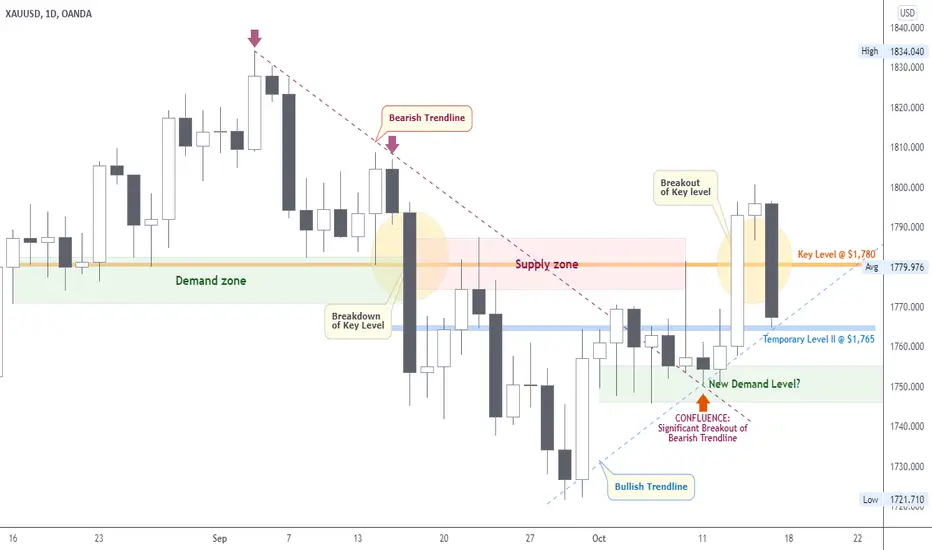
XAUUSD | Perspective for the new week | Follow-up detailsOver 5,000pips in our direction since my last publication on the yellow metal ( see link below for reference purposes) and it appears we are at another juncture to take advantage of the rally. The continuation sequence of this bias can be related to the significant Breakout of the Bearish Trendline during the course of last week trading session after a two week old of indecision (consolidation phase) around the identified New demand level around $1,750 zone (a psychological level).
Tendency: Uptrend (Bullish)
Structure: Supply & Demand | Trendline | Reversal pattern (Breakout)
Observation: i. Price traded below the Bearish Trendline in the last 30 days (3rd of Sep - 5th of Oct 2021) before getting caught up in a dilemma of Bearish continuation in recent weeks.
ii. Since the beginning of the new month (1st - 11th Oct 2021); we witnessed a consolidation phase within $1,770 & $1,745 hereby emphasizing the indecision in the market as participants looked forward to economic release for greenlight.
iii. It is obvious that after finding a bottom at a Major Demand zone @ $1,720 - a level that has a strong memory for buying power since mid last year (2020 - check weekly chart), price continued to find higher highs which culminated in a significant Breakout of Bearish Trendline on the 12/13th Oct 2021.
iv. The reaction to Consumer Price Index release was a positive signal for buyers of Gold as the actual figure equals expectations.
v. The new Trendline (Bullish) drawn under pivot lows reveals a change in direction of price in the last 15days as the clamour for a Bullish bias takes shape.
vi. Even as we await a confirmation at this juncture, the early hours/days of the new week might see a plunge into the new demand level indicated on the chart and if, on the contrary, I shall be looking forward to taking advantage of the new rally above the temporary level @ $1,765.
vii. An opportunity to add to our existing position should present itself at a Breakout/Retest of Key level @ $1,780... Trade consciously!😊
Trading plan: BUY confirmation with a minimum potential profit of 5,000 pips.
Risk/Reward : 1:5
Potential Duration: 10 to 15days
NB: This speculation might be considered to make individual decisions on the lower timeframe.
Watch this space for updates as price action is been monitored.
Risk Disclaimer:
Margin trading in the foreign exchange market (including commodity trading, CFDs, stocks etc.) has a high risk and is not suitable for all investors. The content of this speculation (including all data) is organized and published by me for the sole purpose of education and assistance in making independent investment decisions. All information herein is for your reference only and I take no responsibility.
You are hereby advised to carefully consider your investment experience, financial situation, investment objective, risk tolerance level, and consult your independent financial adviser as to the suitability of your situation prior to making any investment.
I do not guarantee its accuracy and is not liable for any loss or damage which may result directly or indirectly from such content or the receipt of any instruction or notification therewith.
Past performance is not necessarily indicative of future results.
LSS/USDT (Kucoin) Rebuy Opportunity with confluenceLossless made a massive pump in the last few days and correcting since reaching $0.67. Perfect time re-enter and it is preparing for the next wave.
Found support at 0.618 Fib, Found support at 21MA and forming a Pin bar what else we need?
This is not financial advise please DYOR. Next support at $0.357

Confluence Trading CAKEUSDT
The high-quality confluence trade of CAKEDUSDT is about to present itself.
Following TA tools confluence in the region where we are now:
1. Support zone (grey rectangle box)
2. Fibonacci retracement levels of 50%
3. EMA 200 Daily
Each confluence factor increases the quality of the trade since each one of them attracts different schools of traders. Therefore also the probability of a winning trade increases. (still a probability, there is no certainty)
Good luck!
OZ

JICPT| BTC rebound from key fib levelHello everyone. Bitcoin dived on Tuesday on the news of rocky rollout of the El Salvador experiment. A flash crash of 17% just in a day. I thought the chart got some issues after having a bottle of water. It's pretty scary. That magnitude price movement would trigger a lot of margin calls. So, be careful, you're trading with leverage.
On the daily chart, we can clearly see that price rebounded from the 61.8% fibonacci retracement , coincidentally, level happens to be the place where my mid and long term MA sat.
Technically, if the daily closing price of today is higher than yesterday. The likelihood of going up is very high .
Also, after the big downside move, sellers need to take some rest .
I've marked 3 targets on the chart for reference. Give me a like if you're with me.

Confluence TradingConfluence long trade:
High quality trade of EGLDUSDT in about to occur in an area of confluence between 150-155$ price level.
Following TA tools confluence in that specific price range for the daily TF:
1. Support zone (grey rectangle box)
2. Fibonacci retracement levels of 50 and 61.8
3. Trend line of the main bullish trend (in yellow)
4. 21 EMA in daily TF.
Each confluence factor increases the quality of the trade since each one of them attracts different schools of traders. Therefore also probability of a wining trade increases. (still probability, there is no certainty)
good luck!
OZ

EURJPY multi time frame analysis shows it is necessary to shortOn my previous post on the 1 hour I showed a triangle which should've broke to the downside, once I see that happen I will enter a short position which i will manage on the daily time frame. Both of these posts demonstrate the need to short the market rather than go long. In summary I will use the hopeful break of the triangle on the 60 minute to confirm an entry into the trade on the Daily. Good luck!
If you found these helpful please like this post as i will be able to see if you guys found my first couple posts useful, Thank you!

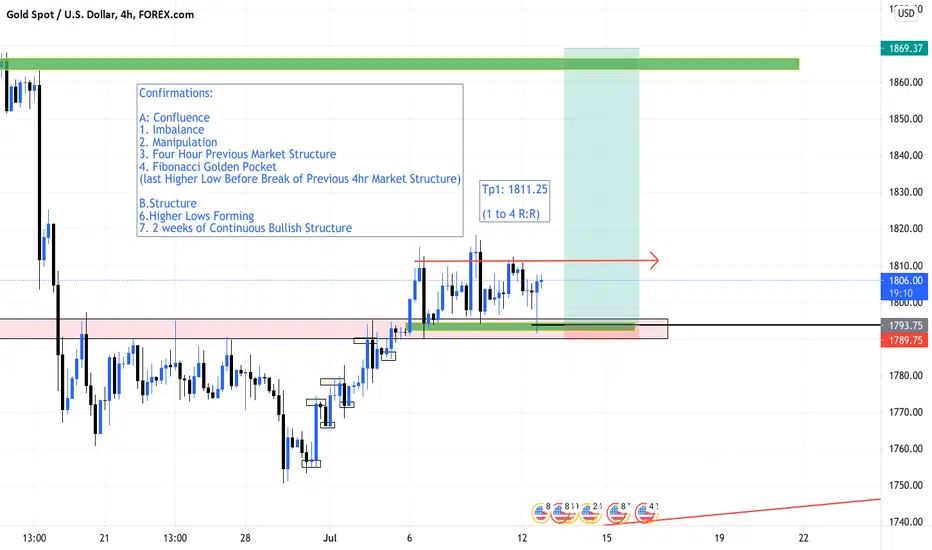
Xauusd Long Confirmations:
Entry point Here because...
A: Confluence
1. Imbalance
2. Manipulation
3. Four Hour Previous Market Structure
4. Fibonacci Golden Pocket
(last Higher Low Before Break of Previous 4hr Market Structure)
B.Structure
5.Higher Lows Forming
6. 2 weeks of Continuous Bullish Structure
1 to 4 risk to Reward tp 1
its all about The Risk to Reward If this trade clears at 1% risk, you'll make 4% Profit , Once Trade Goes to 1;1 Risk Stop loss at Break Even you can even decide to take Partials and let the rest Ride
1 to 18 Overall Tp
What does that mean?
If you Risk...
$10
You Can make up to
$180
No reason to Gamble
1% can make you 18%
2% can make you 36%
3% can make you 54%
All on a single Trade Besides cryptocurrency youll never see a return that Great With investing
Cfds / Margin Trading is the way to go
If you dont have a trade plan Dont trade!!!
Always know your potential Risk and How much You want to make Minimum For every trade Before you get in and Do Not Over leverage risk 1-3% Max per Trade
This is what Separates The investor from the Gambler Simple but not easy
EURUSD | Perspective for the new week | Follow-up detailsWe witnessed a total of 500pips in our direction since my last publication on this pair (see link below for reference purposes) and it appears the Bears have lost the momentum giving way for a potential rally in the coming week(s). The Euro fell significantly during the course of the last one month to break below Key level @ $1.18500 level, only to turn around with signs of life again during the latter part of last week trading session to break and close above the same Key level. With the recent structure favouring the Euro; participants (buyers) look forward to the coming week(s) with optimism after the ECB decided to let inflation slightly overshoot its 2% target to avoid the risk of premature tightening.
Tendency: Uptrend (Bullish)
Structure: Breakout | Supply & Demand | Reversal pattern (Re-test/Rejection)
Observation: i. The Bearish momentum that began in January 2021 broke out of her prevailing direction (Bearish Trendline) on the 22nd of April 2021 to set the pace for what look likes a Trend continuation.
ii. The first major level to hold price "supported" this year (2021) is identified at $1.17000 (31st of March 2021) which is represented on the chart as the Demand zone.
iii. I have hereby tagged this Demand zone a strong level for buyers considering the emphatic run (leading to a Breakout of the Bearish Trendline) that peaked at $1.22650 (over 500pips move).
iv. The Bearish momentum that began on the 26th of May appears to stall @ $1.17850 which also fulfils a re-test pattern of the Trendline Breakout as we witness the buyers picking up momentum from the Demand zone mentioned earlier.
v. In this regard, a confluence is identified at $1.1800 - a point where the Trendline and Demand zone meets to favour a "possible" rally.
vi. We saw the price break and close above $1.1800 (Key level) on the last day of last week trading to reveal a buying momentum at this juncture.
vii. The price MUST remain above the key level to support a Bullish bias in the coming week(s)... Trade consciously!😊
Trading plan: BUY confirmation with a minimum potential profit of 300 pips.
Risk/Reward : 1:6
Potential Duration: 5 to 12days
NB: This speculation might be considered to make individual decisions on the lower timeframe.
Watch this space for updates as price action is been monitored.
Risk Disclaimer:
Margin trading in the foreign exchange market (including commodity trading, CFDs, stocks etc.) has a high risk and is not suitable for all investors. The content of this speculation (including all data) is organized and published by me for the sole purpose of education and assistance in making independent investment decisions. All information herein is for your reference only and I take no responsibility.
You are hereby advised to carefully consider your investment experience, financial situation, investment objective, risk tolerance level, and consult your independent financial adviser as to the suitability of your situation prior to making any investment.
I do not guarantee its accuracy and is not liable for any loss or damage which may result directly or indirectly from such content or the receipt of any instruction or notification therewith.
Past performance is not necessarily indicative of future results.

Inverse head and shoulders pattern !.TP 150 pips/ticks only
SL 50 pips/ticks only
Take this trade on your demo account, then come let me know in the comment section below if price followed through with the H&S chart pattern !.
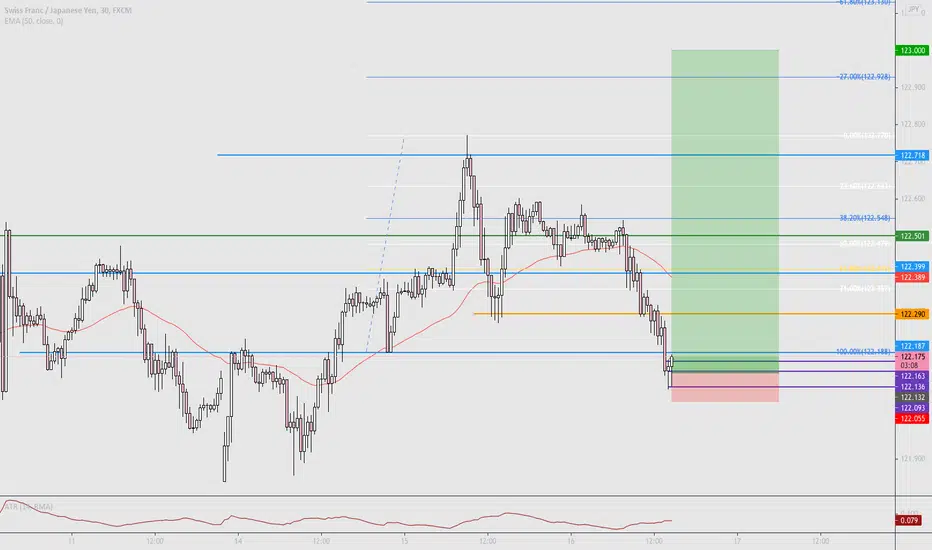
CHFJPY long trade idea going long on chfjpy one less confluence factor as H4 candle closure was very bullish but the market structure is maintaining (for now) on the 30m chart as we just retraced 100%, potential risk to reward 1:11
EURCHF Short opportunityStrong Bearish weekly closure.
Daily chart is in an uptrend but retracing, could potentially retrace to previous daily resistance
H4 - chart in a downtrend.
30m Chart - 100% retracement of previous move to the previous level of resistance presenting a shorting opportunity.

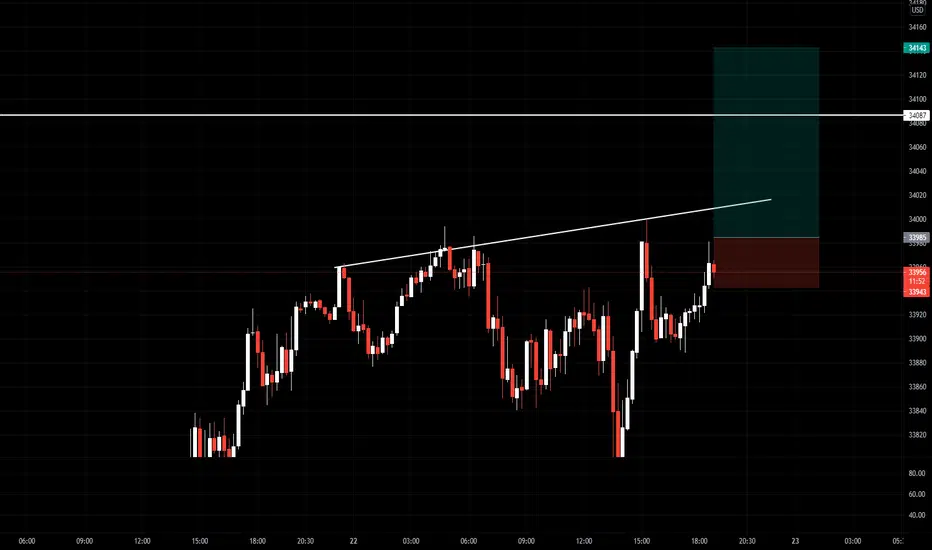
EASY 2800+ PIPS BAGGED !.After giving out this signal, i expected price to break below 33000 but it simply couldn't, rather it bounced off a fib zone and retraced back to the upside.
After the currenct consolidation is complete, i wil send out a signal for the next possible move BTC's gonna take.

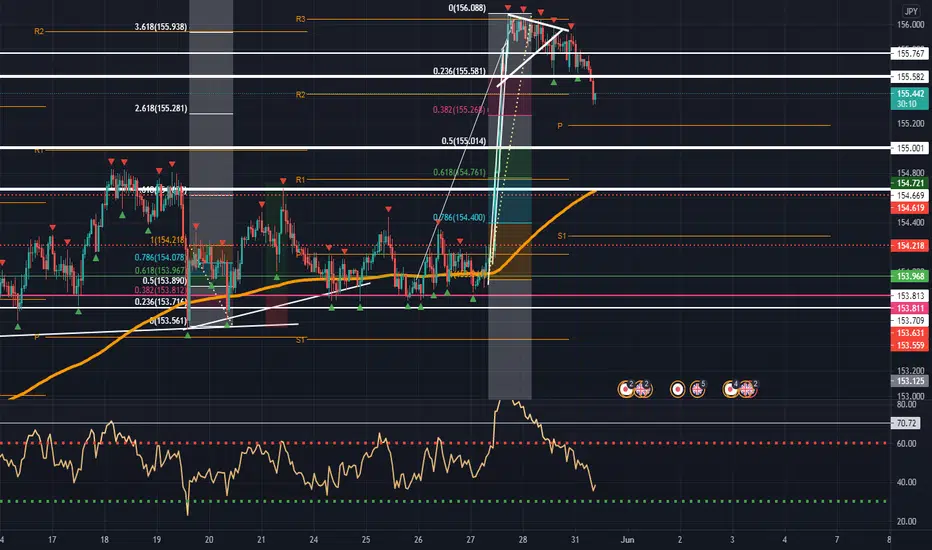
+55 pips and counting ! GBPJPYCheck my previous signal post below , go through it and make sure you understand the reason behind my Short long (long sell) idea.
Insert the Bollinger Band indicator into your chart and in H1, you'll notice that just as the bands contracted around 153.950-154.120-ish, it started expanding when price started impulsively bullishing to 156+.
You'll also notice in H1 that the bands started contracting around the high price went to and just started expanding and price is already in a downtrend which means history is definetly going to repeat itself.
With all that said, i believe GBPJPY still has a lot of room to fall, more like a 100+ pips range to bearish.
#forex #forextrading #forexmarket #forex #freebies #forexsignals #instagram #facebook #Divergence
If you like this post please, cheer us on, leave a like, share, follow and most of all, engage with the post by sharing your thoughts in the comment section.