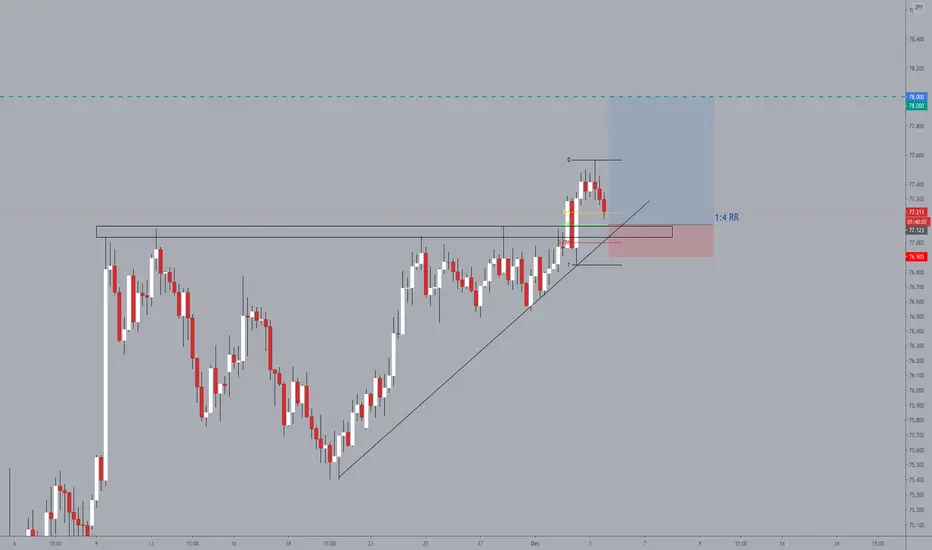
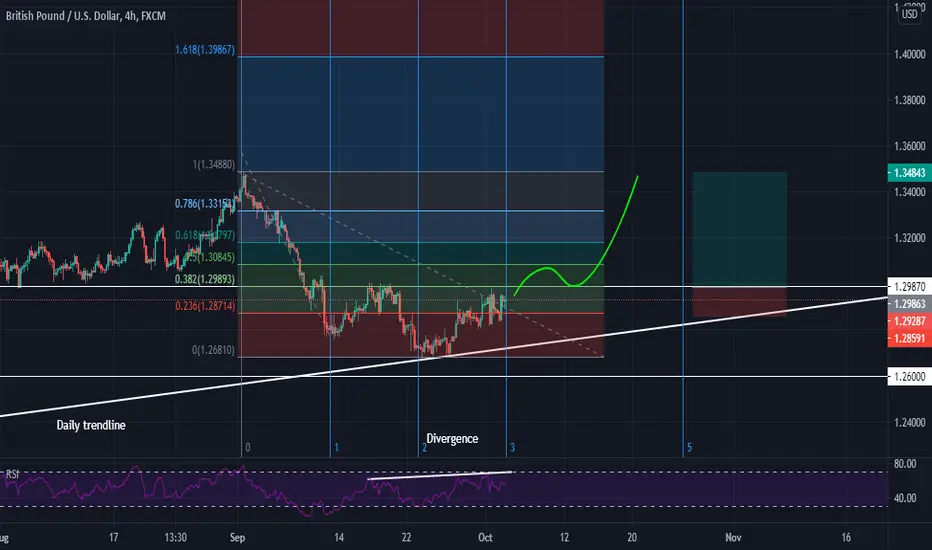
Long on Pullback | Trend Continuation | Swing SetupLooking for a pullback to retest previously broken resistance area (which is now the key support) in confluence to our 0.618 fib retracement and ascending trendline. Expecting trend continuation until 78.000 psychological resistance where we should be able to take profit.
If TL breaks below will look for short opportunities.
Confluencetrading
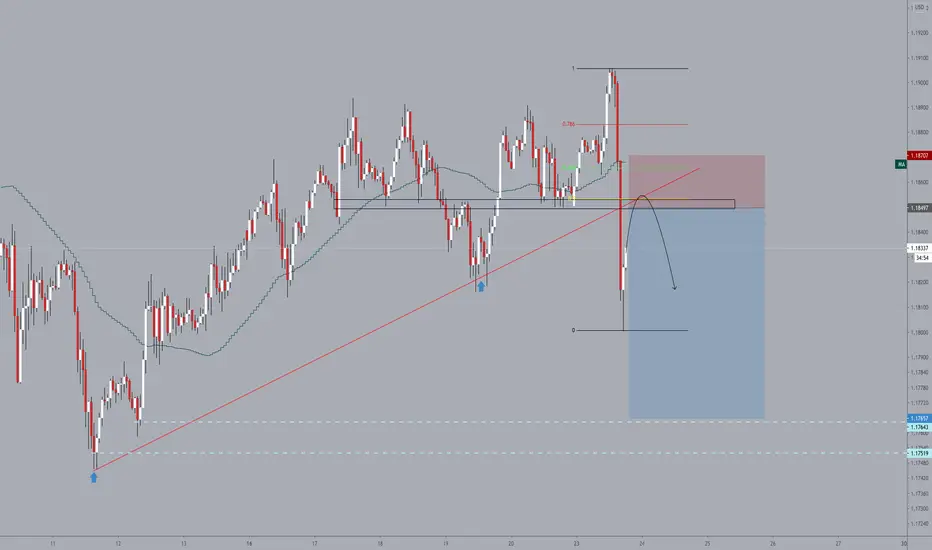
Short on Pullback-Respectable descending TL, retest expected
-0.618 fib retracement
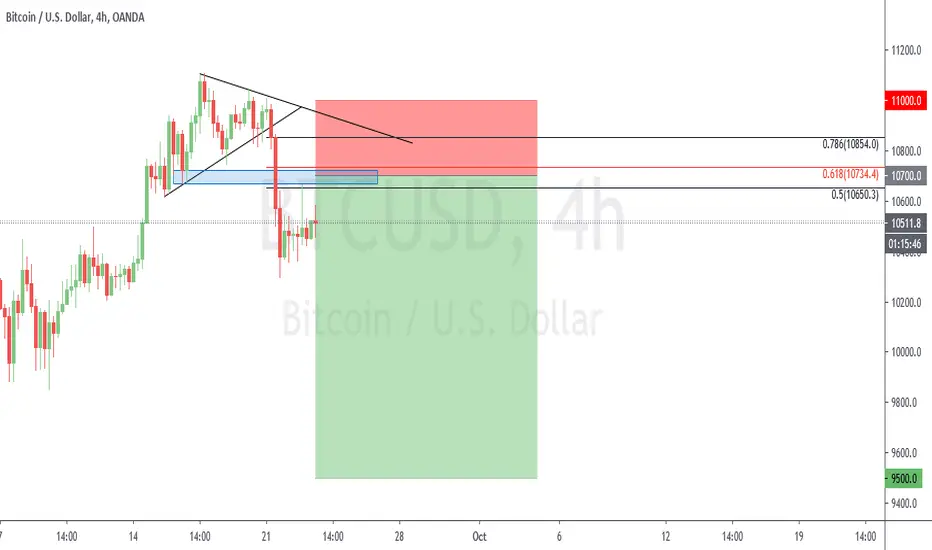
-Previous support now resistance
-MA50 momentum shift

Simple Trend Trading Strategy! Trade the intraday trends with ease! Stack the confluences to a high probability trade and execute!
Pull back to between Fib zone 0.382 - 0.618, small counter trend line within overall trend, entry on a momentum breakout candle.
Bobs your uncle!!

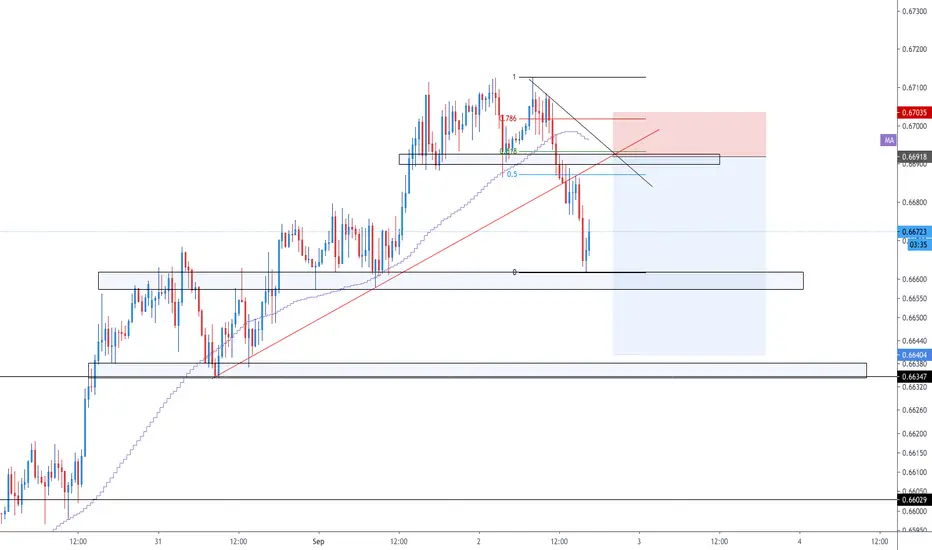
Short on Pullback | Strong Zone of ConfluenceFollowing the recent impulsive breakout of the ascending TL... we will be looking to enter shorts on a pullback to retest it in confluence to the 0.5 fib retracement, previous area of support (which is now key resistance), and the MA50 which has shifted its momentum to the bears.
EURJPY AnalysisHeya! all here is my bias for EJ, as I shared before (already link the my idea down there) now I'm looking for longs.

XAUUSD Short: 4HR Analysis I typically trade Gold on 1HR & below but this 4HR set up caught my eye
Confluences:
- Rising Wedge
- Clear Downtrend
- At an area of resistance
- Trend Meets Resistance
Ways to Enter:
Conservative: Wait for price to close below that last area of support (1901.251) then enter.
Aggressive: Have a sell limit at resistance area or sell once price reaches resistance area.
LIKE, COMMENT, and FOLLOW
*tell me what you think of the idea and tell me if you took it :)*
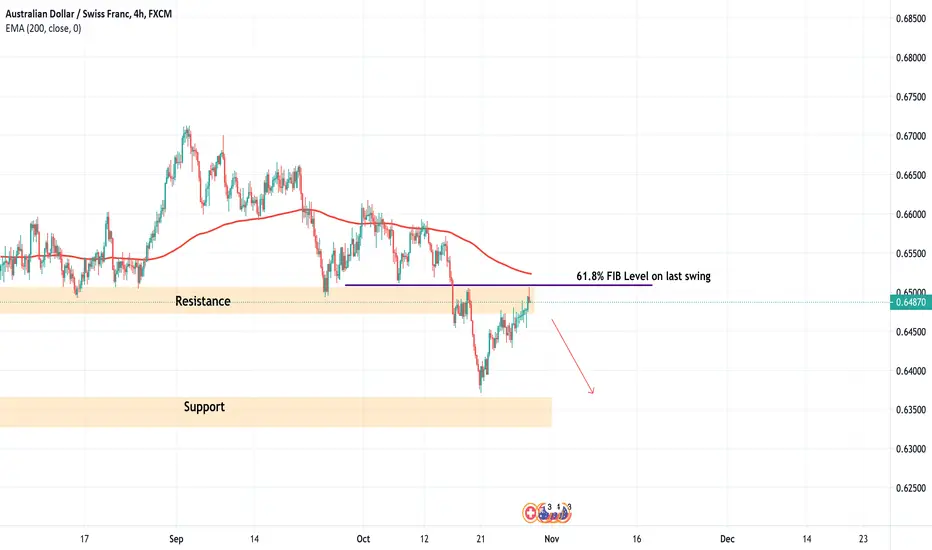
AUD/CHF Expecting the price move down to supportYo traders,
Simple trade idea.
Have marked the support and resistance on the daily TF. The price bounced of the support and is moving correctively towards the resistance.
On checking the FIB level on the last swing the price is now touching the 61.8% Fib level which is in confluence with the resistance.
Looking to go short on 4H tF based on price action
Please like support and comment your thoughts.
Thanks
Madtradex
USDCAD Buy and Sell set upHello everyone
Here's the latest USDCAD analysis.As you can see, this is just price action analysis and you should be patient till get right candle stick confirmation.
good luck

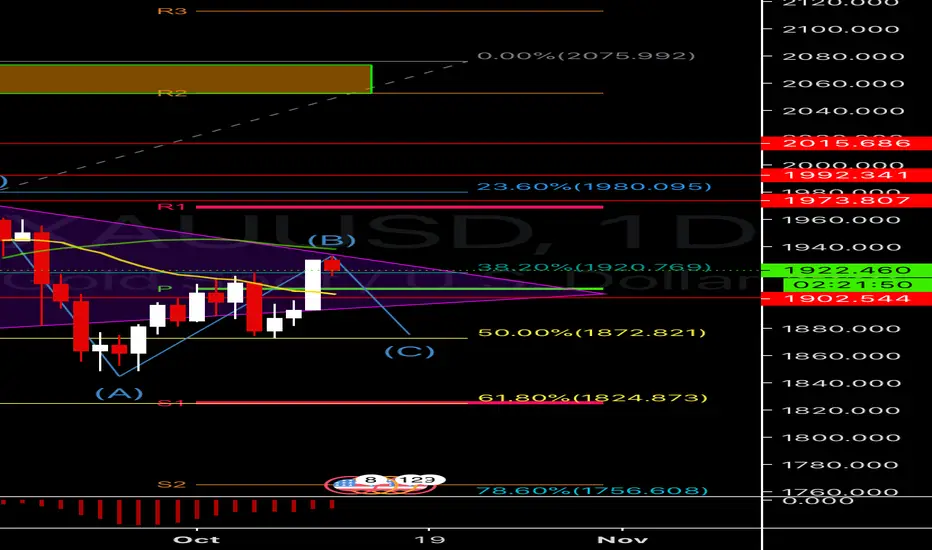
Gold UpdateNot much has changed, keep up with Fibonacci golden retracement zone 50% & 61%. Fundamentals playing a big part here. Anyone that rode (A) Leg on the wave did the right thing, over 500 pips there. We are reaching a strong resistance now with signs of rejection. I’ll be looking forward to another discount on gold near the golden zone again ( or lower if possible during election time in the US).
Trade responsibly.
ZECUSD Fibonacci Level 0.382 Price Level 70.36644460ZECUSD Fibonacci Level 0.382 Price Level 70.36644460

GBPUSD Buy set upHello everyone
Here's the latest GBPUSD analysis.As you can see, this is just price action analysis and you should be patient till get right candle stick confirmation.
good luck
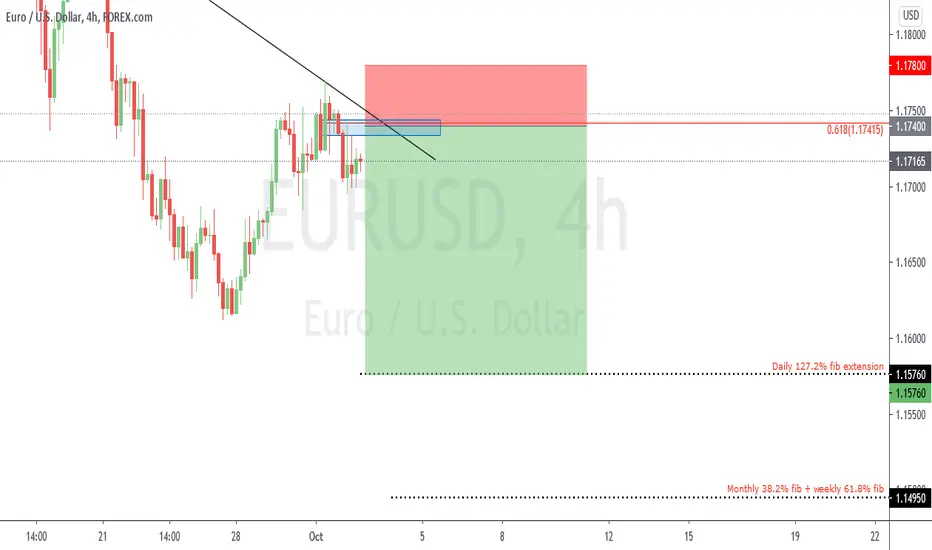
EURUSD Sell set upHello everyone
Here's the latest EURUSD analysis.As you can see, this is just price action analysis and you should be patient till get right candle stick confirmation.
good luck
USDCAD Buy and Sell set upHello everyone
Here's the latest USDCAD analysis.As you can see, this is just price action analysis and you should be patient till get right candle stick confirmation.
good luck

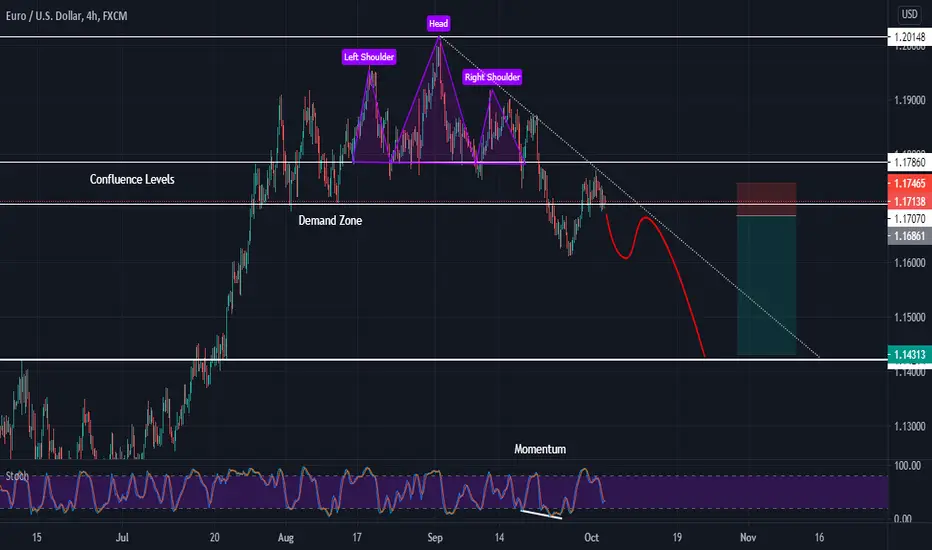
EURUSD Swing ShortAfter a break below support on the daily TF, this pair has now approached this level for a test. I expect this pair to reject the level as resistance before continuation to the downside and creation a lower low on the daily TF. On the 4hr TF, the pair is forming a head and shoulder at the area where daily resistance is expected. This chart pattern presents a good entry opportunity at confluence area with target taken from daily TF.
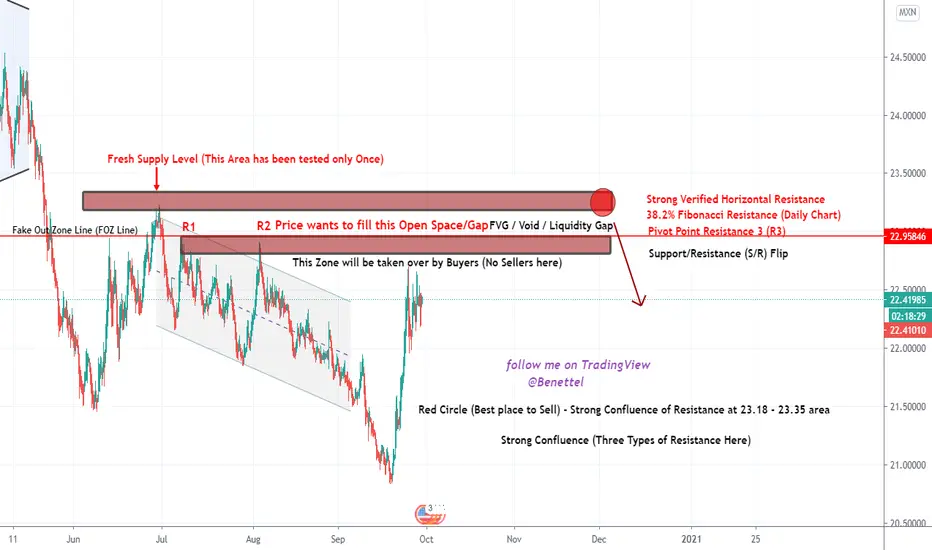
USD/MXN Quick Analysis (Using Supply and Demand Method)The Price is now moving up to the Supply Level as you can see in the Chart. The Market has created two Equal Highs, R1 and R2. These two Equal Highs form a Fake Resistance Level also called the Fake Out Zone line (FOZ Line).
The Banks and the Big Institutions are preparing to clear the highs and the stop loss of retail traders who are in sells. A lot of traders have already joined the Buy movement.
We can see the Price Compressing up to the Supply Zone. All Supply and Demand Traders know that every gap or void must be filled.
We have a very Strong Confluence of Resistance in the 23.10 - 23.35 area. This Area has been tested only once, so we have a Fresh Supply level in this area which means a lot of Unfilled Sell Orders are still here.
This is the Real Resistance. Our Sell Area is the Red Circle in the Chart. So we will set our Pending Order and wait for price to get there..🙏🙏
Strong Confluence of Resistance (Three Types of Resistance):
Strong Verified Horizontal Resistance at 23.18 - 23.33
Pivot Point Resistance 3 (R3) at 22.97
38.2% Fibonacci Resistance Level (Daily Chart) at 23.00
BTCUSD Swing ShortAfter a break-out from 4hr rising wedge, I expect a test of structure then further continuation to the downside for the creation of a lower low on the daily chart. Entry order is set inside confluence zone with Fibonacci and market structure confluences, target is set a few pips above 127.2% fib extension of daily retracement. In case of slippage, I expect the confluences of the 78.6% fib level and descending trend line to protect S/L price.
Short on RetracementLooking to sell on the back of the broken ascending TL in confluence to our 0.618 fib retracement, previous area of S&R, respectable descending TL, and MA50 which is supporting nicely the bearish momentum.
Trade will not be valid if we close ABOVE the 0.618 fib level

CADJPY ShortAfter breaking below 4hr structure, I expect pair to re-test structure; and then I expect the pair to reject the resistance area (with Fibonacci, trend line and market structure confluences) before continuation lower to form of a daily lower low.

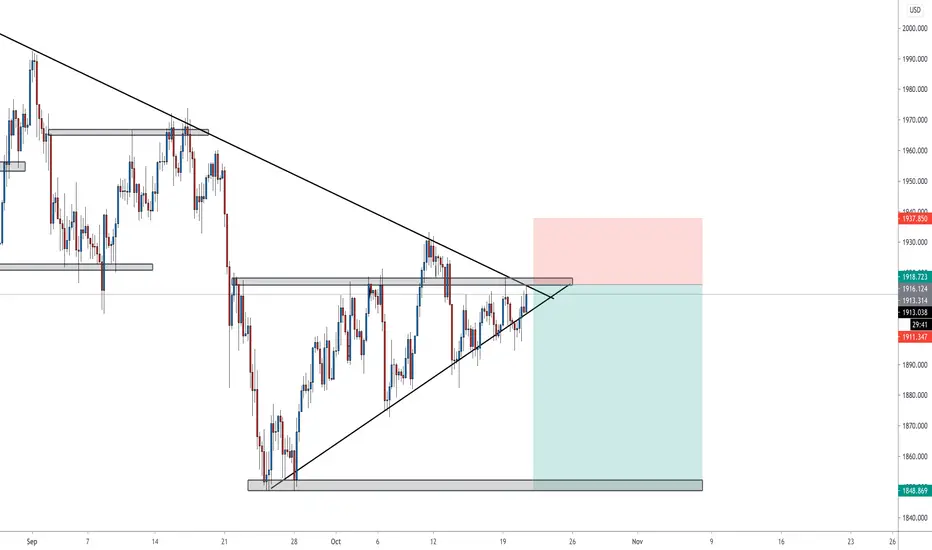
GOLD Clean ViewGold looks still very weak to break 1912 key level, it has to find the right liquidity needed to break thru that level. Mulitiple wicks on 1912. Trendline has been touched one more time and probablly will hold. On daily TF, not a single body candle has engulfed previous wicks. Personally expecting gold to push up through at least two previous Lower Highs and prolly form a double top before finding the right momentum to break 1912 key level and the significant trendline to look for Higher Lows to be formed on larger Time Frames.

Pullback Setup | Strong Zone of Confluence-Ascending TL breakout, retest approaching
-Respectable descending TL
-0.5-0.618 fib retracement area
-MA50 supporting momentum shift

Pullback Short Setup-Broken ascending TL, retest expected
-0.618 fib retracement
-Previous area of S&R