Potential H&S SetupAUDUSD approaching to retest the broken ascending trendline in confluence with our 0.618 fib retracement and previous resistance. Overall, structure could be forming a H&S on 4H time-frame - which can provide a reasonably good short opportunity.
Confluencetrading

XAUUSD Testing 1902 can we break it?If you checked my previous ideas I have been following this closely and was breakthrough 1889-1890 resistance. Now 1902 is the next target inbound to 1918 zone. Make sure to switch between all time frames for more stronger zones, 1H-4H and Daily, Overall Gold is Bullish.
If the Fundamentals allow it, there wont be any retracement unless the good news: Covid-19 cases decreasing or vaccine, Dollar gains strength. That will cause a bearish breakout and we can test strong support 1883 again or further down.
There will be important fundamentals next week so monitor that closely for an opportunity to catch a decent retracement Opportunity
Meanwhile 1890 has shown decent support the confluence zones with: Fib,support and resistance, candlesticks.
Lets see where gold takes us this next week, 1920 is definitely soon. If there is a retracement or any more bad news as the Feds worldwide continue to Print Money this will continue to boost a bullish move.
The headlines concerning China and USA are important to follow

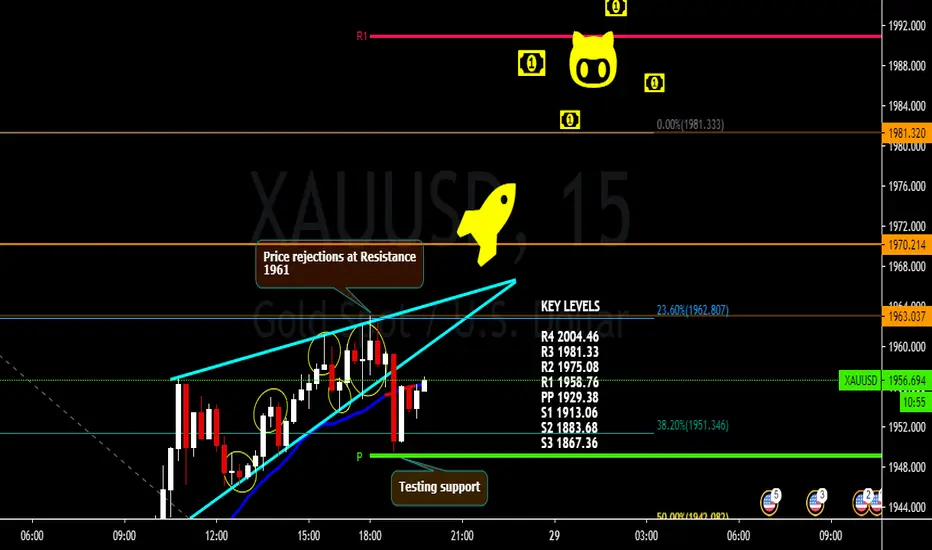
Gold hunted Bears and Bull along the way. Are we there yet? As I mentioned, a stop hunt and classic pullback scenario occurred. Now we retraced to 38% on the Fibonacci and key levels were tested all the way from 1981 to 1900s. As it stands gold will continue to test resistance at 1941-61, before any further action can be taken. Always wait for confirmation my friends, do not allow FOMO (Fear of Missing Out) to blow your account.
Last correction we had was a long time ago, all indicators were overbought. Classic herd mentality was Buy!!!! this is why it is important to wait for conformation to avoid stop hunt. Be flexible with your market direction as it can change anytime (hedging for example, sell at price rejection with confirmation).
Now lets stick with the plan and trade play by play using confirmation as we cross the zones I noted in the chart.
A combination of Fundamentals/Market Sentiment/ Technical analysis is how I prefer to make my decisions.
There were several fundamentals at play during the pullback, make sure to keep up with them.
Leave a like and follow me as this is a big support and motivation to continue.
Good Luck this week and stay Golden!
Intra-day Long & Swing Short SetupIntra-day:
Looking for a pullback to retest the recently broken hourly trendline in confluence to our 0.618 fib retracement and a strong hourly support area.
Swing:
Assuming the intra-day setup plays out in accordance to the plan, a strong short setup is formed on the respectable descending trendline in confluence to the outer 0.618 fib retracement and previous S&R area.

Gold loves tragedy...are we going to see higher highs? OANDA:XAUUSD
If you haven’t read my previous ideas, please do so it will help understand where we are with gold. As tensions rises between USA and China, gold is getting the necessary bullish boost. I'd appreciate a like and follow as it motivates me to continue to post.
DXY is taking a dive as of now due to COVID-19 and current events as mentioned above. Fundamentals are driving this bullish move by the horns.
Confluence zones are confirming Key level zones as mentioned above. We are a long way from support, so stop hunts are possible.
I will wait for further confirmation before moving up , if you’re following me we have been in this journey since 1890s zone. Safe travels and plan accordingly with fundamentals/technical. My next TP is 1988, slight price rejection on 1981 so lets see where the next candle forms!

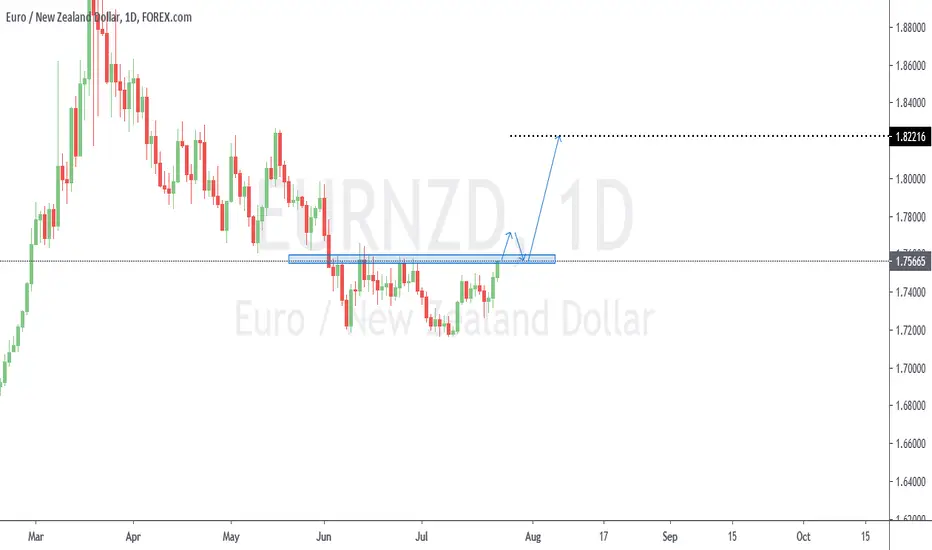
EURNZD SWING LONG - Capitalise on the strength of the EUROWith this pair currently at monthly support, there is a good opportunity to capitalize on the possibility of the pair rejecting this support. Also, the pair being at weekly support provides further confluence for the rejection of monthly support. If the market provides a daily close above daily resistance, then the re-test of that structure would present a good entry level for the swing
Trade with the Trend | Pullback SetupLooking for a pullback to create another LH on the lower ascending trendline of the parallel channel. Will be entering longs near the 0.618 fib retracement in confluence to a previous S&R area

Keeping it simple Head and shoulders pattern I believe this pattern will play out for the bears also head and shoulders pattern play really great in Risk reward as well as a high probable trade for binary options as well as spot trading opportunities: I also know there is a lot of confluence at the level of the left shoulder failing already as i type this. i will put my SL into TP . i have a bearish engulfing signal on the 15 min that you would see but on the hourly its a RED BE WHICH IS CANDLESTICK ANALYSIS ALSO PLAYING IN. Also the risk reward is about 4:1 which is something i really like. Were keeping it simple and we will see how this plays out in the hourly

BankNifty Solid Sell Activated! RedLine Broken Plus MoreOn 29th of June, i gave a trading idea which has been activated today! See Related Idea!
What's interesting is the confluence of Pitchfork Breakout and my redline? Isn't it?
Expect a large fall, whatsoever people tell you from here!!!
Trade at your own risk! For Educational Purposes Only!

Possible Retest & Long Position - GBPCHF - 7.68% R:R Hi All! Hope you're keeping well and having a great weekend! Just wanted to share a personal analysis I've made on GBPCHF! Please feel free to comment below any questions you may have!
With GBPCHF, I would personally like to see some movement to the downside towards the marked 4hr structure, to retest it as a support for price then to move back and follow the price trend to the upside. As you may not know, the Bank of England has a speech tomorrow which will greatly affect the pound - if the speech is 'hawkish' then we could see some strength for GBP which will support this long position.
You may notice that the fib retracement isn't on the highest wick, which is something I've personally done because I feel that maybe the last two candles on Friday could be very sketchy to work off, especially towards the market close. By doing this though it's lining up perfectly with the structure, and would be nice to get a long from that position. We're also above the 40EMA which I personally work with on minor pairs which will support this - also this could count towards a touch on the ascending trendline (subjective) which could also show support.
I have chosen to have my stoploss at 20pips + 3pips for spreads, and I will be risking 1% of my capital for this trade.
Confluences:
Trendline
Structure
40EMA
Fib Retracement
Conformation
"Pending" 😉
Obviously please do your own analysis, so please don't take this as gospel and please ensure that you use the correct risk management for this trade.
Let me know your guys thoughts!
Cheers
Daniel
Instagram: @DanielJamesFX
Twitter: @DanielJamesFX

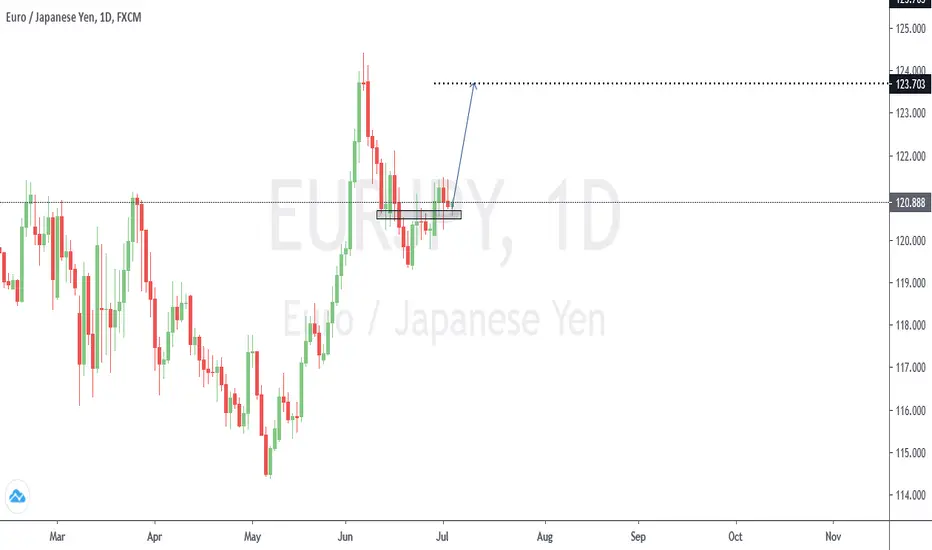
EURJPY Swing LongWith the possibility of creating, at least, an equal high on the weekly time frame, this pair presents a good swing trade opportunity. On the daily time frame, the pair is on a re-test of an important structure level. If the pair rejects this support level, then there is a high probability of the pair rallying from support. Additionally, an inverted H&S is forming on the 4hr time frame of this pair, which serves as good confluence for a long on pair.
A more ballsy target would be the 127.2% fib extension of the weekly retracement.
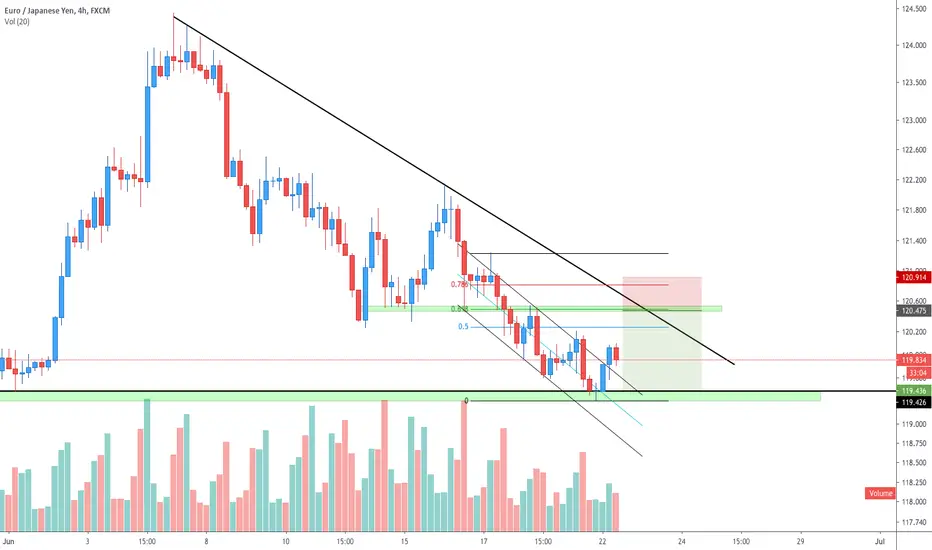
Trendline Breakout & Retest SetupEURJPY currently finds itself trending within an ascending parallel channel after successfully breaking out of the descending trendline. We will be looking to enter longs on a pullback towards the 0.618 fib retracement, in confluence to our outlined parallel channel and the previous level of support.
GBPUSD Long Trade IdeaGoing long @Institutional Level 1.24200
Trade bias is based on confluence trading
Trendline Break & Retest | SELL LIMITAUDCHF broke out of the ascending trendline on lower time frames and is currently trending within a parallel descending channel. Looking to open shorts on a pullback towards the 0.5 inner fib retracement zone - which outlines perfectly with our broken trendline.
If we fail to see a rejection/bounce from the LL of the descending trendline, cancel order.
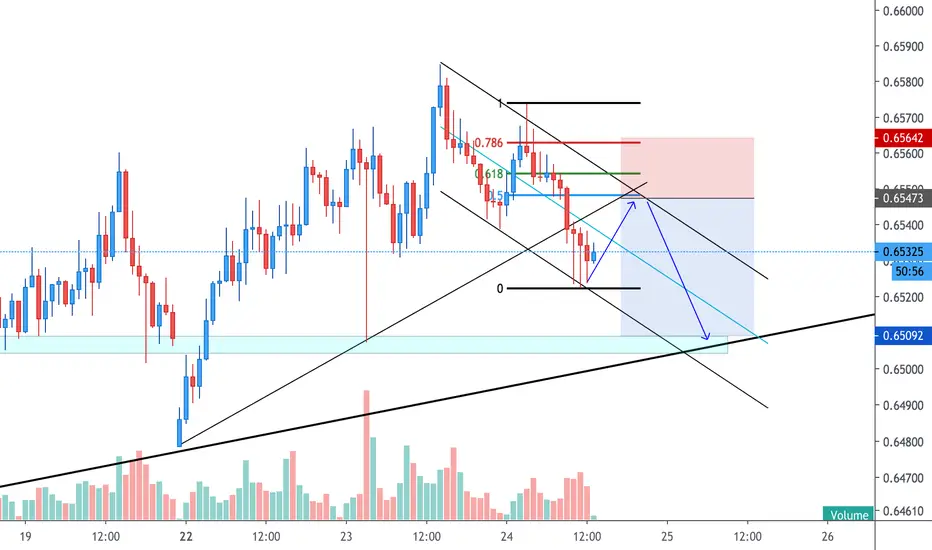
Selling on PullbackLooking to open short positions on a pullback towards the respectable descending trendline, 0.618 fib retracement level, and previous level of support which is now resistance.
Trendlines Retest | Short OpportunityCADJPY is rapidly making its way back up to retest the broken 4H ascending trendline, and potentially retest the current respectable descending trendline outlining perfectly with our 0.618 fib retracement level.

Trendline Retest | Short term setup -4H ascending trendline
-0.618 Fib retracement
-Previous resistance now acting as support
-strong zone of confluence
-Bullish sentiment on short term due to the huge oversell recently. Looking for a pullback to retest the current descending trendline

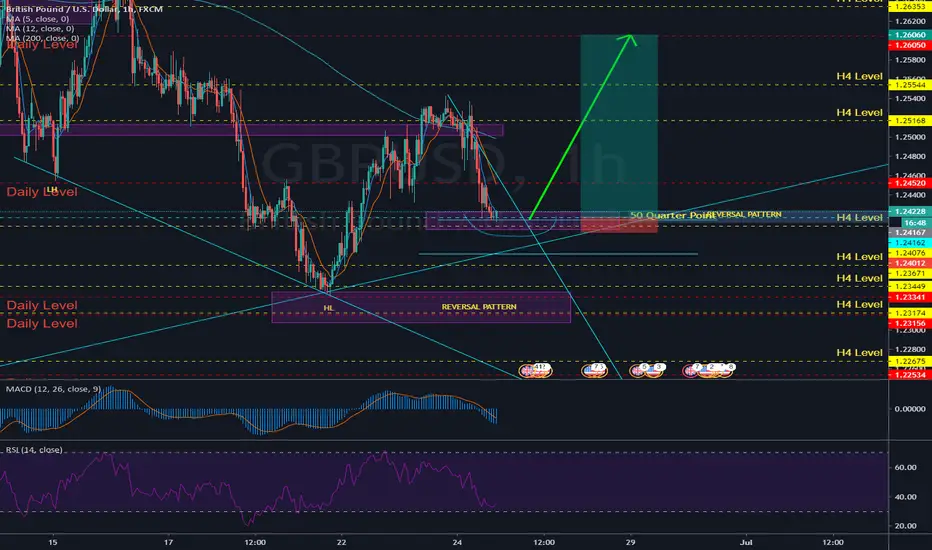
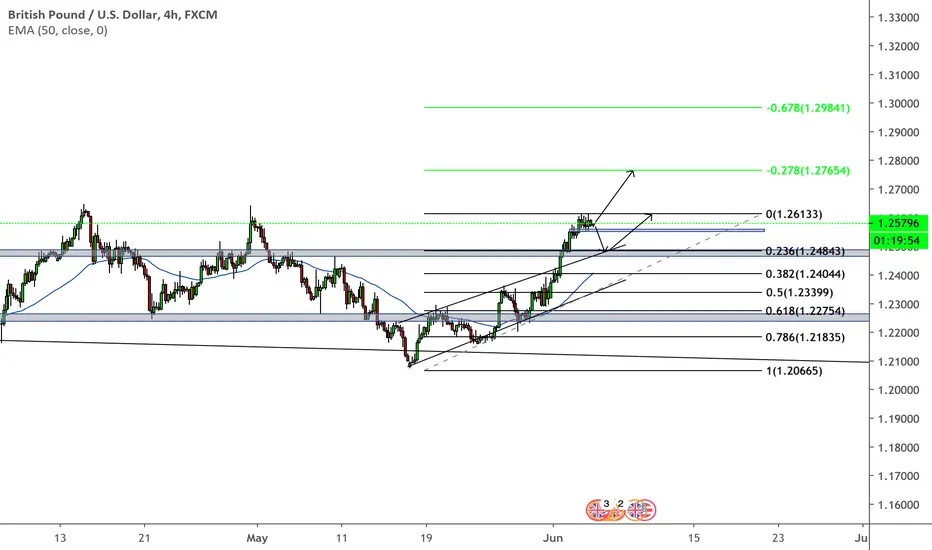
GBPUSD-Possible Strong Bullish Momentum?-There are two ways in which we could enter this pair on which is either to enter on reversal to the demand zone
-Or either we enter at the breakout of the 1.26133.
-Either way there is strong bullish momentum indicated by the break of the ascending channel.
-The 50 EMA is also showing the bullish signals for this pair.
-We will have to wait to see how price will react to these levels and look for strong bullish candle confirmation for entry.
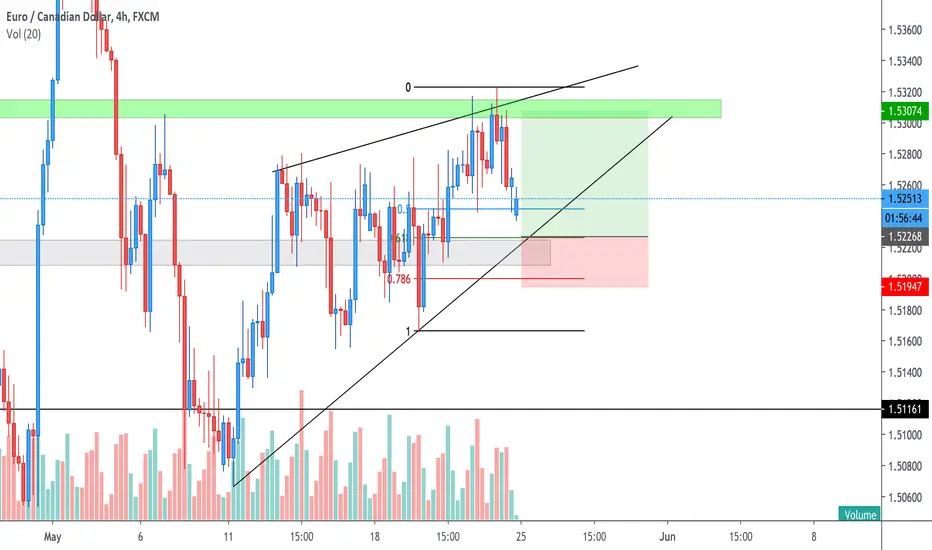
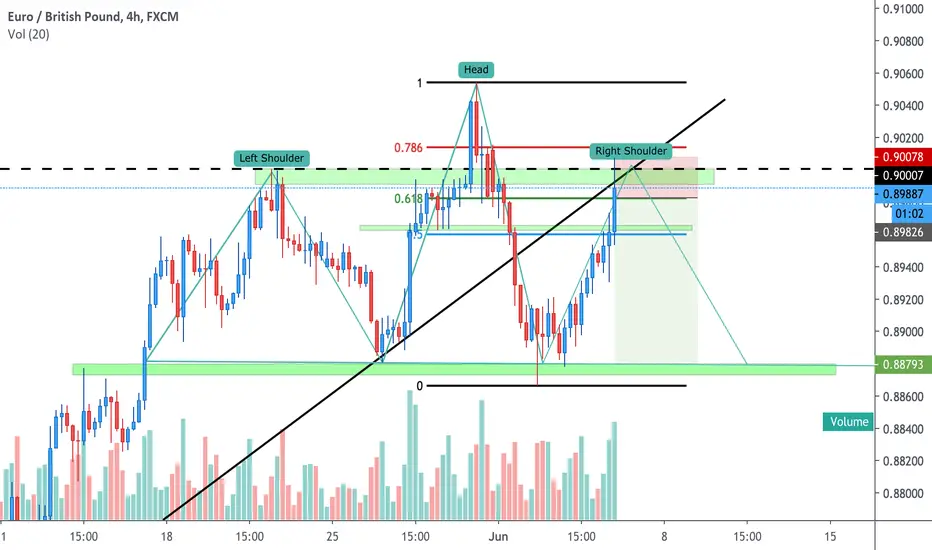
H&S Short SetupAfter breaking out of the ascending trendline, we are now retesting it on the H&S pattern and previous resistance highlighted in green. Furthermore, the 0.618 fib level has also shown it's presence there providing us with a solid zone of confluence to potentially open a short position from.
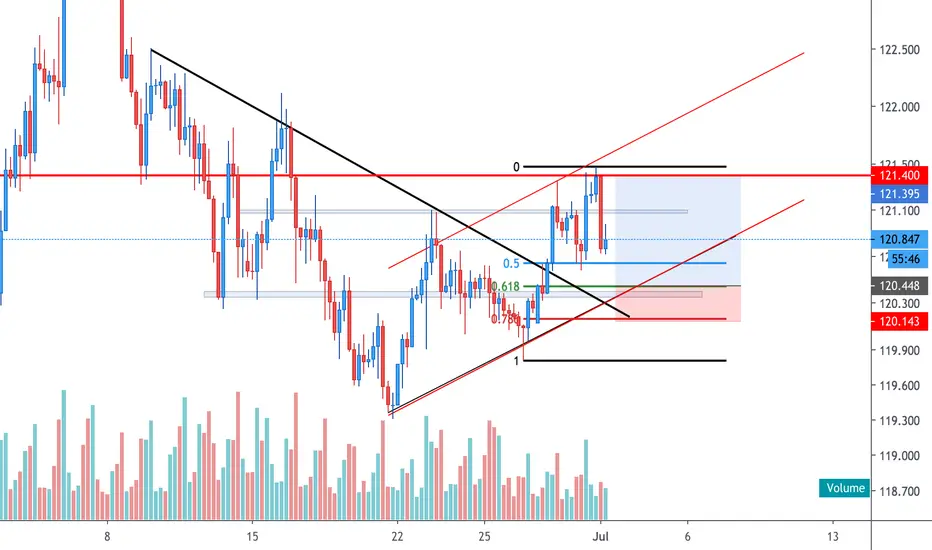
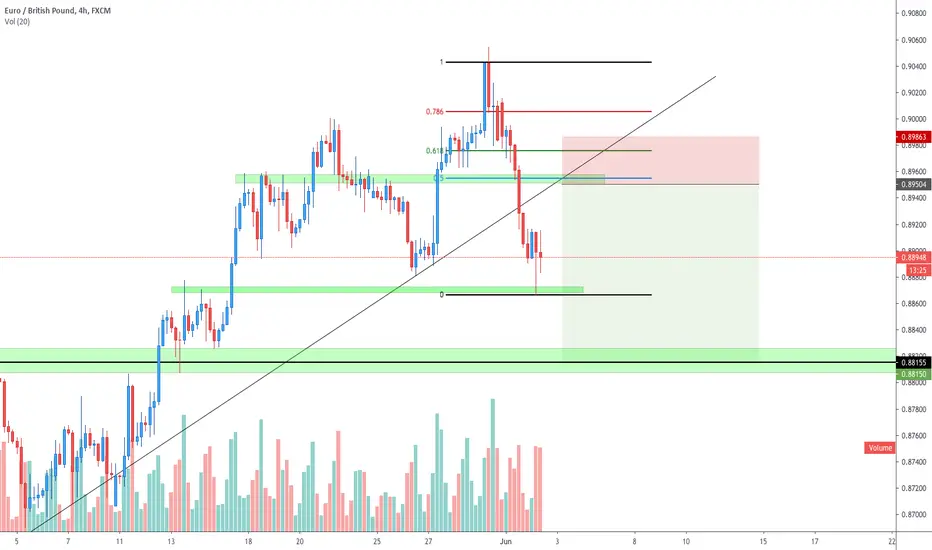
Sell on PullbackAfter breaking below the ascending trendline, we will now be looking to retest it on a pullback towards the 0.5 Fib level in correspondence to the previous resistance zone.
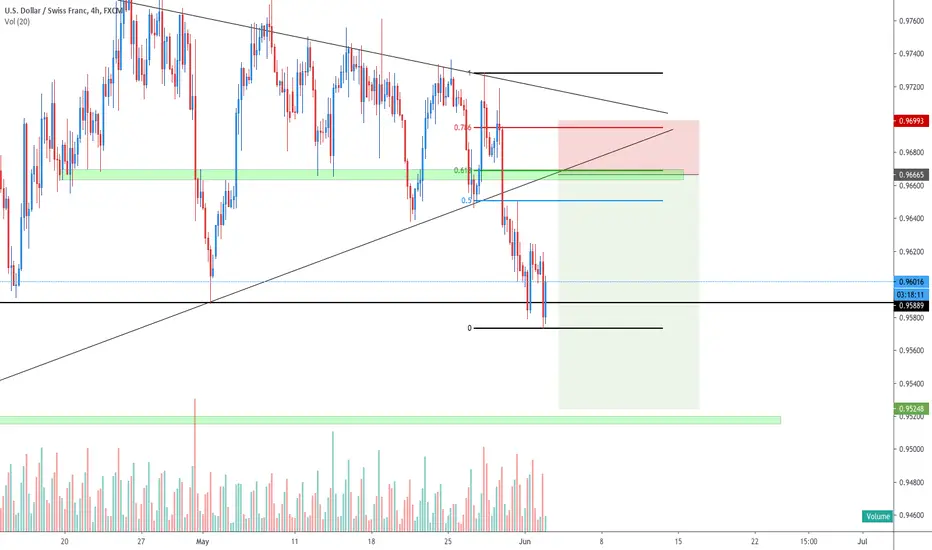
USDCHF Looking for a PullbackAfter the long consolidation period within the symmetrical triangle, USDCHF finally decided to break below and we will be looking to retest the ascending trendline. Looking for a pullback on the 0.618 Fib level in correspondence to the previous support now acting as resistance. The three TA elements outlined together create this zone of confluence in which we could consider opening a short swing trading position.
This is NOT a financial advice, trade at your own risk!
Golden Pocket SetupThis is a follow up trade from my last USDJPY setup:
-Bullish trend within a wedge. Looking to retest lower ascending trendline for a long position.
-1H trendline break, looking for a pullback to retest the trendline.
-Golden pocket with our 0.618 retracement level on lower time frames.
-Respectable support area outlined in grey, hence why the SL is higher than usual