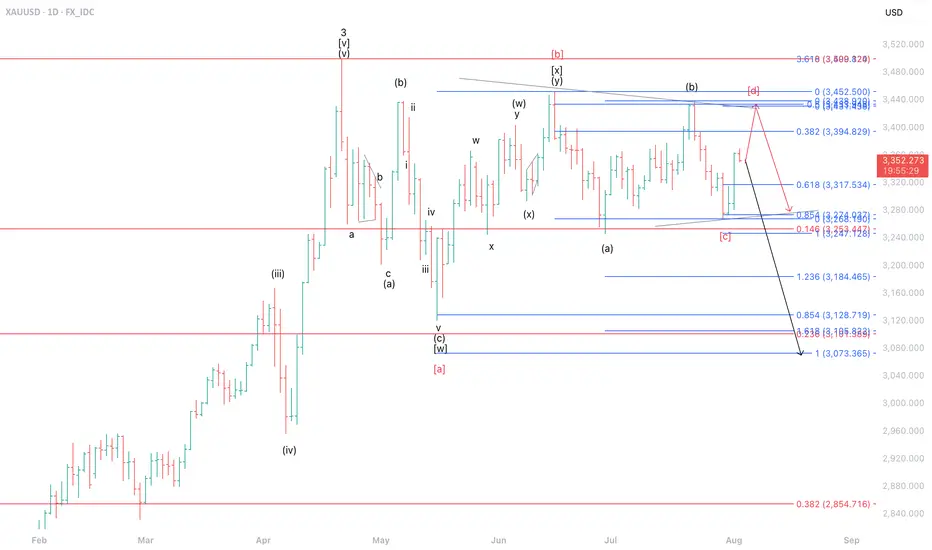
Potential Reversal After Complex CorrectionThe current movement of gold (XAUUSD) is estimated to be forming part of wave ii of wave (c) of wave under the black label scenario. This implies that XAUUSD has the potential to undergo a deeper correction, targeting the 3,073–3,184 range.
However, under the alternative red label, the price action appears to be developing a triangle pattern as part of wave of wave 4. In this scenario, XAUUSD still holds the potential for further upside toward the 3,394–3,438 area, which also coincides with a Fibonacci cluster zone, serving as a critical resistance region.
Consolidationzone
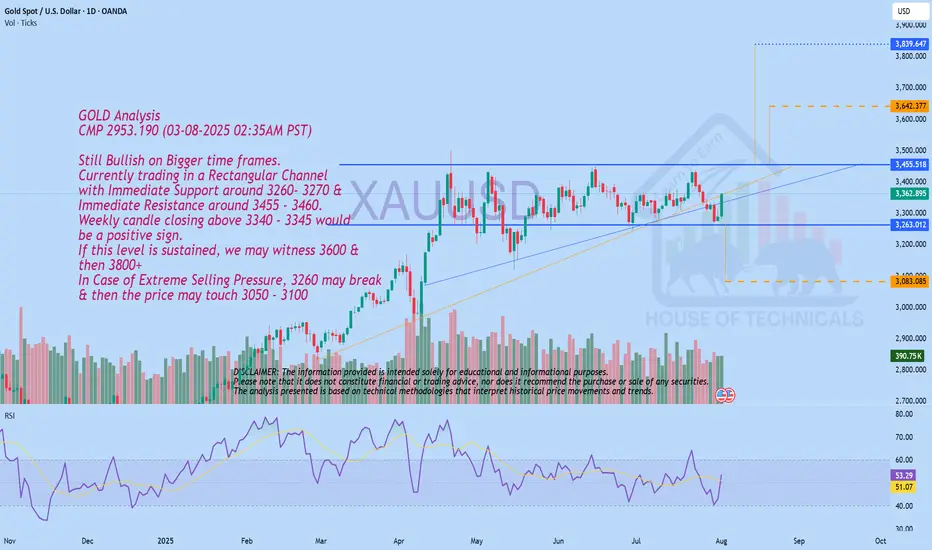
Currently trading in a Rectangular ChannelGOLD Analysis
CMP 2953.190 (03-08-2025 02:35AM PST)
Still Bullish on Bigger time frames.
Currently trading in a Rectangular Channel
with Immediate Support around 3260- 3270 &
Immediate Resistance around 3455 - 3460.
Weekly candle closing above 3340 - 3345 would
be a positive sign.
If this level is sustained, we may witness 3600 &
then 3800+
In Case of Extreme Selling Pressure, 3260 may break
& then the price may touch 3050 - 3100
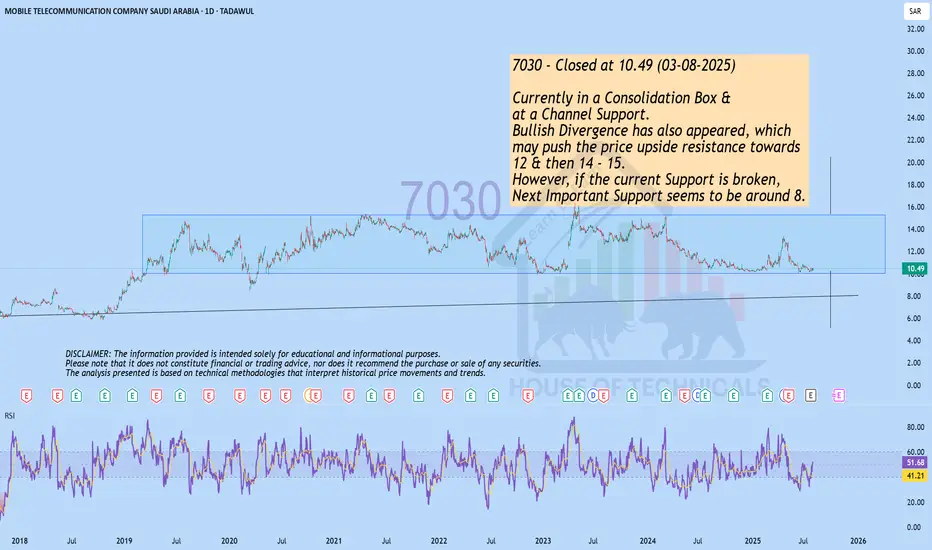
Currently in a Consolidation Box &..7030 - Closed at 10.49 (03-08-2025)
Currently in a Consolidation Box &
at a Channel Support.
Bullish Divergence has also appeared, which
may push the price upside resistance towards
12 & then 14 - 15.
However, if the current Support is broken,
Next Important Support seems to be around 8.
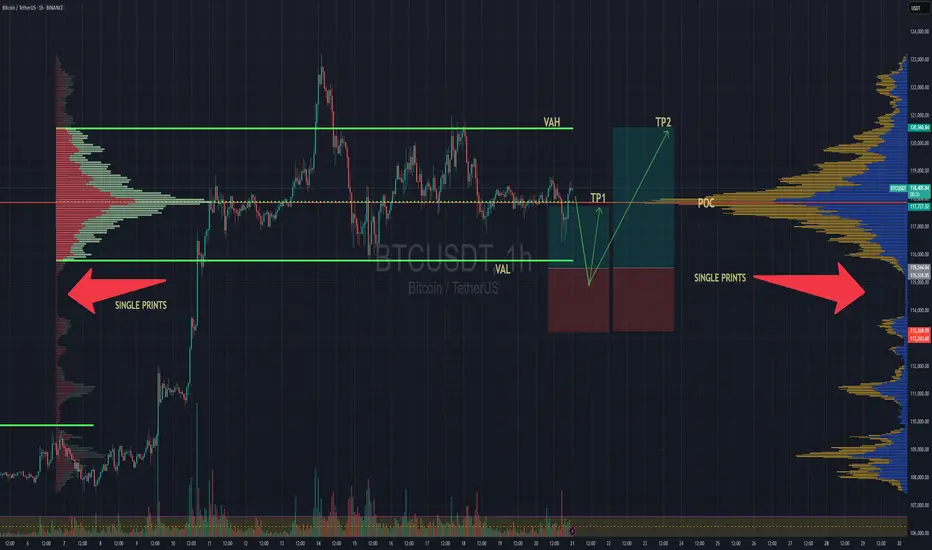
BTC Balanced Volume Profile BTC is now trading in a textbook D-Shape Volume Profile. In english - Buyers & Sellers are happy to transact here and will stay inside the value area & consolidating sideways until further notice.
Consolidation at POC is a signature of this profile, and one of the easiest and least stressful trade setups because now, your mission, should you chose to accept. Is to fade the Highs (VAH) and Lows (VAL) and avoid the middle unless you love donating money to the market.
I'll have buy limit orders waiting right below the VAL where we have the single prints. It doesn't get any easier than this.
Doesn't mean price cant rip through, but this is always the best entry with less risk, especially when the single prints have not been tested yet..
BINANCE:BTCUSD CME:MBT1!
Currently in a Consolidation Zone.ANL Closed at 8.06 (24-06-2025)
Currently in a Consolidation Zone.
6.90 - 7.0 seems to be an Important Support
Level.
Bullish Divergence on Bigger tf.
Immediate Resistance is around 10.50 & then
around 13 - 13.50

Long ConsolidationBNWM Analysis
Closed at 63.48 (18-06-2025)
Long Consolidation of 9 - 10 years almost.
Now either wait for Breakout above 69; or
Wait for a Good Support around 35 - 43.
Once 69 is Crossed & Sustained with Good
Volumes, we may witness 100+

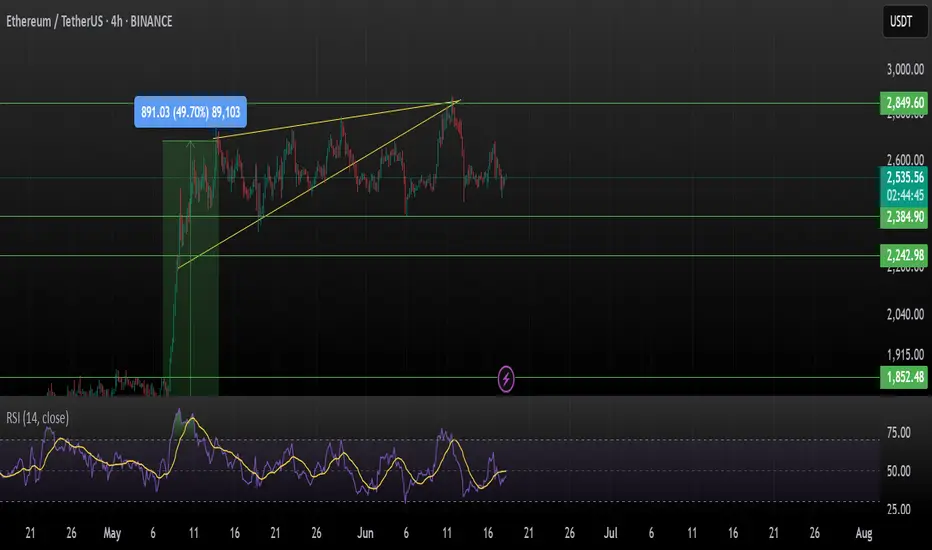
Ethereum (ETH/USDT) – Breakdown From Ascending TriangleEthereum failed to hold above the crucial resistance of $2,849 and has broken down from the ascending triangle on the 4H timeframe — invalidating the bullish breakout structure.
It seems to be consolidating and moving sideways in the range. The move is possible only if we break the channel either upside or downside.
Key Observations:
Ascending triangle fakeout followed by sharp rejection
RSI dropped from overbought (~70) to neutral zone (~46), showing weakening momentum
Current price: $2,537, testing local support at $2,384.90
Next major support zones: $2,242.98 and $1,852.48
Watch for further weakness below $2,384 — could accelerate downside toward $2,242 or lower.
Caution advised: Wait for the structure to rebuild before positioning it long.
This is not financial advice, please do your research before investing, as we are not responsible for any of your losses or profits.
Please like, share, and comment on this idea if you liked it.
#ETH #Ethereum #ETHUSDT
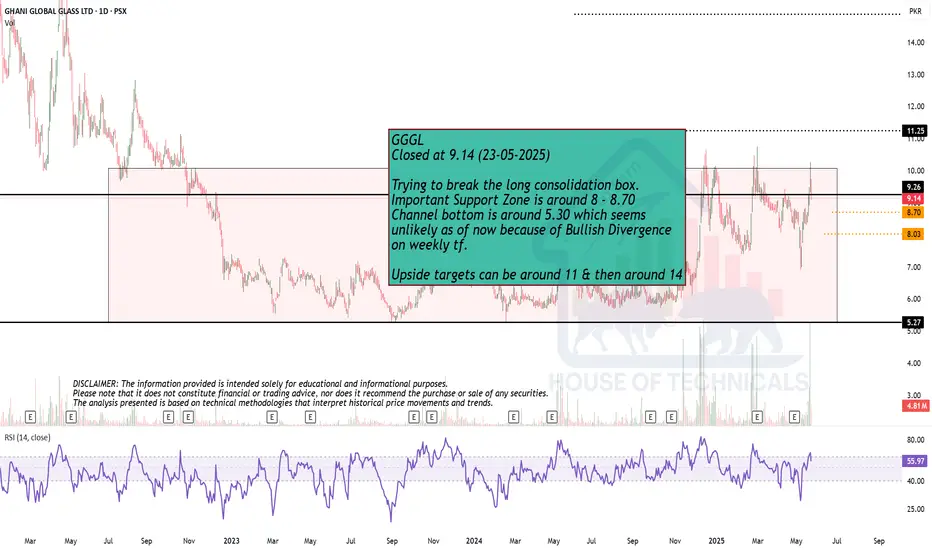
Conslidation Box
Closed at 9.14 (23-05-2025)
Trying to break the long consolidation box.
Important Support Zone is around 8 - 8.70
Channel bottom is around 5.30 which seems
unlikely as of now because of Bullish Divergence
on weekly tf.
Upside targets can be around 11 & then around 14
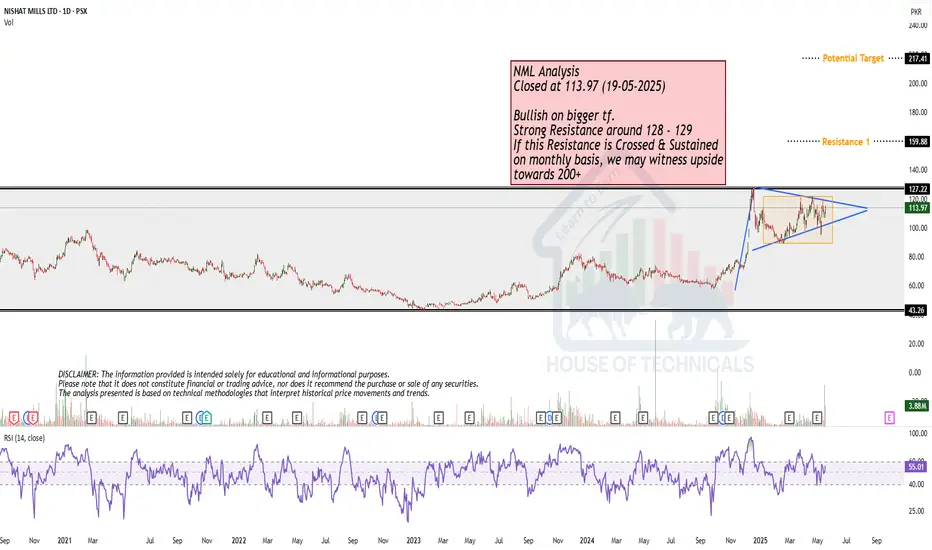
Bullish on bigger tf but Strong Resistance ahead.
Bullish on bigger tf.
Strong Resistance around 128 - 129
If this Resistance is Crossed & Sustained
on monthly basis, we may witness upside
towards 200+
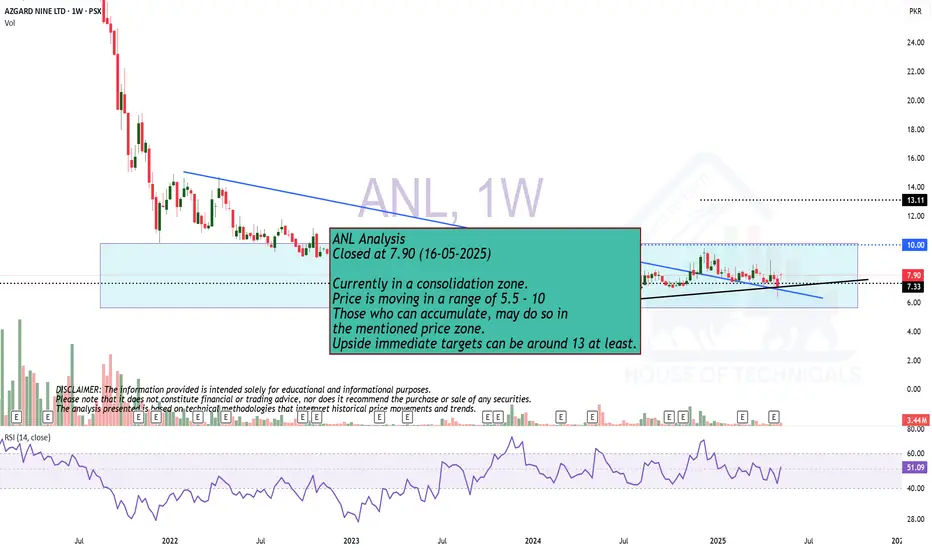
Currently in a consolidation zone.Currently in a consolidation zone.
Price is moving in a range of 5.5 - 10
Those who can accumulate, may do so in
the mentioned price zone.
Upside immediate targets can be around 13 at least.
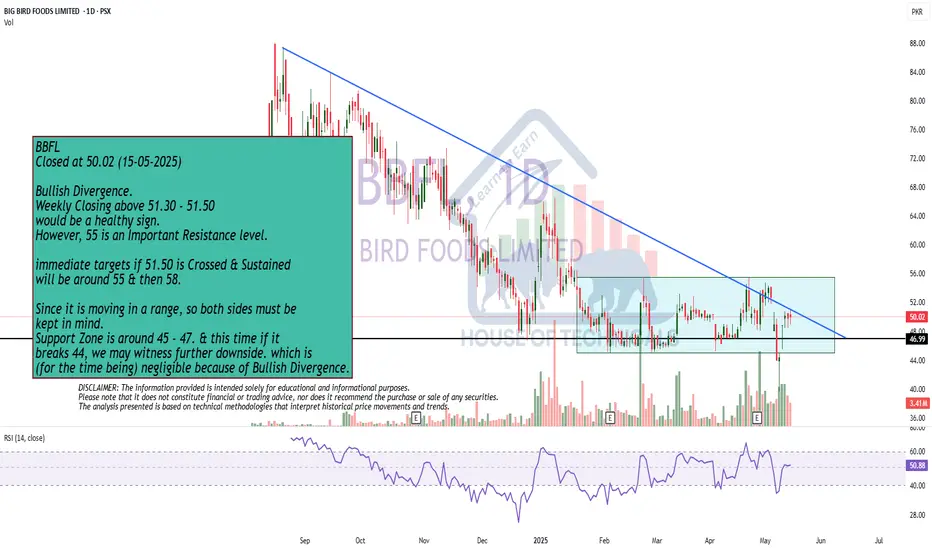
Bullish Divergence.
Bullish Divergence.
Weekly Closing above 51.30 - 51.50
would be a healthy sign.
However, 55 is an Important Resistance level.
immediate targets if 51.50 is Crossed & Sustained
will be around 55 & then 58.
Since it is moving in a range, so both sides must be
kept in mind.
Support Zone is around 45 - 47. & this time if it
breaks 44, we may witness further downside. which is
(for the time being) negligible because of Bullish Divergence.
Monthly Closing above 7.50 - 7.60 will be very healthy!
Monthly Closing above 7.50 - 7.60
would be a very healthy sign.
We may then easily witness upside
towards 8.70 - 9.10 & then 10.50 - 11
Remember it is in a long consolidation
with Slowly moving in an Upward Channel.

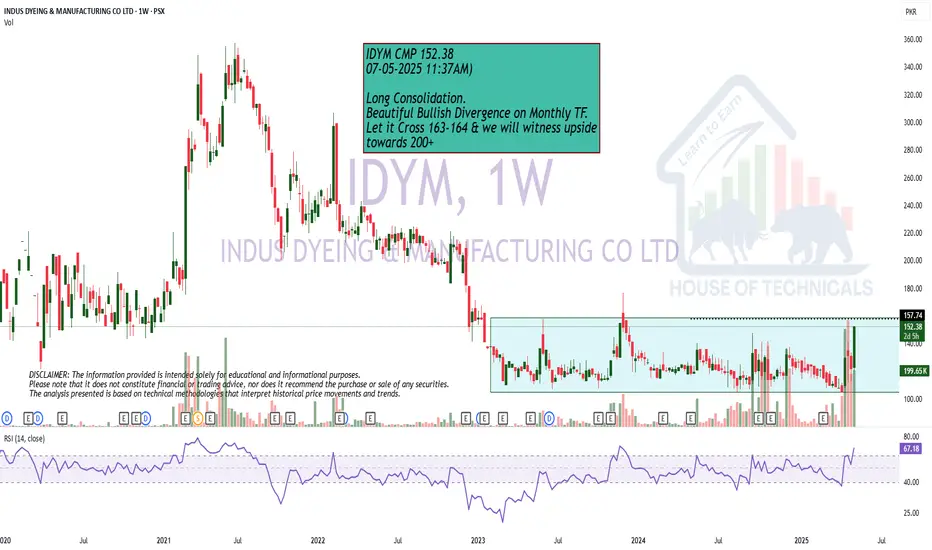
Near BreakoutLong Consolidation.
Beautiful Bullish Divergence on Monthly TF.
Let it Cross 163-164 & we will witness upside
towards 200+
Consolidation BoxBBFL Closed at 53.24 (25-04-2025)
Currently in consolidation box.
Crossing 55 - 56 may lead it towards 63 - 65 initially

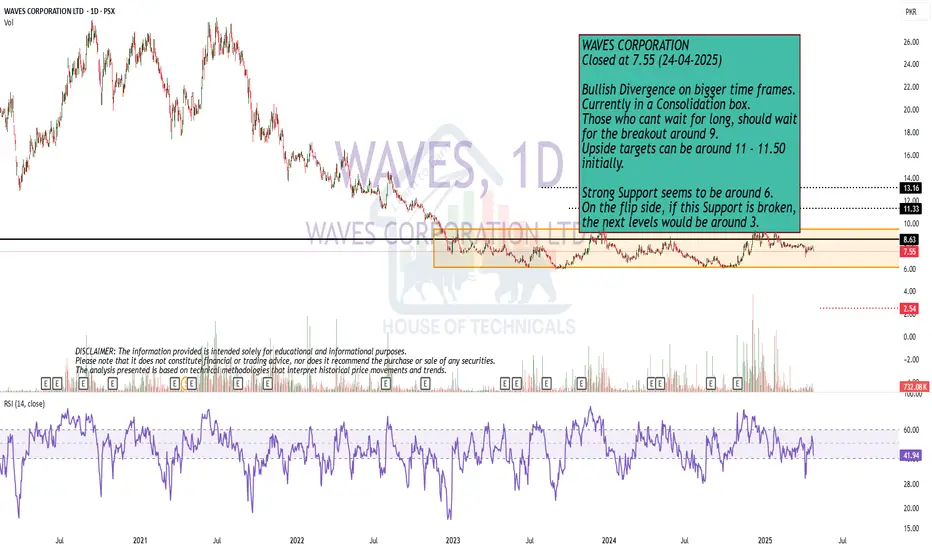
Bullish Divergence on bigger time frames.
Bullish Divergence on bigger time frames.
Currently in a Consolidation box.
Those who cant wait for long, should wait
for the breakout around 9.
Upside targets can be around 11 - 11.50
initially.
Strong Support seems to be around 6.
On the flip side, if this Support is broken,
the next levels would be around 3.
Mobius (MOT) is in more than 200 days consolidationHi Traders,
Mobius (MOT) is in more than 200 days consolidation.
Buy Price - 0.0005
Sell Price - 0.015
Profit - 3,000%
Happy Trading!

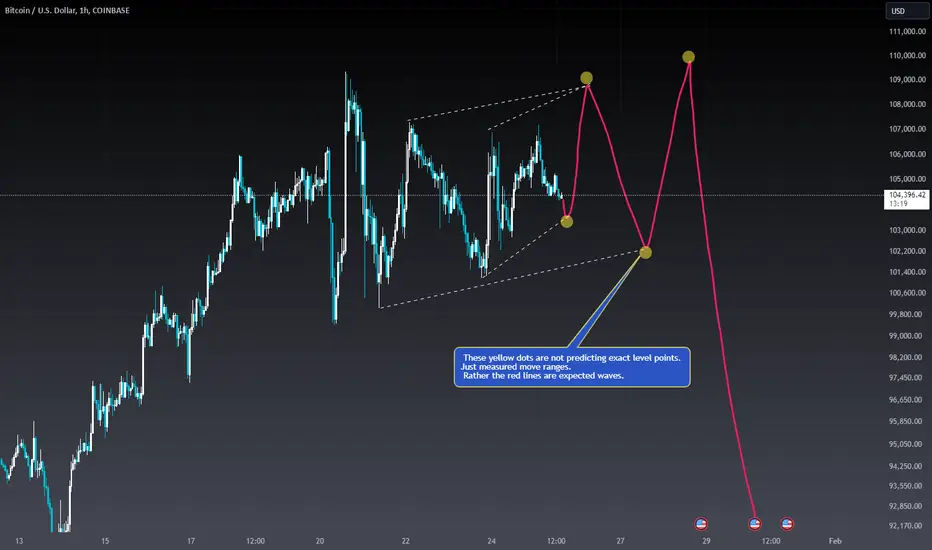
BTC consolidation waves countsBTC consolidation waves that are expected, though those yellow points are not exact, just measured/approximate moves.
CADCHF new bullish expectations
OANDA:CADCHF we are have bullish push in last periods, now ASCENDING CHANNEL visible, its breaked, currently price in consolidation, +price is on zone, from which expect to see bounce
SUP zone: 0.63100
RES zone: 0.63900, 0.64200

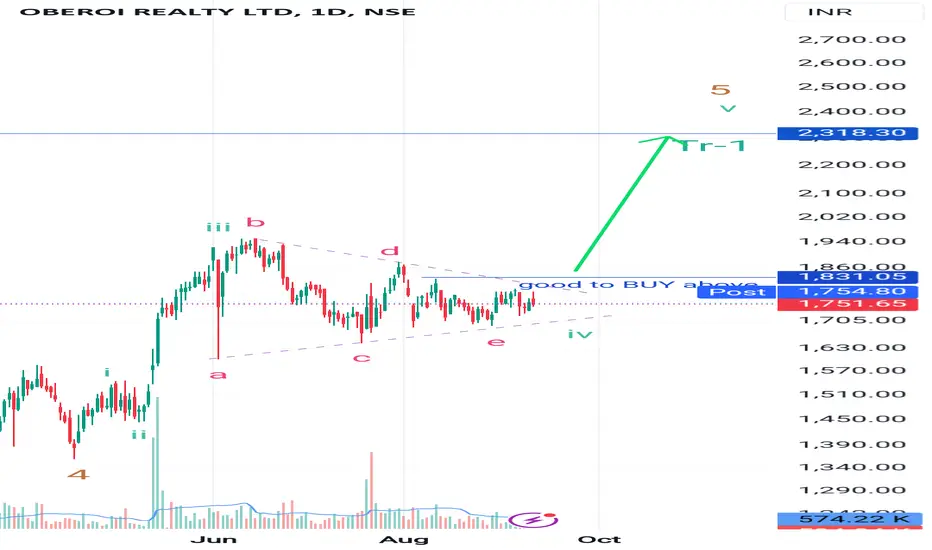
Oberoi reality consolidation #oberoireality is consolidated in daily Timeframe, it looks like triangle pattern, but one needs to be aware has lot of time fake breakout is been seen, good for buying in cash, risk management and patience is important overall bullish for short-term swing.
EURNZD new bearis hexpectations
EURNZD we are have bearish trend in last periods, with many rejections, in my opinion we are not see to much here, currently price is make bounce on zone 1.79300 and from here expecting continuation.
SUP zone: 1.79500
RES zone: 1.77000, 1.76400

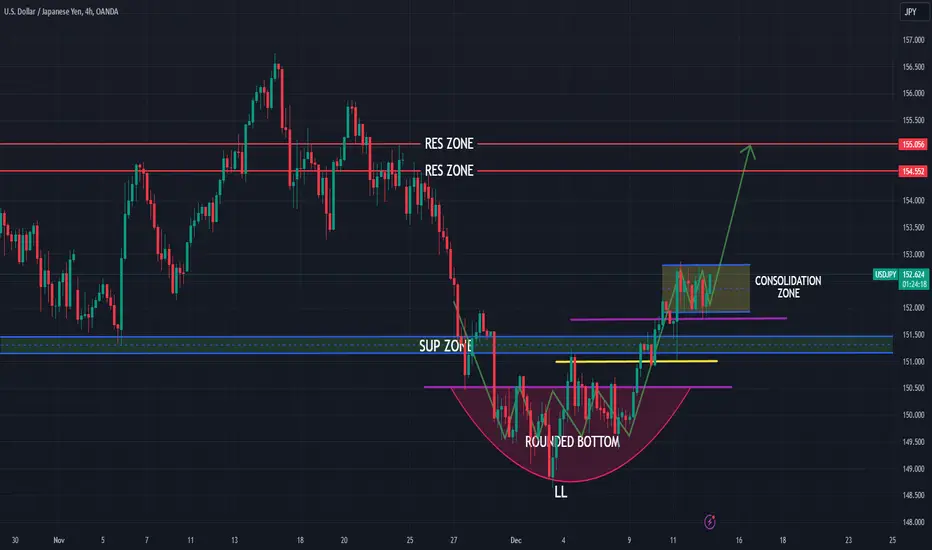
USDJPY new bullish for expect
FX:USDJPY trend based analysis, we having in period from 1.12 - 9.12 ROUNDED BOTTOM pattern visible, price is make break of same and confirmation of same (yellow line) and its make short bullish push, currently price in consolidation, its on strong ex. zone 151.800 (violet line).
What here expecting after todays and past events in this week, still looks like we will have strong USD and here exepcting to see new bullish push.
SUP zone:151.450
RES zone:154.550, 155.050
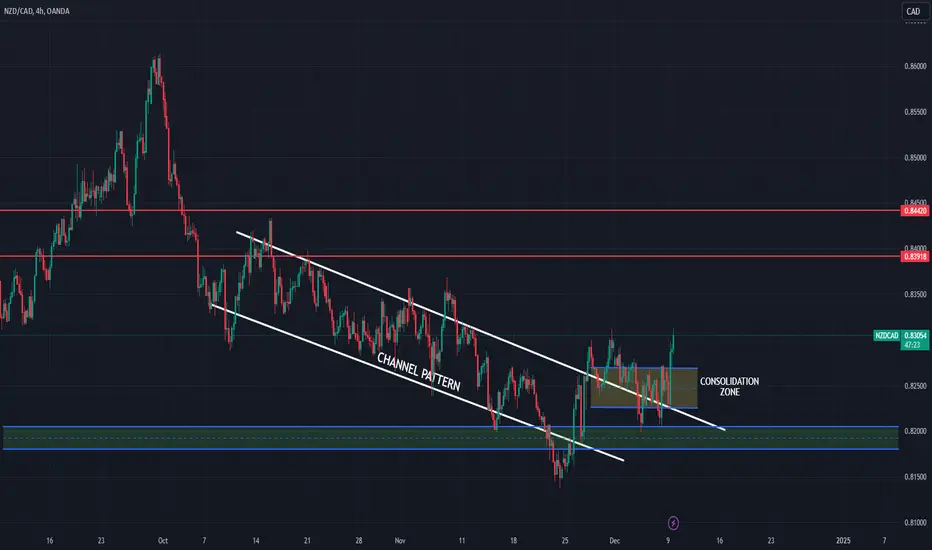
NZDCAD strong bullish for expect
NZDCAD price break CHANNEL PATTERN, we are can seen bounces on structural zone on 6.Dec.
Consolidation zone is breaked, price is not make some specials moves still, for me from here is good to go long.
SUP ZONE: 0.82050
RES ZONE: 0.83920, 0.84420
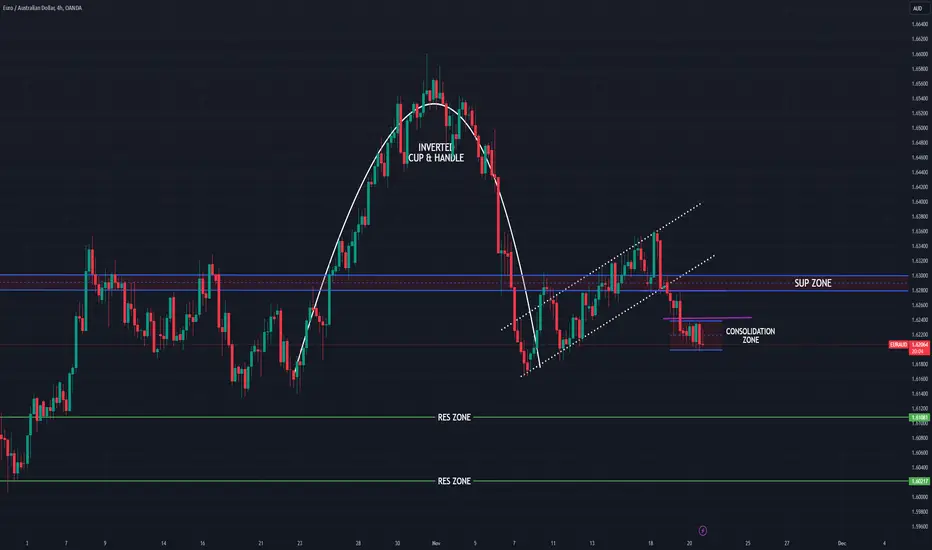
EURAUD C&H breaked, bearish still to expect?
EURAUD analysis based on on CUP & HANDLE pattern, we are can see break of same, currently price in consolidation zone, and from here exepcting break and higgher bearish trend
SUP zone: 1.62800
RES zone: 1.61100, 1.60200