New look on EURUSD shorts continue I could possibly try catch the smaller intra day upside retracement that we will see very soon but I'm more interested in holding a longer term continuation short, so this is just a bit of an idea of where I believe price is heading next.
Continuation

DXY - BULLISH PULLBACK TRADEThe DXY has just broken above a previous level of structure resistance & there seems to be a good amount of open space before it reaches the next level. If we can get a pullback into the previous level of resistance that we would look to act as the support, it would offer the opportunity to get involved in a bullish continuation trade.
Akil

EURNZD - BREAKOUT & PULLBACK TRADEAfter an extension lower the EURNZD has recently been in a period of consolidation. A breakout of that consolidation would offer a good amount of potential upside & that's what we're looking to take advantage of in this trading opportunity.
Akil

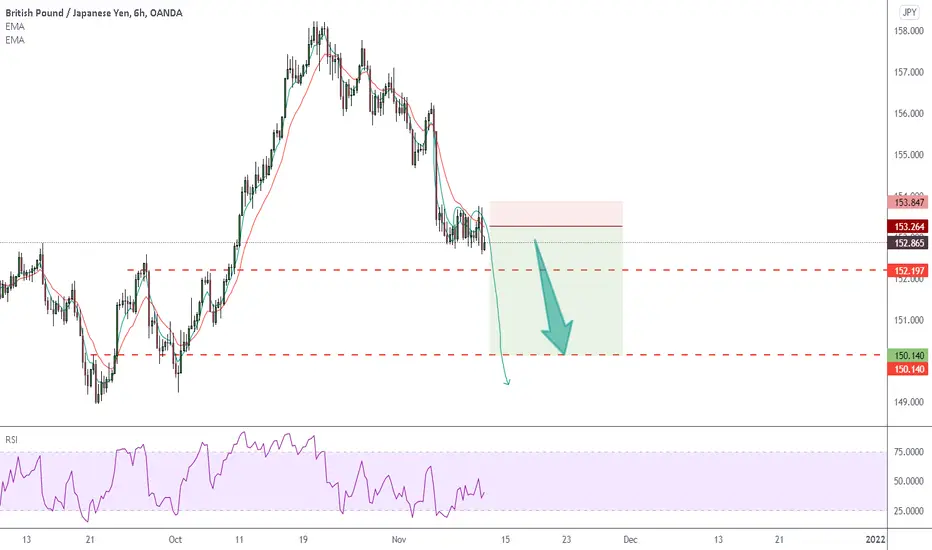
1111 Trend Continue GBPJPY down to new low 150Hello traders,
GBPJPY is on my selling list again after sideways price action on 6H chart.
RISK LOWER THAN YOUR TOLERANCE:
Suggested Risk <5%
Your Real Entry Position Will Make Different RR for Your Trade.
GOOD LUCK!!!
LESS IS MORE!
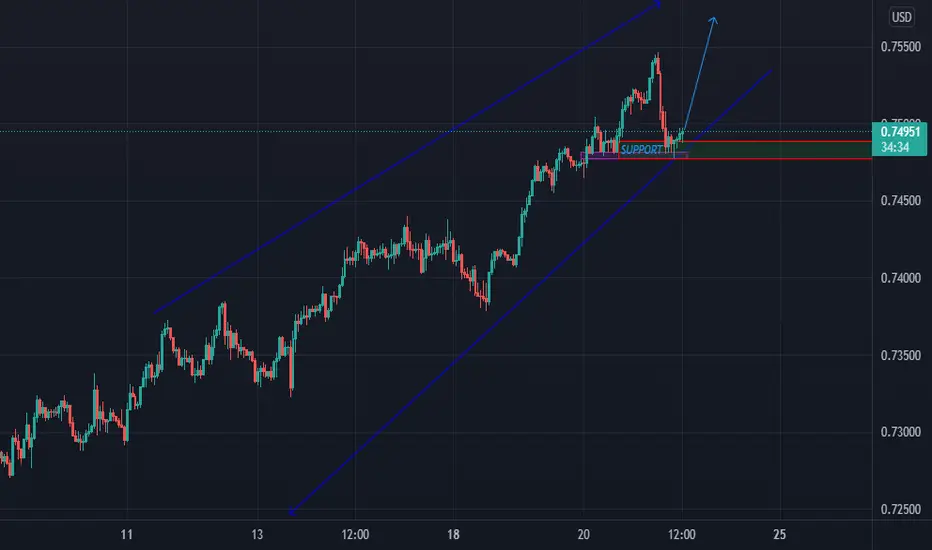
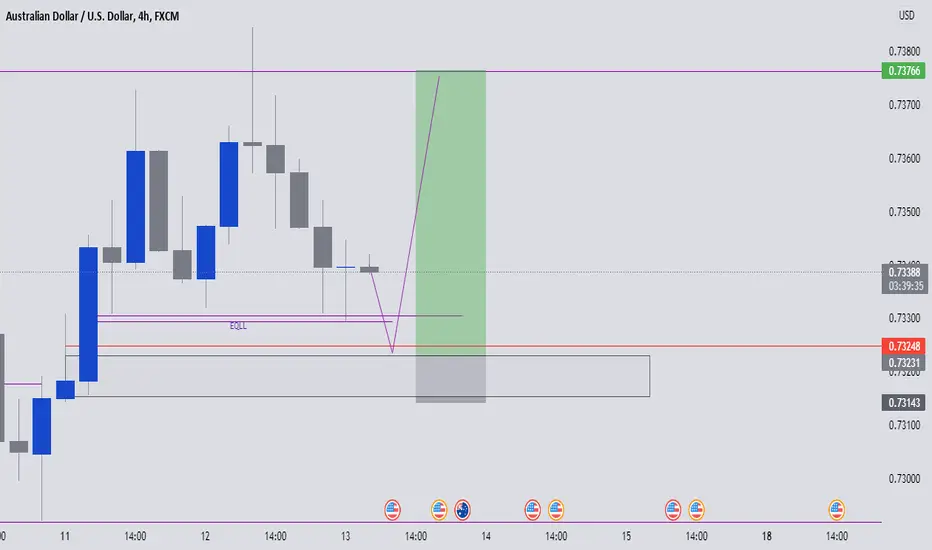
AUDUSD BEARISH CONTINUATIONAUDUSD sell continuation as our 4 november 2021 prediction was trend reversal because of Bearish harami cross visible at the top of the uptrend. This pattern was rejected 0.75460 level and our prediction was Short position coming soon it's already breaks the 0.75650 next was breaks the 0.74160 level successfully. We hope that 0.73800 support is its small bouncing (sideways) zone and last of all it will break and will touch the strong support 0.73100
*Top resistance 0.75480
*Next 0.74950
*resistance 0.74650
* recent resistance 0.74160
Support 0.73800
Support 0.73100
Support 0.72270

UPDATE: $VET continues to break upwardsPosted the original chart back in late October.
Since then, VET has broken its downtrend line, held above it and continued to appreciate.
I still think there's a lot more room to run back to ATH's and even higher if the market allows.

EURJPY -Decision Point at Structure The $EURJPY is currently sitting at what I call a decision point, which means that price is currently at a place where the buyers & sellers are going to fight it out & the result will give us a powerful clue of what's likely to happen next.
In this video i'll walk through this scenario & give you some ideas of where I would predict price action to go next based on both a buillish & bearish scenario.
If you have any questions, comments or just want to share you idea, please feel free to do so below.
Akil

GBPNZD - Bearish Continuation TradeIn this video we're going to take a look at a bearish continuation setup on the $GBPNZD. The idea behind this trade follows my 4-step I.P.D.E. process of Identifying what price has recently done & then using that knowledge to make a prediction of what direction are we likely to continue in next & IF we do continue in that direction THEN where is the next level that we're likely to run into trouble at.
In today's example the I phase was a previous level of structure support that was recently violated along with the reading of the last days candle. The P section used structure recognition, harmonic moves & psychological numbers to dial down on a target location.
I hope you guys enjoy the video, I hope it's informative & most of all i hope that you have a positive week on your trading journey.
If you have any questions, comments or just want to share you idea, please feel free to do so below.
Akil

KAVA DESCENDING TRIANGLEKAVA is just at the end of a DESCENDING TRIANGLE which is normally a CONTINUATION pattern or BEARISH PATTERN.
DAILY TF we are breaking to the upside, but if it does not complete it is a FAKE OUT and we will see a RETRACMENT.
If it completes we have the targets as follows.
ENTRY 5.7-6.0
TARGET 1 $6.5
TARGET 2 $7.1
TARGET 3 $7.5
TARGET 4 $8.2
TARGET 5 $9.50 ATH
STOP LOSS $4.5 SPOT
STOP LOSS $5.4-5.6 3X LEVERAGE
NOT FINANCIAL ADVICE!

US30 TP @ 35946.09 ^Based on D1 Fibonacci extension and momentum (backed up bu the MN1 candle) I see US30 reaching at least this target.

BUY TRADE SET UPBulls still in control, the local trend is up, this a good opportunity for traders to buy to resistance
USDJPY watching for long tradesLooking at jumping on a long trade if we keep rejecting that 114 area because we still are in bullish territory and we may see another upside rally, so huge potential for profit if can produce a nice entry... obviously move those stops to entry level as soon as 10 pips or so in profit.

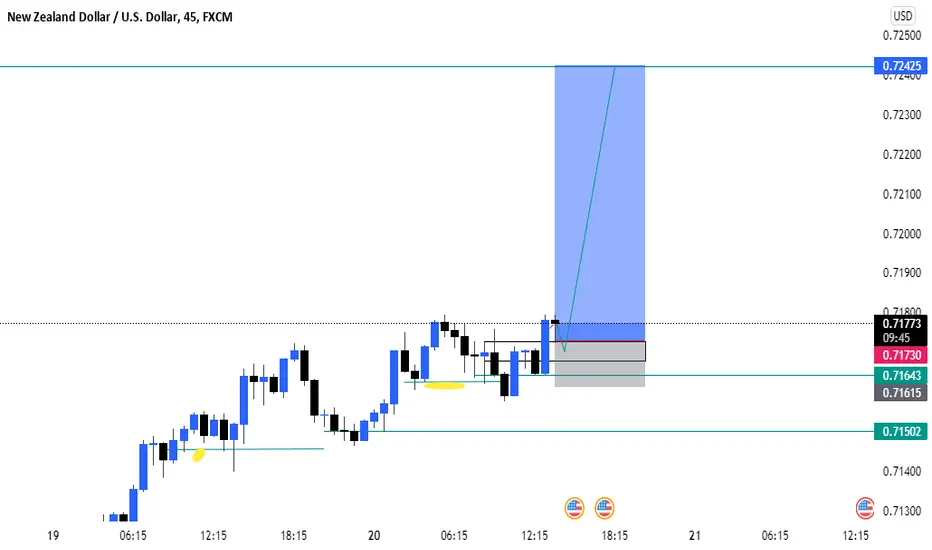
#NZD USD# 1:6 RRR BUY TRADE Buy trade acticated NZD USD possible buy side liquidation 1:6 RRR low risk entry
EURAUD Reversal Head and Shoulder Price Action, watch for sell
Hello traders:
EURAUD is looking very clean on the higher time frame as it is forming the right shoulder of the H and S pattern.
We can see after price hit the higher time frame double tops, a strong impulse move to the downside, hitting the previous lows.
Then we see price correctively move up in an ascending channel, good sign of a continuation bearish price action.
Latest development here is price is still within the correction, so best to wait for confirmation impulse out from the structure, a
nd lower time frame bearish continuation correction to get in on the sell.
Thank you

USDCAD TRY TO HIT 1.22600 SUPPORT AND MOREUSDCAD After breaking it's head and shoulder pattern on 1.2500, and correction area was 1.24900 successfully breaks the lower low 1.24300. I expect this market next movement will 1.22600 support and more.

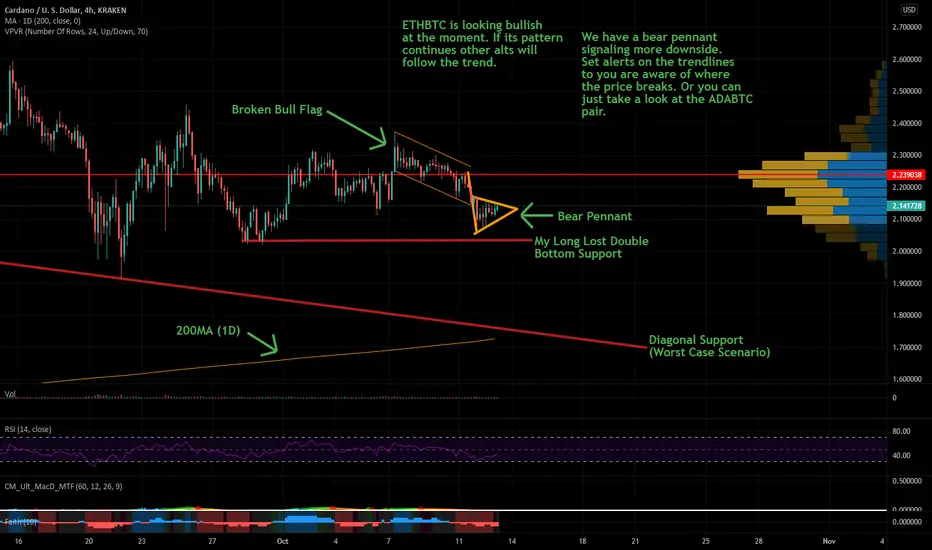
ADAUSD Bull Pennant & Small Pairs PumpImportant things to note:
BTC is taking a breather today, it recently hit the 54K level I have been talking about.
Because of this, altpairs are looking better.
ETHBTC made its first little pump back up.
ETHBTC will lead other altbtc pairs in the push upward.
I believe there is more downside for altpairs.
ETHBTC looks like it has a small bull flag.
ADAUSD is showing a bear pennant signaling more downside.
Set alerts to both trendlines so you know where it breaks.
If it breaks to downside expect a stop at 2.03.
If it breaks to upside, I would expect consolidation.
Important dates:
BTC ETF Deadlines Nov. 21, Dec. 8, Dec. 11 and Dec. 24.
Today was an interesting day. BTC has finally hit the 54k level I was waiting for, but only for a second. Since BTC is slowing down right now, ALTBTC pairs are looking better. Especially ETHBTC. I expected ETHBTC to get a little pump exactly where it is at, however, I did not expect it to produce a bull flag. This may just be a fluke however. The reason this is important is because ETHBTC will lead the charge for the alts when they start moving. So, I watch it very closely. Personally, I expect more downside from alts in general (ADA included). But, if ETHBTC starts moving, things may turn around. When looking at ADAUSD, I see a pretty clear bear pennant signaling more downside. Set you alerts on both of those trendlines so you are aware of the directional change. If ADA moves to the downside I expect it to hit 2.03, and if it moves to the upside, I expect it to start consolidating for upward movement. There is still room for my double bottom on the 1D (I know I have been waiting a couple weeks for it, but it can still happen). Anyways, this was just a short update. All in all, if you want to see where things are headed in terms of alts, just look at ETHBTC. If the bullishness breaks, expect more downside. Personally, I still believe alts will start moving sooner than many people think. That being said, I will continue to watch ADA and update you all accordingly! Thanks again everyone!
I am going to make a video soon teaching everyone my approach to charting. I will cover the entire workflow process I go through. I hope you enjoy it.
Tell me what you think?
This is not financial advice. DYODD.
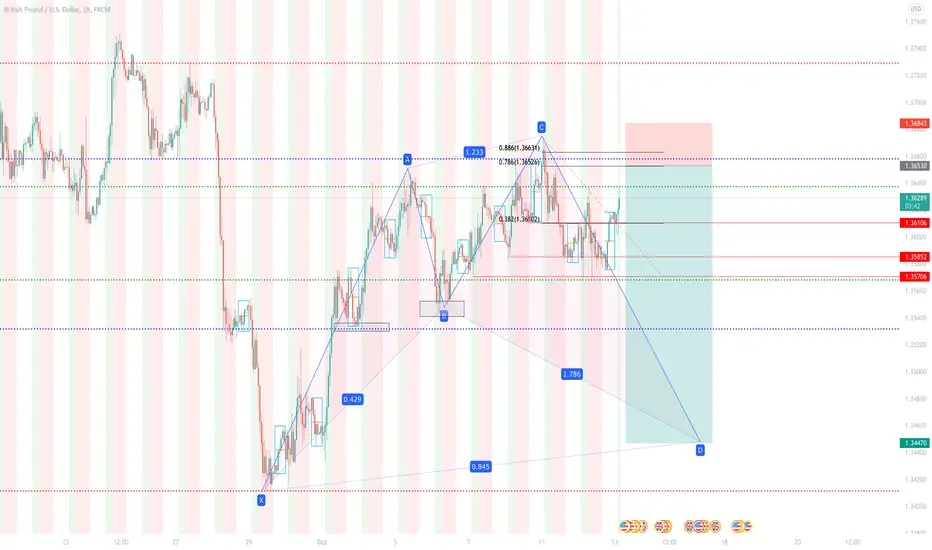
Potential Shark - Order Limit Set GBPUSD - Potential Shark forming, I have an order limit set at 1.36529 landing on a high liquidity zone and also the 0.786 of the fib from the HTF PA
#AUD CAD# 1:12 RRR BUY TRADE SETUPI am looking for buy on AUDCAD possible buy side liquidation and trend continuation.thanks.

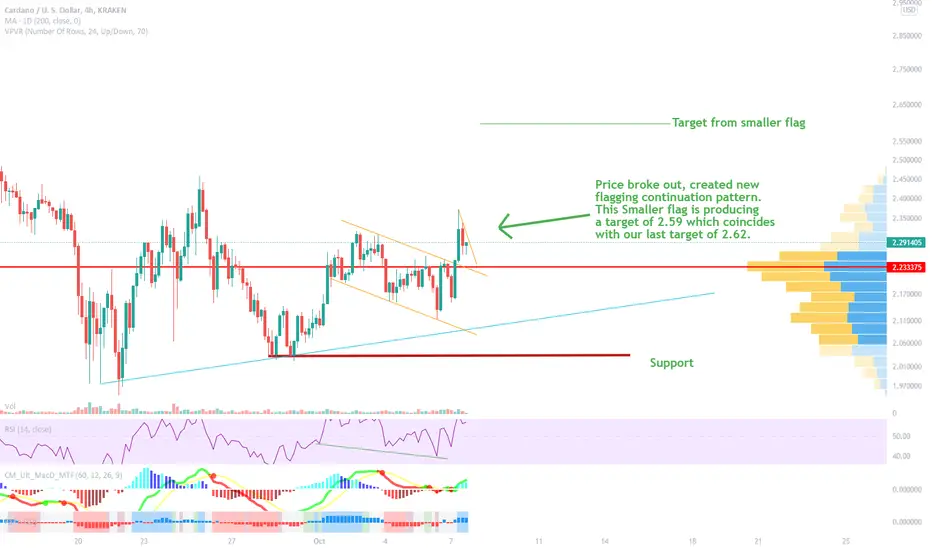
ADAUSD Starts the Continuation of UptrendImportant things to note:
BTC is cooling off. I do not see it going much lower.
ADA started its flagging continuation.
Price broke out of last flagging pattern.
ADA created a smaller flag for continuation of uptrend
Price target from smaller flag is 2.59.
This coincides with our last target of 2.62.
We now have a general idea of where the price is headed.
I have noted the hidden divergence I saw.
Important dates:
BTC ETF Deadlines Nov. 21, Dec. 8, Dec. 11 and Dec. 24.
I am going to make this quick because the update is pretty self explanatory. Right now BTC is cooling, but I do not see it going past 53k before it starts moving up again. ADA has broken out of our last pattern with a classic 3 drives pattern and has now created a smaller flagging pattern. The target from the smaller patter is 2.59. This is measured by the size of the pole added to the top of the pole. This target coincides with our last target of 2.62. The target from the smaller flag is 2.59. If the pattern does not break, this is the general area the price is heading to. If the price breaks, it will head towards a support of 2.15 or 2.03 etc. However, since we have bullish momentum and bullish signals, and patterns, we should assume the pattern will complete. I have also noted the hidden divergence I mentioned on my last chart. Remember, try to relax during this time. The momentum of ADA will lag behind BTC, but once BTC hits its ATH and retraces, its time for altcoins to start really moving. For now, expect minimal gains, maybe a small pullback and a lot of consolidation. I will continue to keep an eye on ADA and update you accordingly. Thanks again everyone!
I am going to make a video soon teaching everyone my approach to charting. I will cover the entire workflow process I go through. I hope you enjoy it.
Tell me what you think?
This is not financial advice. DYODD.
Wait for a continuation pattern and a selling opportunity GBPUSDH1 time frame.
Structure: Downtrend.
After the price rallied to the confluence between the trendline and the 1.36000 resistance, there was a downside move in the direction of the main trend.
Now, wait for a completed trend continuation price pattern and a sell signal.
The profit target is the 1.34200 zone.
-----------------------------------------------------------------------------------------------
Wish you all have a good trading day!

ETH creating a small falling wedgeAs you can see in the pic ETH is creating a small falling wedge for a small profit, it can also break out every moment. I think we've got the correction/monday dip for today, so we can start the real bull run from tomorow on.
