Continuation
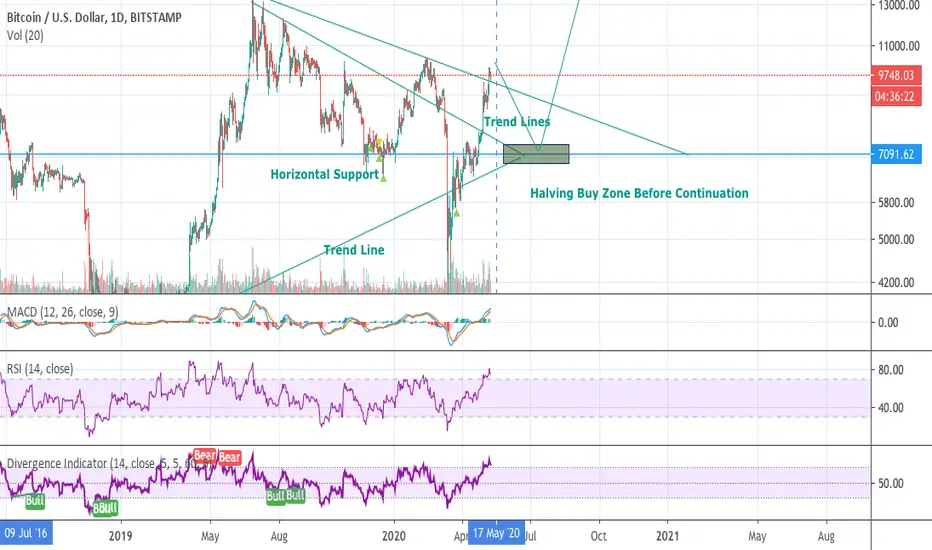
HALVING PULLBACK AND BUY ZONE BEFORE CONTINUATION This is what I'm using as a buy zone as we approach BTC's Halving. Exciting times ahead.
Who knows?
Good luck.
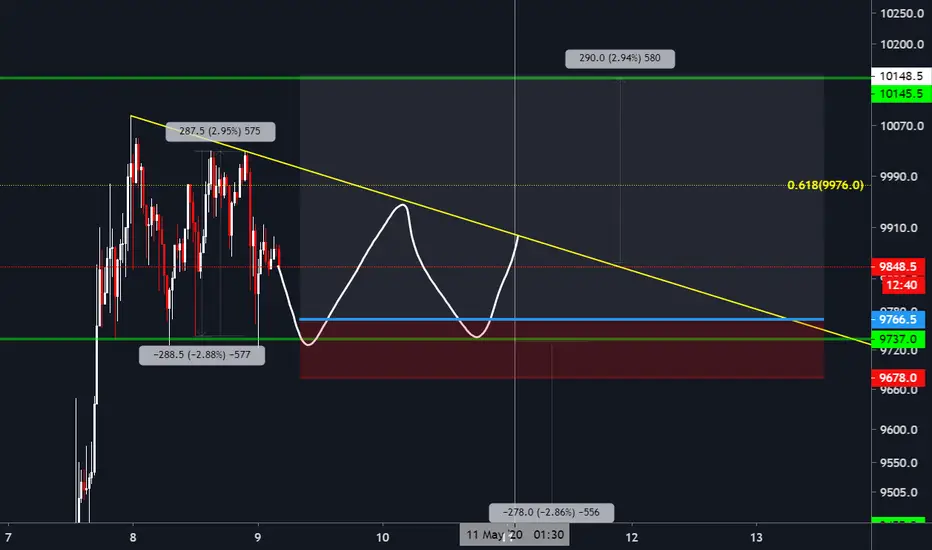
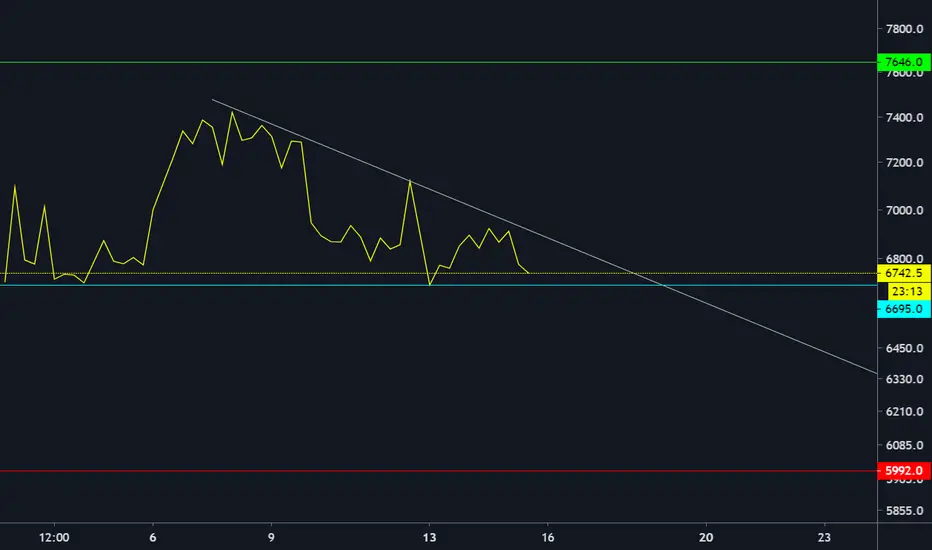
#BTC - Triangle - Hedge long for ongoing short expecting sideways market for the next 2 days, maybe on last day before halving we might see some fireworks
i was expecting a deeper retrace to 94xx to long but we are forming a descending triangle after the big move up, so simple rule long at support short at resistance once we break on either side just HODLLLLL!!!!
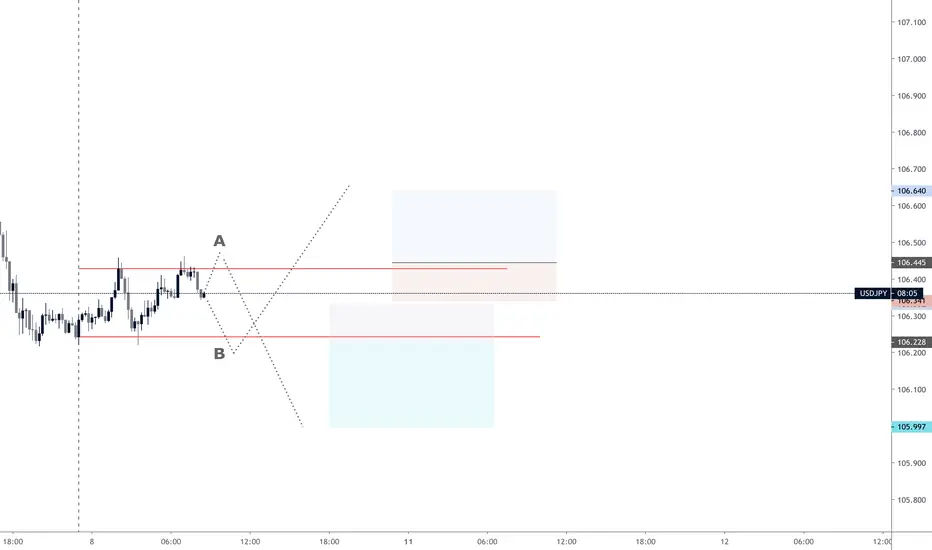
A or B? $USDJPY StopHunt after London Open Reversal BreakoutAim looking for the Touch to the Asian Low with an reversal after the London Open. The Entry could be on the other side of the Channel as there is still a possibility for another reversal on the Asia High
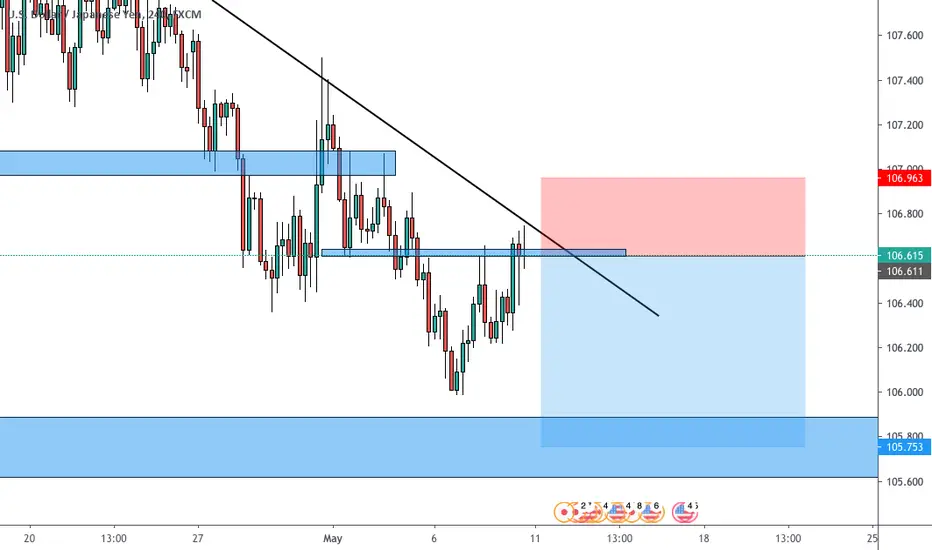
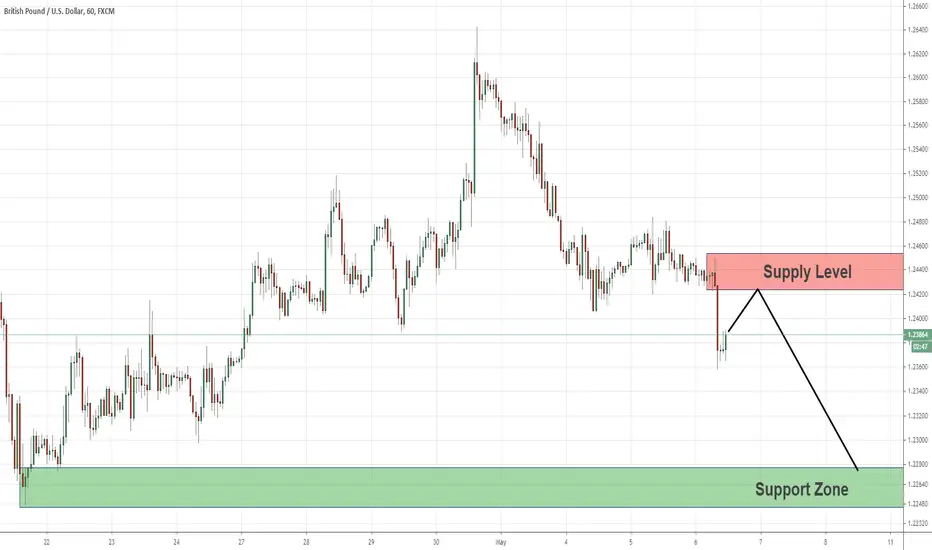
Great continuation level for sell positionAs we can see the GBP/USD created a new supply above.
The current momentum is bearish and therefore this supply seems like a great level for sell position as a continuation trade.
The target will be the support at the bottom.
UPDATE: USDCAD CONTINUE DOWNWARD As expected TP1 hit already. Price to continue downward till TP 2 @1.4005

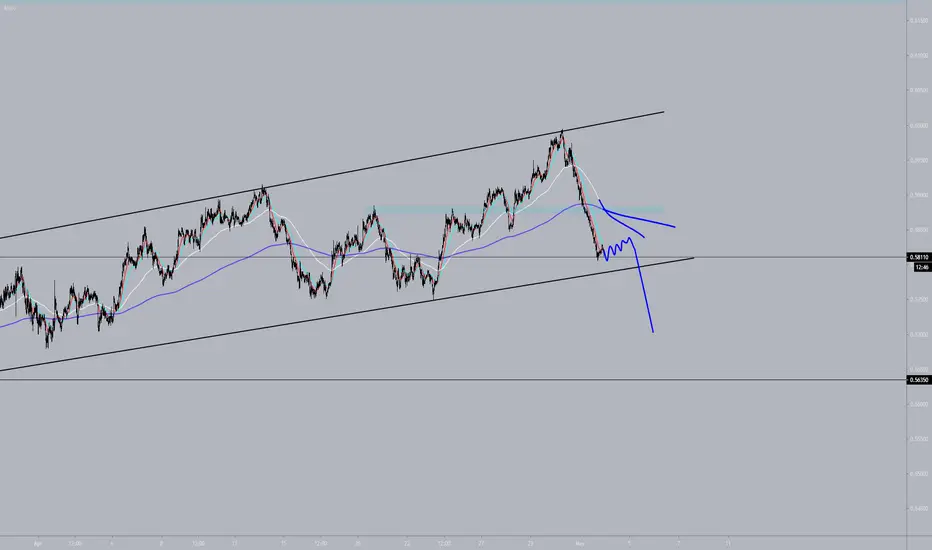
USDCAD two possible ScenariosUSDCAD H4 - TWO POSSIBLE SCENARIOS
this pair is trading inside this green channel, so we are overall bearish here.
price is now sitting around the upper green trendline and orange resistance, so we may expect a downward movement from here
unless price breaks above the orange level 1.4200 upward aggressively, then an upward movement till around 1.4650 would be expected
as mentioned, for now, this pair is overall bearish (going downward), in this case, the first main rejection area is the lower green trendline and blue level 1.380
if price breaks below the blue level 1.3800, then a downward movement till around 1.3500 would be expected

NZDCHF SHORT-continuation pattern back to the 200EMA
-Rejection candles needed to execute this trade
Follow my Instagram @_Selfmademo
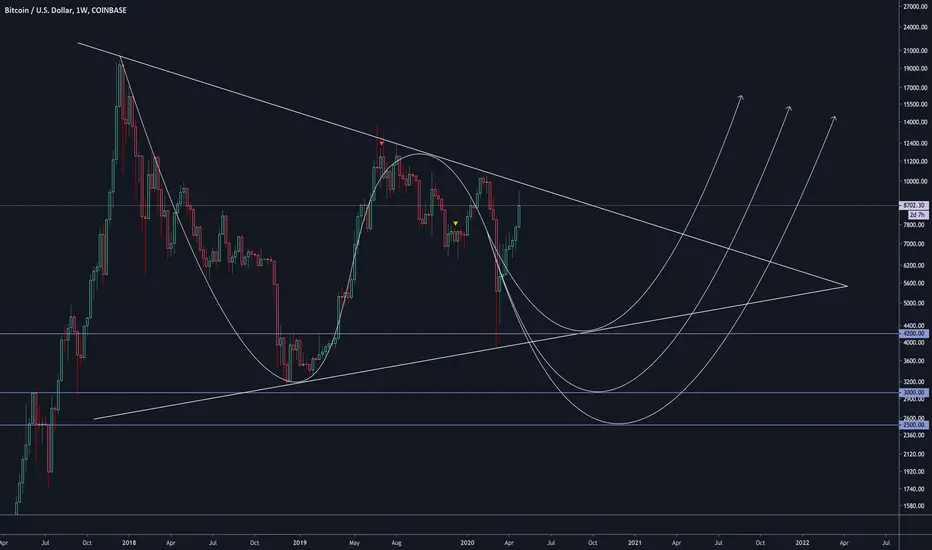
MOVING UP AND DOWN, SIDE TO SIDE LIKE A ROLLERCOASTERExtension Of Previous Idea - Titled: "IT'S NOT OVER YET | THE FASTER WE RISE, THE HARDER WE FALL"

IT'S NOT OVER YET | THE FASTER WE RISE, THE HARDER WE FALLI am not confident this is the end.
In the history of Bitcoin's existence, the faster we rose, the harder we fell. Vast acceleration always resulted in a large correction. We rose up too fast... yet again. Thus, I believe a large correction is due... yet again. Now I understand this pattern breaks eventually and we progress into a bull market, a long, multi-month, sideways bottoming pattern forms. I have yet to see anything of the likes. So why is this scenario any different?
Historical Rapid Acceleration
It seems like nothing has changed... yet again.
VERDICT: Until we actually form a bottoming pattern that is sustainable and reasonable, I can't be confident that price is ready to start the next journey to new highs.
Price action & Psychology - Resistance, consolid., continuationHello !
Key points :
Resistance broken on high volume and wide range candles
Consolidation phase and support hold
Huge price rejection on the hourly + high volume
Relative strength (compared to today's market conditions)
I've left some charting from the previous trade on this analysis, to get a context. On the previous analysis, we said that basically, what happens after an "ABCD" pattern, is that the "D" makes a new low (depending on what chart you're looking at it must not be an all-time low). So we're entering a new trend. As we know, stocks nearly always move in waves (higher highs, higher lows when uptrending, reverse for downtrending).
What happens here, is that the stock needs some room to "breathe" before resuming the trend. Some people are taking profits (like I did yesterday), others are joining the party, while others wait on the sidelines.
BUT , there's still a "healthy" balance between the different actors, otherwise, if the conviction was gone or there would have been enough sellers to absorb the buy orders, the stock would have reversed right away.
The 2 reasons for a stock price (or any other security) to go up (reverse for down)
Fundamentally, there are 2 reasons :
There are not enough sellers to absorb buy orders (buyers > sellers)
Traders/investors think that the stock is cheap (they have the belief that the stock will go up in the future, i.e. the conviction)
***Disclaimer : This is not an advice to buy the stock. Please, be aware that trading is a matter of probabilities, it takes only ONE trader to deny your trade.***
Thanks for reading and if you have suggestions or wanna discuss the idea, just leave a comment, I'll be happy to answer.

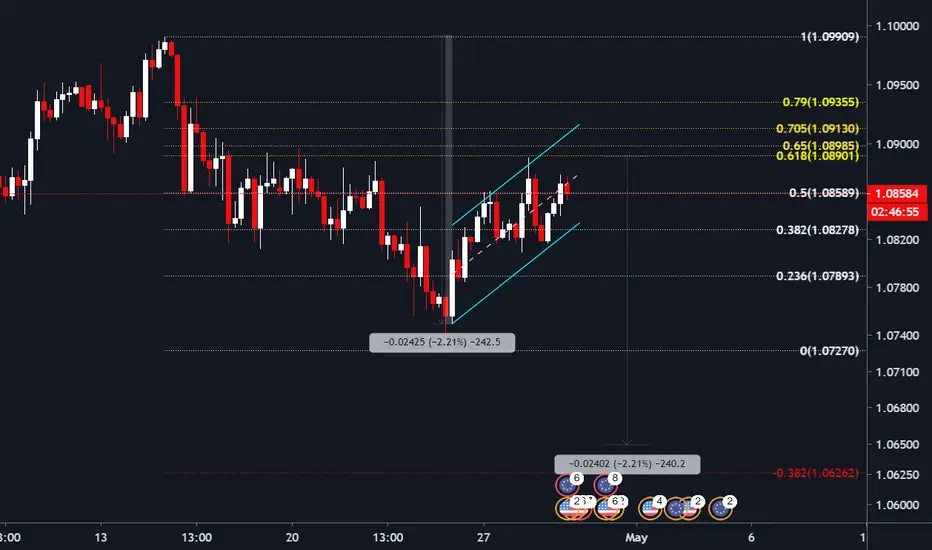
EUR/GBP REVERSAL | INVERTED H&S / DOUBLE BOTTOMNOTE: The following extends my earlier post on EUR/GBP. Please refer to it in addition to this post; attached below as a related idea.
Inverted H&S - Right Shoulder Forming
Double Bottom Still Holding As The Local Low
Targeting The 61.8% Fibonacci Retracement Level
Macro-Economic Analysis - Further Downside Expected, Thus A Rise In EUR/GBP
VERDICT: Cycle low is in and forecasting movement to the upside. Targeting the 61.8% retracement level.

#EURUSD - Possible Bearflag as wellPrice rejected at .618
the trend is bearish looks like we will continue if H&S idea works out
then I will just keep moving my stops for the bear flag targets
#DYOR

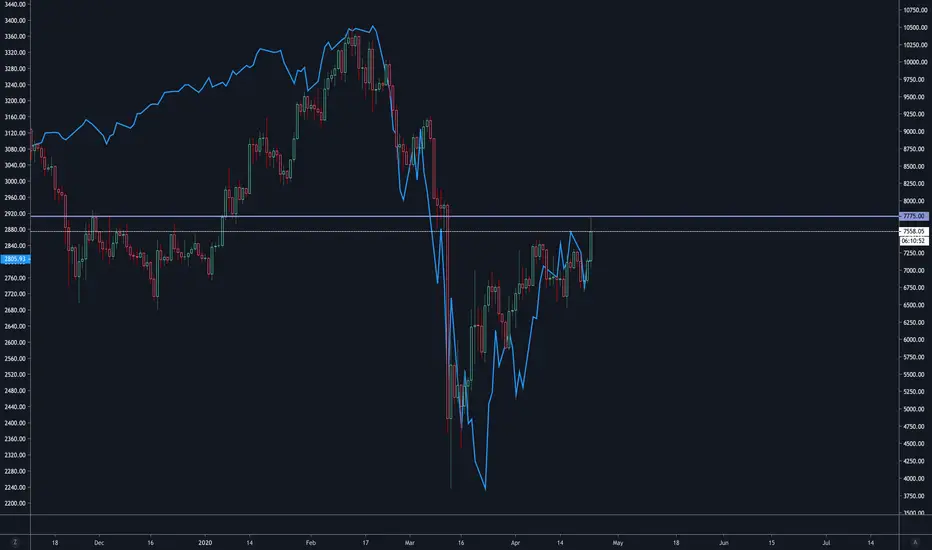
BITCOIN & SP500 | THE SIMILARITY IS PRECEDENTED | NOT A HEDGE.No unnecessary words needed. The chart speaks volumes.
Bitcoin has never experienced a recession let alone a pandemic.
Bitcoin will follow and mimic the global economy so long as economic implications exist.
Main indicator for investing in Bitcoin should be the SP500, or any other equity index.
This isn't a bull market. This is a bull trap correction.
VERDICT: Bitcoin is not a hedge and will follow the broader markets until this recession/pandemic is over. Just ask yourself... why would bitcoin act differently?
USDCAD continuation bullishyes, we have huge wick on the monthly TF, but it couldn't penetrate the Daily demand zone. based on that we could say the bull still in charge. on 1H there is a huge movement and nice demand zone. but we decide to cover the pivot to minimize the risk getting stopped out. because it is possible the price could break the previous support. you could set the second target with trailing stop loss
drop a comment below what your thought about this

Rising wedge trend continuation USDCAD Do your own analysis ...
Dont Forget Moving StopLoss At Breakeven
Disclaimer!
This post does not provide financial advice. It is for educational purposes only! You can use the information from the post to make your own trading plan for the market. You must do your own research and use it as the priority. Trading is risky, and it is not suitable for everyone. Only you can be responsible for your trading.

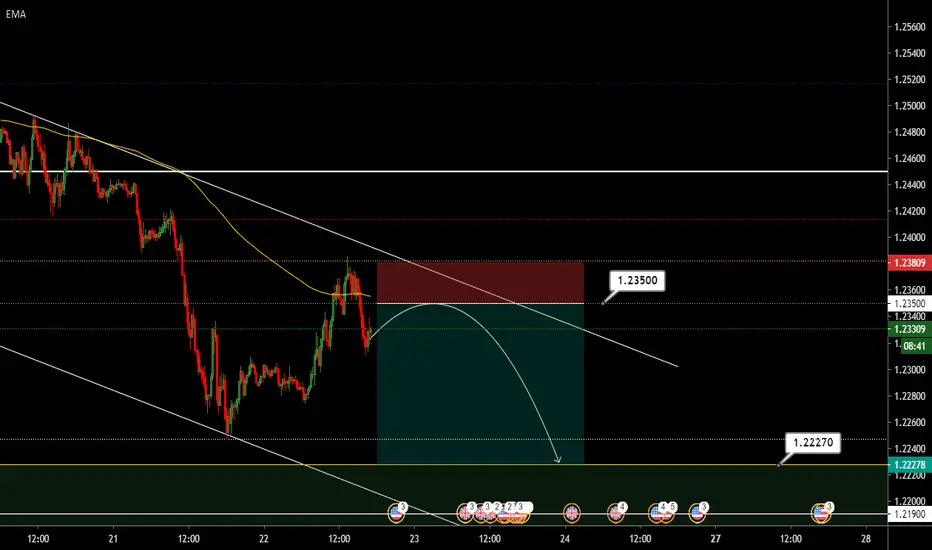
GBPUSD sell idea ***GOOD RISK TO REWARD RATIO***We find GBPUSD in a 4 hourly bearish channel.
Following an exhaustion to the up side, we will be looking to jump onto sells as we see upward momentum being lost on the 1h timeframe.
Sells will be entered upon retest and denial of the 38.2% fib level as shown, where we could see a big push downwards to the 1.22270 price level.
We find this to be a high probability trade, with a RR of 3.95 and is very well worth entering.
Remember to trade responsibly and with appropriate risk management.
Happy trading!
Great Supply Levels to sell the SPX IndexAs we can see on the daily chart, the SPX500 has a great recovery after the massive drop a few weeks ago.
The price now getting close to supply - 1 that is a great level to sell SPX500.
If the price will breakout this supply toward up I'll close this position and I'll open a new sell position if the price reach to supply -2.
Both options are relevant for swing or long term traders.

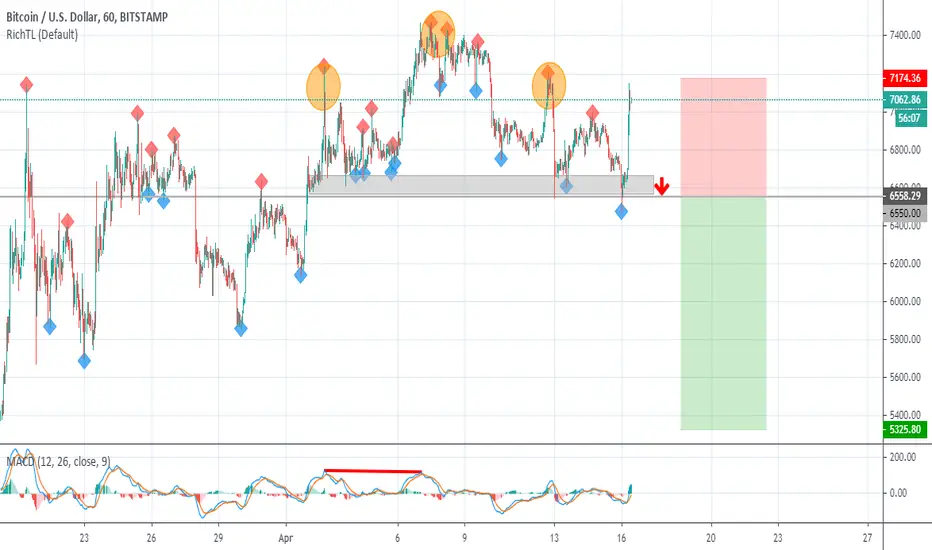
BTCUSD Potential Bearish MovementBTCUSD Potential Bearish Movement
we are waiting for a momentum candle close below 6550.0 to sell this one
Reason:
1- Regular Bearish Divergence on MACD (in red)
2- Objective Head and Shoulders (in orange)
3- Supply zone from Daily
Three confluences are enough to consider Selling BTCUSD, after a break below 6550.0 (in gray)
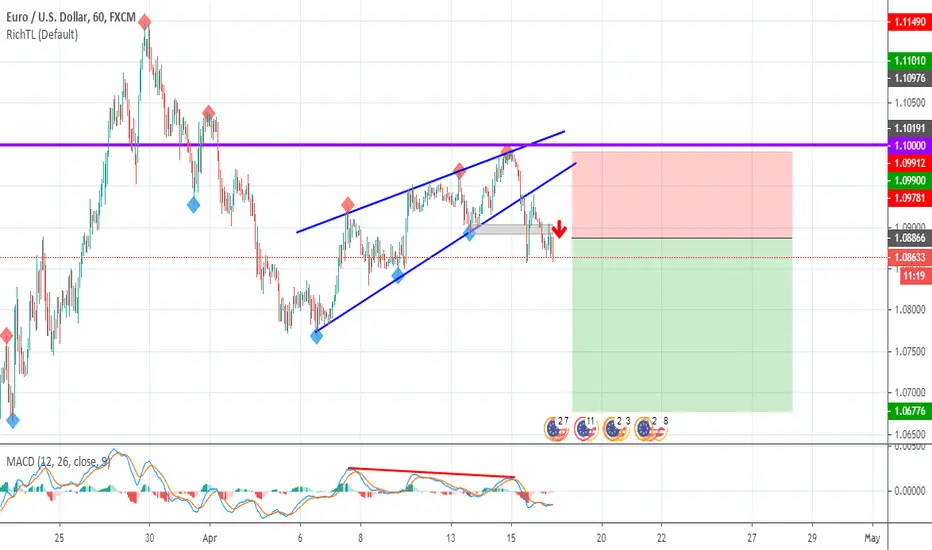
EURUSD Potential Bearish MovementEURUSD Potential Bearish Movement
Three confluences are enough to sell EURUSD
Reason:
1- Regular Bearish Divergence on MACD (in red)
2- Objective Wedge Pattern (in blue)
3- Resistance Round Number 1.100 (in purple)
#Bitcoin Triangleshorts are running from 69xx & higher 73xx
waiting to enter hedge long at the support
keeping an eye on this triangle targets if broken either side
GLOBAL EQUITIES BULL TRAP | FURTHER DOWNSIDE EXPECTED
Often in downside and upside moves of large magnitude, a phase is present where a large correction occurs.
This is known as a Bear or Bull trap, respectively.
It is reasonable to say that we could be in a bull trap right now with stocks up by almost 30%
An average market cycle high to low has been in the region of 50-60%. This would bring price to strong support and a reasonable area for a rebound (Buy Zone)
This assumes that this downside cycle will be of the same level or worse than the previous downside cycles.
The reason for such an expectation is due to the extremity of Covid-19 in terms of unemployment, trade, demand shock and other macro-economic metrics/indicators.
Also the fact that the pandemic indicates a more longer/severe cycle due to the nature of the event being so complex and impactful.
VERDICT: Signs of a bull trap are becoming increasingly more noticeable and this, along with the extremity of Covid-19, indicates that the crash is expected to continue further.
