Copper is facing bullish pressure, potential for further upsideCopper prices are facing bullish pressure from our first support, where we could see further upside above this level. Stochastic is showing signs of bullish pressure as well, in line with our bullish bias.
Copper
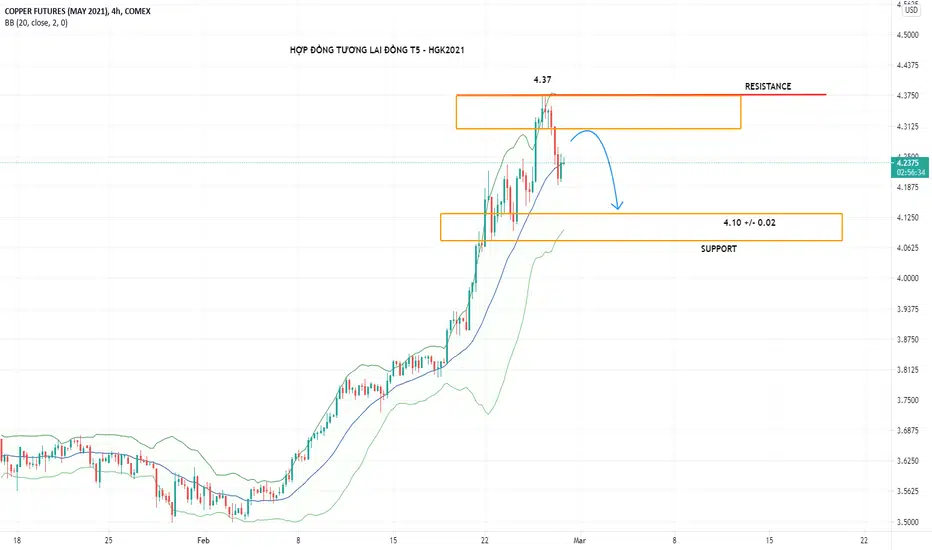
June 2021 - CopperCopper - Correction Ahead
1. Fundamental Analysis
- US Housing Data was quite disappointing.
- Equity market decline & the fear of rising US interest rates.
- In addition, I think copper market is waiting for news which comes from US ( US government's plan for boosting produce electric vehicles) and China (confirmation about speculative buying and demand through readings of Shanghai copper warehouse stocks).
2. Technical Analysis
- This market seems overbought, and there's a sign that people are taking profit.
- Currently, i think copper contracts are moving in a range | sideway (4.08 - 4.37).
- Intraday, prices can climb higher and reach a zone (4.30 - 4.33). It could be a good opportunity for sell to probe the strength of the market)
COPPER (31 MAR 21) BUY NEAR 717.60 SL 713 UPSIDE 728MCX Copper (31 Mar 21) will move upside from the current market price 717.60-718 with SL 713 and upside TGT will bear 722/725/728
MCX:COPPER1!

US Equity Market could bottom out soonTLT
From a post view to analyze the market these days, "everybody" knows from the media that the reason is "fear of hyperinflation"
But how much inflation is high enough and when does this correction ends?
jump into my conclusion : the correction is ending soon.
Why?
there are 5 reasons to look for :
1 correction was triggered by diving T-note, looking at TLT, since the broke out from a 2B at early Feb, it accelerated, but approaching pre-pandenmic level.
2 raw material price on the massive run since last year, Copper and Crude oil had their times, but is approaching previous resistance
3 looking at nasdaq, 2Hr and 4Hr had made new lows but with MACD divergence
4 catalyst could be the freezing weather that send crude to the sky and the priced in stim bill, with dead line approaching, there still a big uncertainty in this, so could triggers some risk aversion
5 Nasdaq is approaching 12/18 quad witching support

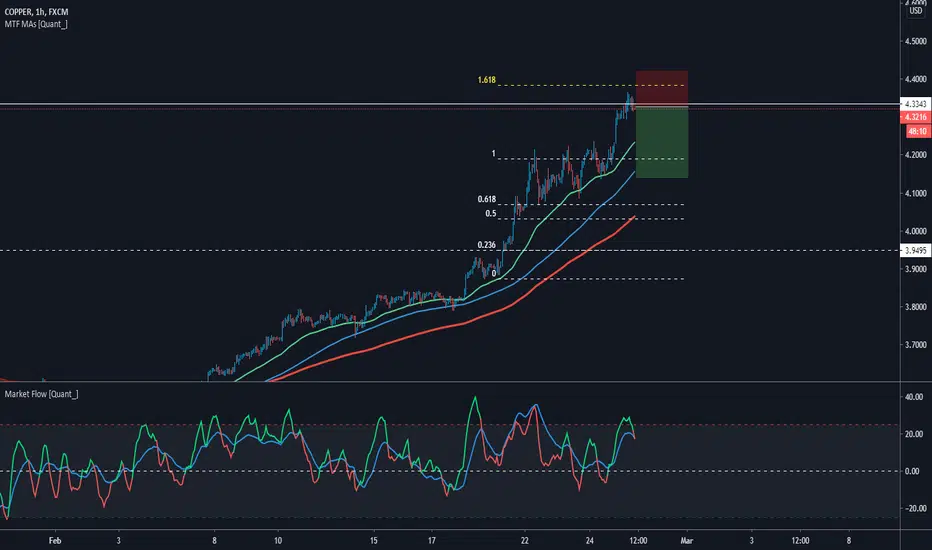
Copper Short SetupCopper Short Setup
🔵 Entry: $4.327
🟢 TP & RR: $4.140 (2.02)
⛔ Stop Loss: $4.420
Trade Reasons:
✔️ 1.618 Fib Level Extension
✔️Market Flow overbought level
📝 Fairly basic setup, trying to capitilize on a potential pullback.
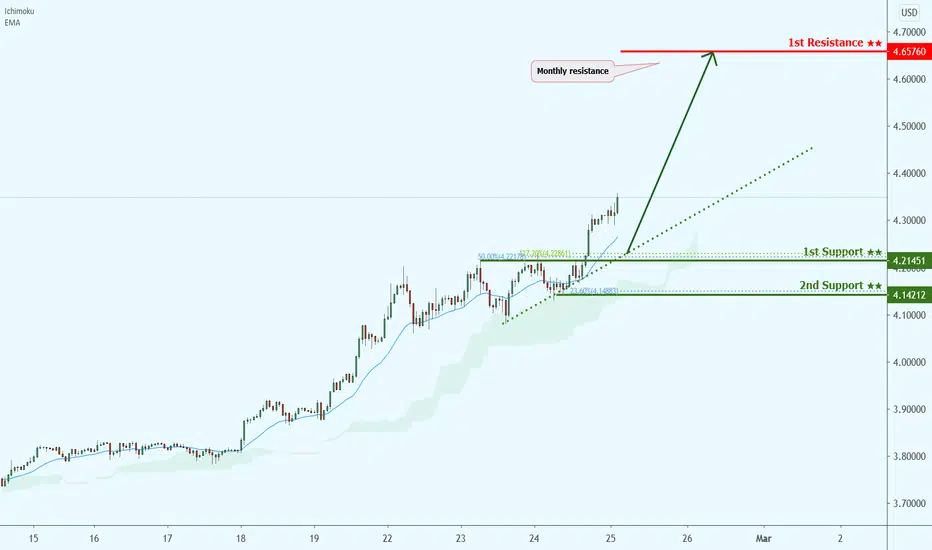
Copper is facing bullish pressure, potential for further upsideCopper prices are facing bullish pressure from our first support, where we could see further upside above this level. Ichimoku cloud and EMA are showing signs of bullish pressure as well, in line with our bullish bias.
Ready for the Magic Show?Ready for the Magic Show?
Start 0,195 CAD
Chart painting from the early 21st century, artist Maxi Scalibusa. No investment advice or a recommendation to buy or sell any securities. This is entertainment broadcast by an autistic person.

Copper is facing bullish pressure, potential for further upside
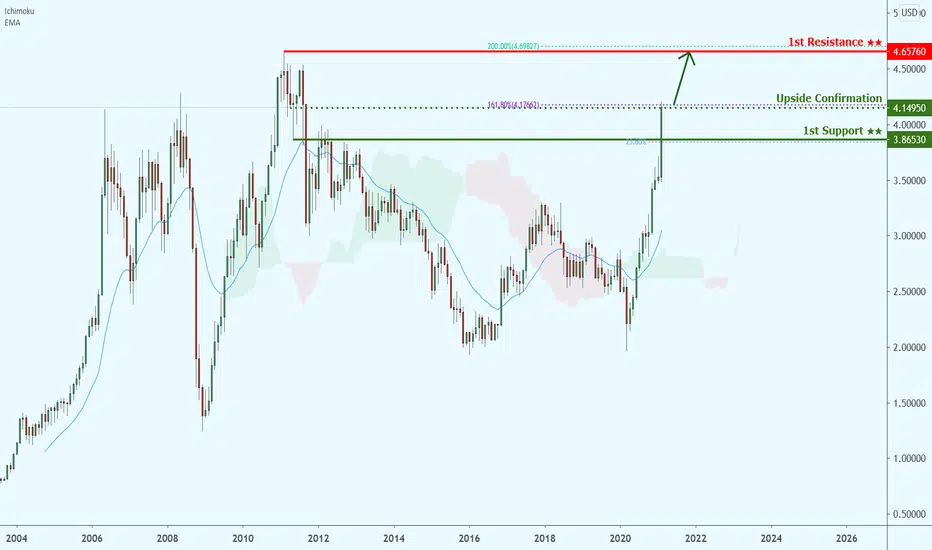
Copper broke our upside confirmation previously. Currently, price is facing bullish pressure from our first support, in line with our graphical level, where we could see further upside above this level. Ichimoku cloud is showing signs of bullish pressure as well, in line with our bullish bias.
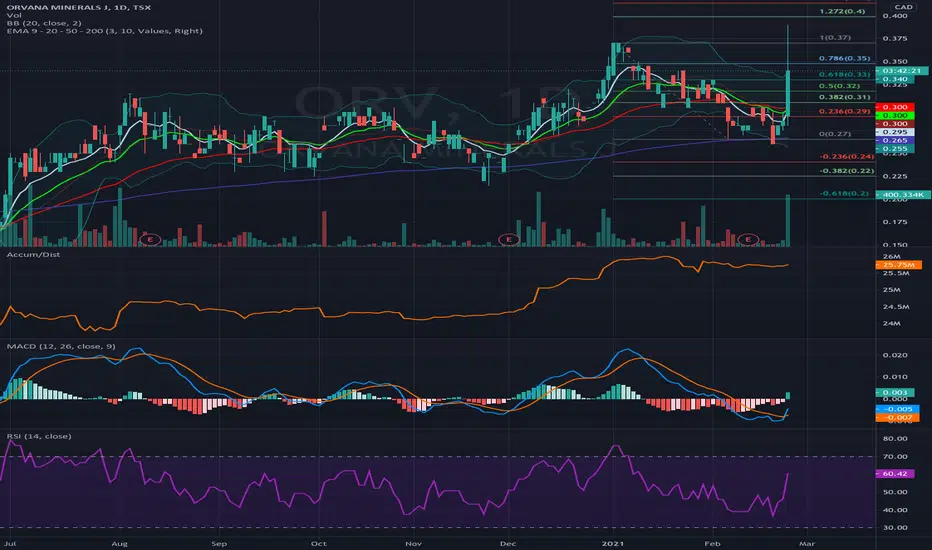
ORV.TO - Copper/Silver/Gold producer trading at 0.4x revenuePossibly one of the most undervalued copper/silver/gold producers on the planet trading at $49M mkt cap wit $102M in yearly revenues. $15M in cash. Favourable macro. Breakout chart with Bullish MACD cross sending a technical buy signal.
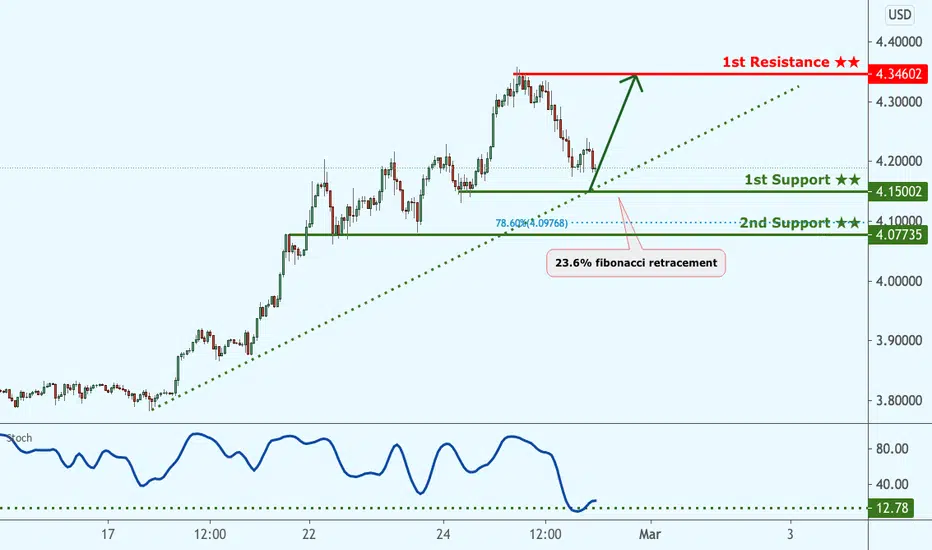
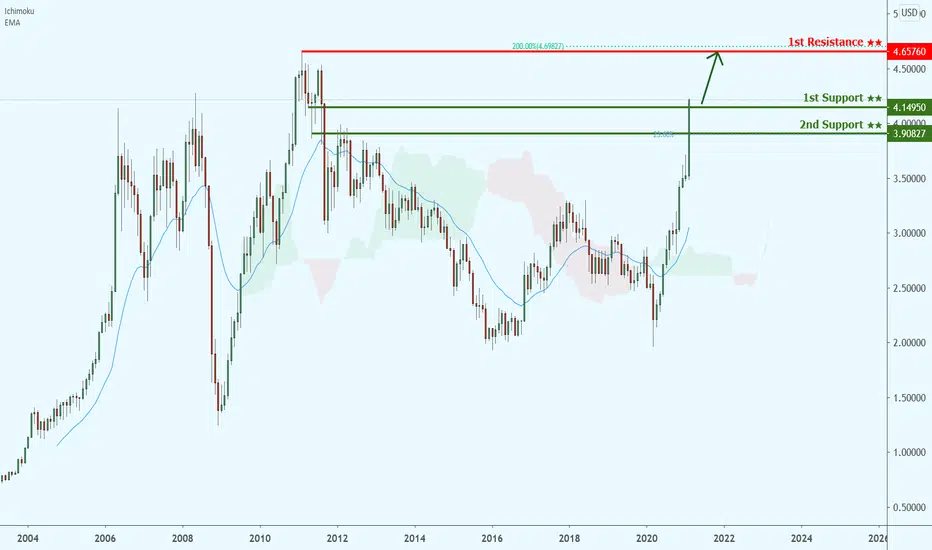
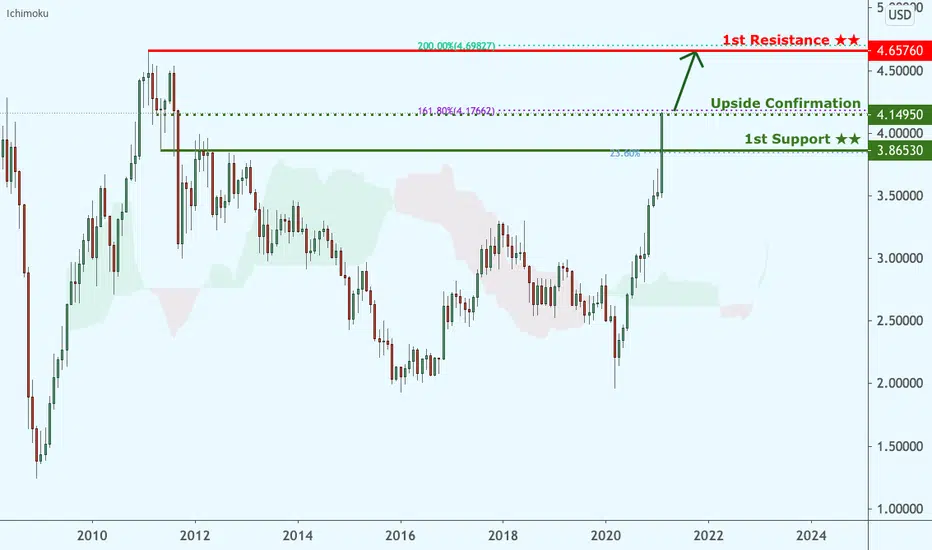
Copper is facing bullish pressure, potential for further upsideCopper bounced nicely from our support level to hit our resistance target previously. Price is facing bullish pressure from our first support, in line with our horizontal overlap support, 23.6% fibonacci retracement where we could see a further upside above this level. A break above our upside confirmation level could provide the bullish acceleration to our first resistance target. Ichimoku cloud is showing signs of bullish pressure as well, in line with our bullish bias.
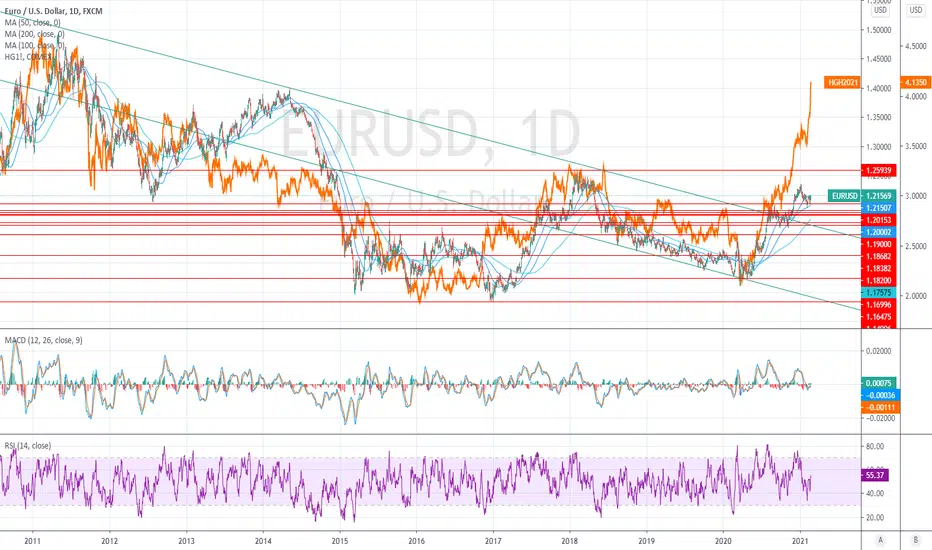
EURUSD vs Copper - Something does not add upWhich one is right?
EURUSD or Copper?
They usually follow along but now it seems that they deviated. Which one is right?
If Copper is right then inflation will crush USD soon. If USD is right then it could be due to rising yields on US treasuries. What do you think?
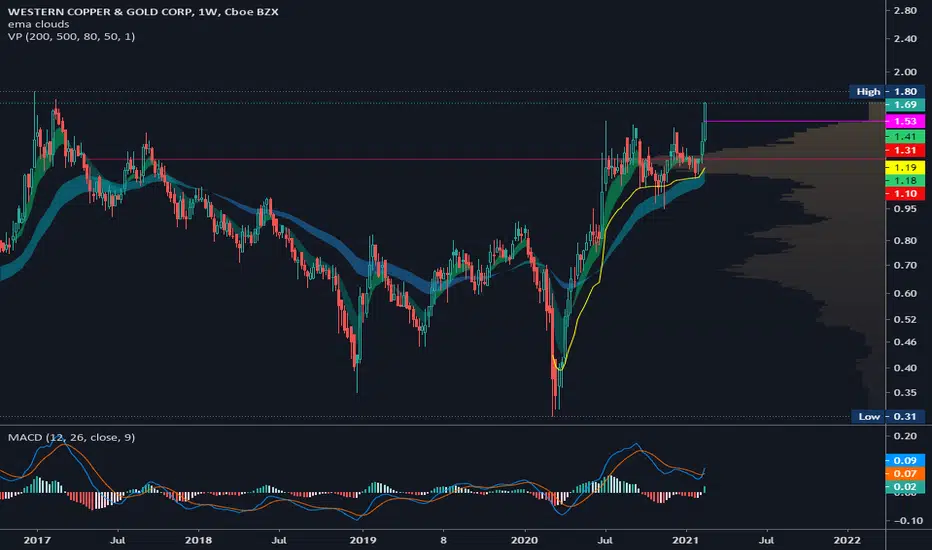
$WRN Long copperGreat setup to break above highs set back in 2017. Great volume profile on this one that should work as a launch pad. Considering incoming inflation in the future, it's a decent way to diversify. I like an entry if it back-tests the purple line and if it holds March's lows anchored VWAP.

Copper is facing bullish pressure, potential for further upsideCopper bounced nicely from our support level to hit our resistance target previously. Price is facing bullish pressure from our first support, in line with our horizontal overlap support, 23.6% fibonacci retracement where we could see a further upside above this level. A break above our upside confirmation level could provide the bullish acceleration to our first resistance target. Ichimoku cloud is showing signs of bullish pressure as well, in line with our bullish bias.
Copper futures at 9 year highs, FCX SCCO HBMCopper futures at 9 year highs and all time high is around $4.65, FCX is the world's largest publicly traded copper producer. It is following the price of commodity. Demand for copper from renewable sector is growing as new power generation capacity addition renewable energy (China/India).
Options - The March 19 $38 calls traded over 11000 times, over 34,000 in Open interest. The march put call ratio is .46.
April options put call ratio - .76, probably a pull back at some point after strong move friday.

COPPER (XCU/USD) – Week 7 –Bulls getting stronger.Last week, Copper was fast paced and broke out of the consolidation area, as Chinese markets closed for the week-long Lunar New Year holiday after four days of rapid gains that boosted the price to a new eight year high.
For this week we are expecting a small corrective move that will ultimately act as a bullish trigger that would push the price higher in the near future.
Trade with care.
Best regards,
Financial Flagship
Disclaimer: The analysis provided is purely informative and it should not be used as financial advice. Remember that you need a plan before you start trading; so, take this knowledge and use it as a guidebook that will ultimately help you understand the market and easily predict your next move.

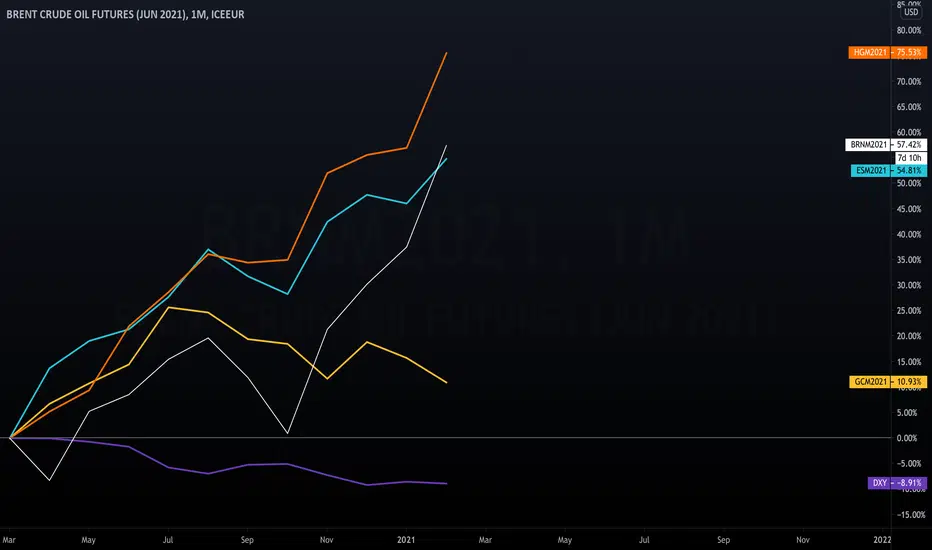
Comparing Different Asset ClassesThe above chart illustrates the performance of different asset classes in % change from Mar'20 low .
The list of included assets is as follows:
Copper
Gold
ES
Brent
DXY
For the futures markets, the Jun'21 contracts are used; for DXY, the ICEUS index is used.
As seen in the chart, the best performing commodity is copper, the rise in copper prices is led by firm demand, especially from China. The oil market comes in second here, with an increase of almost 60%, oil price is now entering overbought territory, though there is still some room for further upside. The S&P500 comes in third here with an increase of almost 55% from the Mar'20 low. Many traders are still looking to get more upside exposure here; nonetheless, the risk of sudden price plunge is elevated at these levels. With regard to gold — the safe-haven asset which usually outperforms all other asset classes during financial turmoils — its performance hasn't been anything close to spectacular. The reason for lack of performance by gold is BTC and silver, both of which showed outstanding resilience to overall market conditions. Our loser of the year is DXY, which has lost almost 10% of its value since the Mar'20 low.
Talking of BTC, I did not include BTCUSD in the chart as the chart gets destroyed by it, I am attaching it here separately for ease of reference and to show how BTC is turning the financial world upside down.
Copper is facing bullish pressure, potential for further upside Copper bounced nicely from our support level to hit our resistance target previously. Price is facing bullish pressure from our intermediate support, in line with our horizontal swing low support, 38.2% fibonacci retracement where we could see a further upside above this level. Ichimoku cloud is showing signs of bullish pressure as well, in line with our bullish bias.

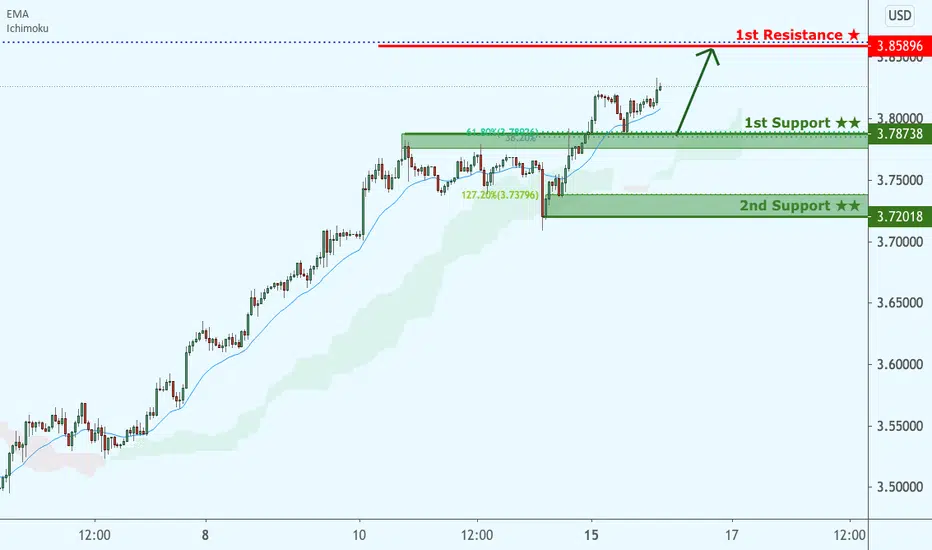
Copper is facing bullish pressure, potential for further upside Copper bounced nicely from our support level to hit our resistance target previously. Price is facing bullish pressure from our first support, in line with our horizontal pullback support, 23.6% fibonacci retracement and 61.8% fibonacci extension where we could see a further upside above this level. Ichimoku cloud and 20 EMA are showing signs of bullish pressure as well, in line with our bullish bias.
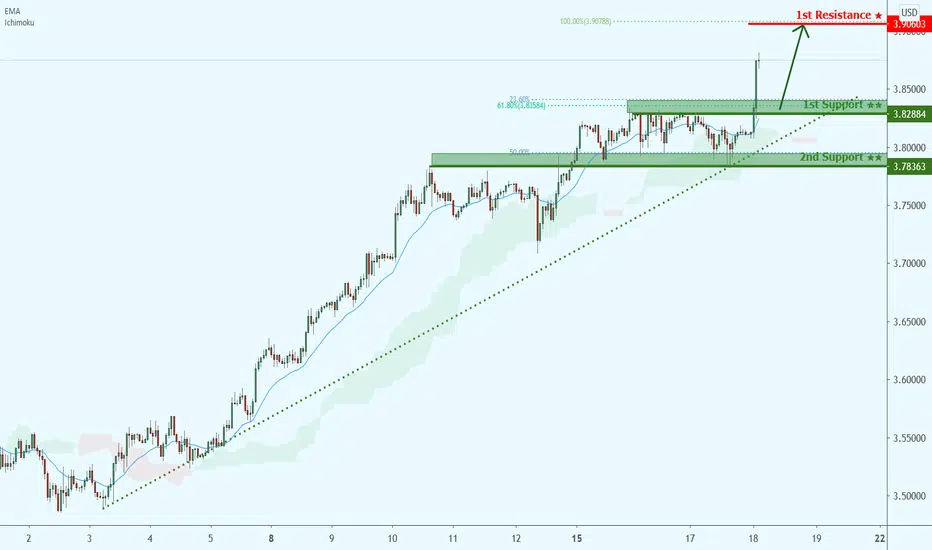
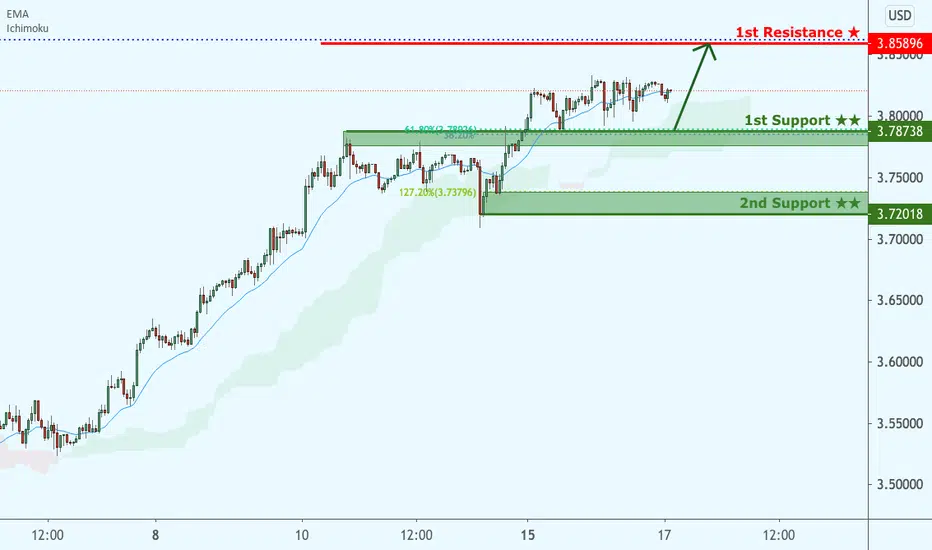
Copper prices could see further upsidePrice is facing bullish pressure from our first support, in line with our horizontal overlap support, 61.8% fibonacci retracement where we could see a further upside above this level. Ichimoku cloud and 20 EMA are showing signs of bullish pressure as well.
EMX is a good play for copperUsing the Jake Bernstein MAC method, you could have bought at the bottom of the channel today and sold at the top of the channel. EMX Royalty is a nice way to play the bullish copper market. This plot is using the Rob Hoffman MSR and stochastic spike indicators. The latest stochastic spike suggests a pullback tomorrow and one could buy below the support of the channel.

CCW.V Acquires 39,200 Hectares of EV Properties in ON and QCCCW has acquired nickel and copper properties to add to its flagship Cobalt, ON property that has been delivering bonanza silver and cobalt intercepts. Bullish Engulfing candle and pickup in accumulation make for a nice chart setup.
---
COQUITLAM, BC, Feb. 16, 2021 /CNW/ - Canada Silver Cobalt Works Inc. (TSXV: CCW) (OTC: CCWOF) (Frankfurt: 4T9B) (the "Company" or "Canada Silver Cobalt") is pleased to announce the acquisition of 39,200 hectares of EV properties in Quebec and Ontario. It is Canada Silver Cobalt's intention to transfer the properties, in exchange for shares, to another public company to be identified by the Company, in order to capitalize on the current EV market, and to distribute the shares by way of dividend to Canada Silver Cobalt's shareholders.
These properties have a strong potential to host a variety of base metals including nickel, copper and cobalt. This strategic move is for structural organization purposes to add to our current cobalt mineralization discoveries in the Cobalt Camp and as an expedient approach to the increasing demand for EV battery input materials. Canada Silver Cobalt's main focus will remain on its High-Grade silver discovery at the Robinson Zone with drill core silver grades of 89,000 grams per tonne (January 29, 2021 CCW Press release).

Copper prices is facing bullish pressure Price is facing bullish pressure from our first support, in line with our horizontal overlap support, 61.8% fibonacci retracement where we could see a further upside above this level. Ichimoku cloud and 20 EMA are showing signs of bullish pressure as well.