Corn: Continued Long Liquidation Corn
Commitments of Traders Update: Friday’s CoT report showed Managed Money were net sellers of 36,649 futures/options contracts through June 28th. This was all long liquidation, 38,185 contracts, with a tiny bit of short covering. This shrinks their net long position to 228,612 futures/options.
Seasonal Trends in Play: Short September corn from 6/13-7/27. This has been profitable for 13 of the last 15 years with the average gain being roughly 33 cents, or $1,650 per one 5,000-bushel contract.
Fundamentals: Scattered showers over the weekend have many traders looking for a lower open in the corn market. Stone X (one of the multiple FCM’s we use) raised their Brazilian crop estimate to 119.3mmt, up from 116.8mmt.
Technicals: Corn futures broke lower on Thursday, trading to the 200-day moving average. On Friday, that gave way. If the Bulls fail to reclaim ground above 630, we could see the long liquidation continues. The RSI has not showed signs of being this oversold since the spring of 2020. If the Bulls can climb back above that pocket, we could see a retracement of the breakdown from Thursday, closer to 645-652 ½.
Bias: Neutral/Bearish
Previous Session Bias: Neutral/Bearish
Resistance: 645-652 ½****, 678 ¼-684 ½**, 697-701****
Pivot: 624-630
Support: 586-589 ¼****, 574 ¼-579 ¼***
Futures trading involves substantial risk of loss and may not be suitable for all investors. Trading advice is based on information taken from trade and statistical services and other sources Blue Line Futures, LLC believes are reliable. We do not guarantee that such information is accurate or complete and it should not be relied upon as such. Trading advice reflects our good faith judgment at a specific time and is subject to change without notice. There is no guarantee that the advice we give will result in profitable trades. All trading decisions will be made by the account holder. Past performance is not necessarily indicative of future results.
CORN

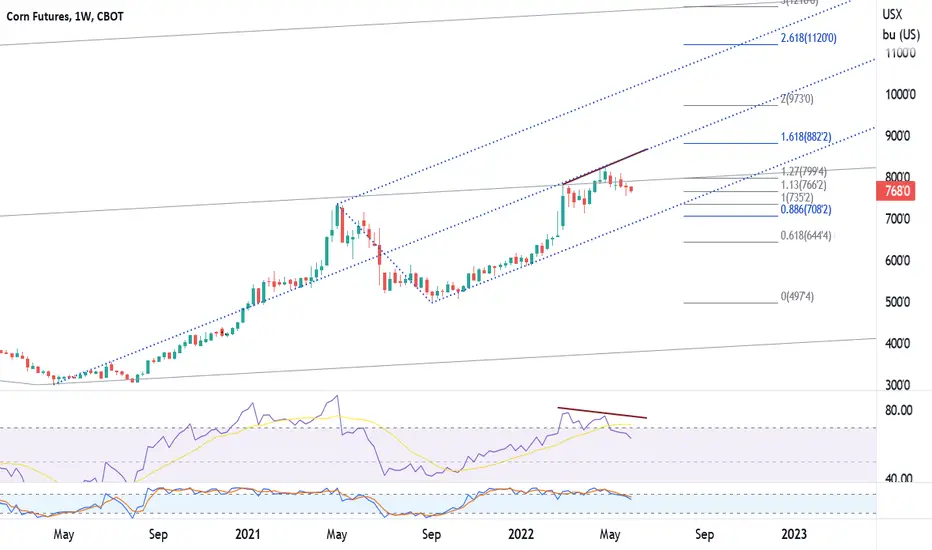
Continuous Corn - WeeklyContinuous Corn - Weekly: **The big red bar down this week is a bit exaggerated as this chart has rolled to chart against the Sep with a 1.20+ inverse. Nonetheless, corn is still down .50 +/- for the week. The 6.16 low hit the trendline, time will tell if this holds. Should we see a bounce from here the first test will be at 7.05 to 7.20. Primary targeted area at 7.72 to 8.00. Extended potential above 8.24 at the 8.50 area. IMO, we will need the reality of production cuts to see new highs, not just a weather forecast.

Corn: Pitch forks at playContinuous Corn – Weekly: Up trending vs Down trending Pitchforks – Continued from 6/2/22…
Up until two weeks ago it appeared that cash corn was going to follow the green bars up with the up trending pitchfork. The July/Sep inverse was a big challenge and the move lower just killed the chance for the continuous chart to maintain upward momentum. Currently the Sep corn leading the continuous chart and is looking for support against the median line in the 6.00 to 6.08 area. If we can catch a bounce look for resistance against the lower level blue line up into the upper level red line. Retracements in the 7.00 to 7.50 area will match up against the pitchfork resistance zones.
Below the median line offers support around the 5.45 area

Corn Futures Test the 200 Day Moving AverageCorn
Seasonal Trends in Play: Short September corn from 6/13-7/27. This has been profitable for 13 of the last 15 years with the average gain being roughly 33 cents, or $1,650 per one 5,000-bushel contract.
Technicals (September): Yesterday’s USDA report was Neutral, but Neutral wasn’t enough to feed the Bull into the last trading day of the month/quarter, which triggered additional long liquidation on a break below support from 645-652 ½. That weakness carried into the overnight session and took prices a notch below our next support pocket, 624-630. The market is now the most oversold sense April of 2020. If the market is able to defend support, we could see a retracement of yesterday’s breakdown point, 645-652 ½, this will now act as significant resistance.
Bias: Neutral/Bearish
Previous Session Bias: Neutral/Bearish
Resistance: 645-652 ½****, 678 ¼-684 ½**, 697-701****
Support: 624-630****, 589 ¼***
Futures trading involves substantial risk of loss and may not be suitable for all investors. Trading advice is based on information taken from trade and statistical services and other sources Blue Line Futures, LLC believes are reliable. We do not guarantee that such information is accurate or complete and it should not be relied upon as such. Trading advice reflects our good faith judgment at a specific time and is subject to change without notice. There is no guarantee that the advice we give will result in profitable trades. All trading decisions will be made by the account holder. Past performance is not necessarily indicative of future results.

Corn Consolidates Ahead of USDA Report
Corn
Fundamentals: Corn futures have traded both sides of unchanged in the overnight and early morning session as prices consolidate ahead of end of month, end of quarter, and all-important USDA report. The range of estimates for acres comes in from 88.4-91.0 million. In March the USDA was at 89.5. The average estimate for US corn stocks as of June 1 is 4.345 billion bushels. In last year’s report we were at 4.111.
Technicals (September): Consolidation is the name of the game as we inch closer to the highly anticipated USDA report. With the market chopping around and not really going anywhere, many of our support and resistance levels remain unchanged. Resistance levels come in near 680ish and more significantly 700ish. The upper end would be a retracement of last week’s secondary breakdown point and represents the 100-day moving average, not to mention the psychological significance. On the support side, 645-652 ½ is the pocket the Bulls want to defend.
Bias: Neutral/Bearish
Previous Session Bias: Neutral/Bearish
Resistance: 678 ¼-684 ½**, 697-701****
Support: 645-652 ½****, 624-630****, 589 ¼***
Futures trading involves substantial risk of loss and may not be suitable for all investors. Trading advice is based on information taken from trade and statistical services and other sources Blue Line Futures, LLC believes are reliable. We do not guarantee that such information is accurate or complete and it should not be relied upon as such. Trading advice reflects our good faith judgment at a specific time and is subject to change without notice. There is no guarantee that the advice we give will result in profitable trades. All trading decisions will be made by the account holder. Past performance is not necessarily indicative of future results.

Can Corn Rally Ahead of the USDA Report?Corn
Seasonal Trends in Play: Short September corn from 6/13-7/27. This has been profitable for 13 of the last 15 years with the average gain being roughly 33 cents, or $1,650 per one 5,000-bushel contract.
Fundamentals: Yesterday’s crop progress showed deteriorating crop conditions (though still better than last year at this time) with good/excellent ratings at 67%, a 3% decline. This has led to overnight relief as we inch closer to Thursday’s USDA report which will cover planted acres and quarterly stocks. The range of estimates for acres comes in from 88.4-91.0 million. In March the USDA was at 89.5. The average estimate for US corn stocks as of June 1 is 4.345 billion bushels. In last years report we were at 4.111.
Technicals (September): The market dipped lower yesterday, taking out the Thursday lows but there wasn’t much follow through selling, which led to a rally off the lows into the afternoon. We would not be surprised to see the relief continue into Thursday’s USDA report, with resistance levels coming in near 680ish and more significantly 700ish. The upper end would be a retracement of last week’s secondary breakdown point and represents the 100-day moving average, not to mention the psychological significance.
Bias: Neutral/Bearish
Previous Session Bias: Neutral/Bearish
Resistance: 678 ¼-684 ½**, 697-701****
Pivot: 645-652 ½
Support: 624-630****, 589 ¼***
Futures trading involves substantial risk of loss and may not be suitable for all investors. Trading advice is based on information taken from trade and statistical services and other sources Blue Line Futures, LLC believes are reliable. We do not guarantee that such information is accurate or complete and it should not be relied upon as such. Trading advice reflects our good faith judgment at a specific time and is subject to change without notice. There is no guarantee that the advice we give will result in profitable trades. All trading decisions will be made by the account holder. Past performance is not necessarily indicative of future results.

Corn spreadsContinuous Charts: Top – Front month to next deferred month Spread Underneath is Front Month continuous
Rule 1: Carry spreads have limits, Inverse spreads have no limits…
In the past 25-30 years we have seen 6 very strong inverted markets. Each inverted market lasted between 3-6 months and often times carried a bullish market reaction. When the inverse disappears, usually the corn market loses it’s bullish strength… None of the above inverses lasted past September. So on one hand history is strong to say that Dec/March spreads should be safe to hold some carry. But on the other hand, inverses have no rules. Risk-Reward: Don’t look to be a hero on Dec/March spreads, waiting to pick up another .05 - .07 of carry may not be worth the risk when there seems to be potential for .20 to 1.00 inverses on the table.

WEAT Continues to Grind LowerWEAT continues to trend lower, alongside corn and soybean prices. Many of these charts have turned bearish as funds look to trim back some of their historically long positions. Weather will continue to be a key factor going forward, as of now, it looks favorable which may be adding to the pressure. July options expiration is tomorrow, a lot of open interest at 750 for corn and 16.00 for july beans.

Will Corn Stabilize Ahead of Options Expiration
Corn (July)
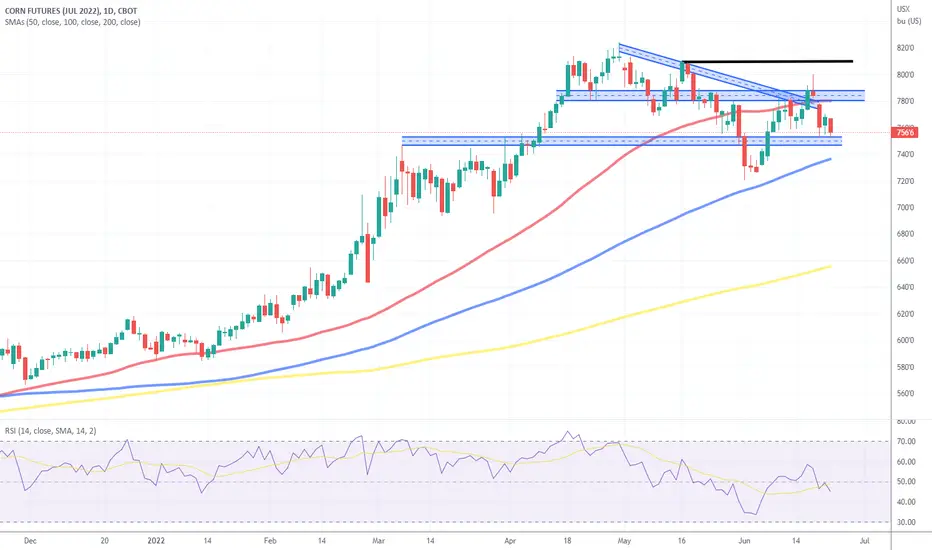
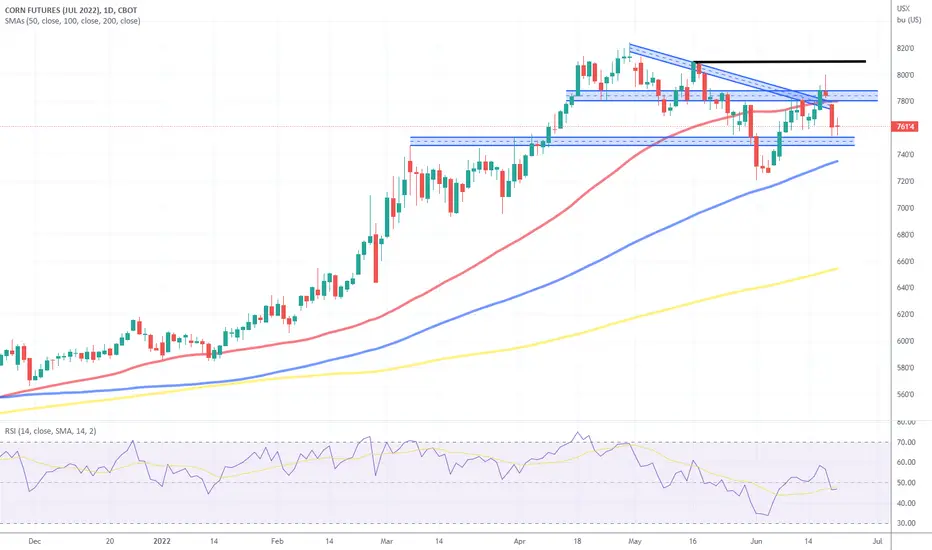
Technicals: July corn futures are weaker in the overnight/early morning trade. Though it looks ugly on the screen, we have not broken below our significant support pocket, 747-753. As mentioned from the start of the week, July options expiration may be the catalyst to help July corn futures stabilize into the end of the week. December corn….no that’s a different story. December futures have broken below the 100-day moving average and are trading at their lowest price since March 31st.
Bias: Neutral/Bearish
Previous Session Bias: Neutral/Bearish
Resistance: 800-803 ¾**, 809-810 ¼***
Pivot: 778 ¼-784 ½
Support: 747-753****, 720-726 ½****
Futures trading involves substantial risk of loss and may not be suitable for all investors. Trading advice is based on information taken from trade and statistical services and other sources Blue Line Futures, LLC believes are reliable. We do not guarantee that such information is accurate or complete and it should not be relied upon as such. Trading advice reflects our good faith judgment at a specific time and is subject to change without notice. There is no guarantee that the advice we give will result in profitable trades. All trading decisions will be made by the account holder. Past performance is not necessarily indicative of future results.
Corn Futures Test and Defend Significant Support Corn
Technicals: In yesterday’s morning report we wrote that the early morning weakness below the 50-day moving average (near 780), stating that it “opens the door for a potential retest of significant support from 747-753”. That support was tested and held to a T through the session and in the overnight/early morning trade. Now it’s up to the Bulls to defend it during the regular trading hours. One thing that might help is this week’s options expiration. There is a lot of open interest in the 750 strike, which may help the market consolidate, we talked about this in yesterday afternoon’s Tech Talk. Feel free to reach out with questions or to get these videos.
Bias: Neutral/Bearish
Previous Session Bias: Neutral/Bearish
Resistance: 800-803 ¾**, 809-810 ¼***
Pivot: 778 ¼-784 ½
Support: 747-753****, 720-726 ½****
Futures trading involves substantial risk of loss and may not be suitable for all investors. Trading advice is based on information taken from trade and statistical services and other sources Blue Line Futures, LLC believes are reliable. We do not guarantee that such information is accurate or complete and it should not be relied upon as such. Trading advice reflects our good faith judgment at a specific time and is subject to change without notice. There is no guarantee that the advice we give will result in profitable trades. All trading decisions will be made by the account holder. Past performance is not necessarily indicative of future results.
Corn Futures RetreatCorn
Commitments of Traders Update: Friday’s CoT report showed Managed Money were net buyers of 13,858 futures/options through June 14th. This expands their net long position to 278,185. Broken down that is 329,725 longs VS 51,540 shorts.
Technicals: Corn futures were sharply higher on Friday morning, but posted their high within the first minute of the “floor open”, which happened to be right at our first resistance point, 800. The rest of the day was steady selling, pressing prices into negative territory by the close. That weakness has spilled into the overnight and early morning trade, following a long weekend. The market has broken below the 50-day moving average which opens the door for a potential retest of significant support from 747-753
Bias: Neutral/Bearish
Previous Session Bias: Neutral/Bearish
Resistance: 800-803 ¾**, 809-810 ¼***
Pivot: 789 ½-790
Support: 747-753****, 720-726 ½****
Futures trading involves substantial risk of loss and may not be suitable for all investors. Trading advice is based on information taken from trade and statistical services and other sources Blue Line Futures, LLC believes are reliable. We do not guarantee that such information is accurate or complete and it should not be relied upon as such. Trading advice reflects our good faith judgment at a specific time and is subject to change without notice. There is no guarantee that the advice we give will result in profitable trades. All trading decisions will be made by the account holder. Past performance is not necessarily indicative of future results.

ZC CORN - Done Busted OutYeah, yeah, it can consolidate.
Knee-High by July.
Seems output is dropping, significantly.
Tortillas?
Corn Chips?
Fritos?
Yeah, all heading higher.

Corn futures - double top April 24thDouble top is a reasonable call for around April 24th 2023. Safer target of 826 in January is noted as there is always the possibility of a rapid decline afterwards, presenting the risk of investors selling earlier to avoid further risk.
Thrilling times in the world of corn.

Corn Tests Significant Resistance Corn
Seasonal Trends in Play: Short September corn from 6/13-7/27. This has been profitable for 13 of the last 15 years with the average gain being roughly 33 cents, or $1,650 per one 5,000-bushel contract.
Fundamentals: This morning’s weekly export sales report showed net sales of 140,900 MT for 2021/2022--a marketing-year low--were down 50 percent from the previous week and 45 percent from the prior 4-week average. Net sales of 138,900 MT were reported for 2022/2023
Technicals: Corn futures are marching higher in the early morning trade, taking prices back to the top end of the recent range. A breakout and close above here could spur another run back at and above the psychologically significant $8.00 marker.
Bias: Neutral/Bearish
Previous Session Bias: Neutral/Bearish
Resistance: 789 ½-790 ½**, 800-803 ¾**, 809-810 ¼***
Pivot: 776-778
Support: 769-773 ½**, 747-753****, 720-726 ½****
Futures trading involves substantial risk of loss and may not be suitable for all investors. Trading advice is based on information taken from trade and statistical services and other sources Blue Line Futures, LLC believes are reliable. We do not guarantee that such information is accurate or complete and it should not be relied upon as such. Trading advice reflects our good faith judgment at a specific time and is subject to change without notice. There is no guarantee that the advice we give will result in profitable trades. All trading decisions will be made by the account holder. Past performance is not necessarily indicative of future results.

CORNFinal Big move to the upside before a possible correction, Using Elliot wave methodology and other indicators a strong move to the upside to complete trade cycle is to be expected.

This Corn Seasonal is in PlayCorn
Seasonal Trends in Play: Short September corn from 6/13-7/27. This has been profitable for 13 of the last 15 years with the average gain being roughly 33 cents, or $1,650 per one 5,000-bushel contract.
Technicals: Corn futures were able to defend the previous day's low during yesterday's session but didn't do much to change the technical outlook. Our pivot pocket remains intact, that comes in from 769-773 1/2. trendline resistance and the 50-day moving average come in just above that, near 776-778. On the support side of things, 747-753 is the significant pocket and potential inflection point. If the Bulls fail to defend that pocket, we could see long liquidation take us back to the lows from two weeks ago, in the mid 720s.
Bias: Neutral/Bearish
Previous Session Bias: Neutral/Bearish
Resistance: 776-778*** 789 ½-790 ½**, 800-803 ¾**, 809-810 ¼***
Pivot: 769-773 ½
Support: 747-753****, 720-726 ½****
Futures trading involves substantial risk of loss and may not be suitable for all investors. Trading advice is based on information taken from trade and statistical services and other sources Blue Line Futures, LLC believes are reliable. We do not guarantee that such information is accurate or complete and it should not be relied upon as such. Trading advice reflects our good faith judgment at a specific time and is subject to change without notice. There is no guarantee that the advice we give will result in profitable trades. All trading decisions will be made by the account holder. Past performance is not necessarily indicative of future results.

Daily Corn Market Update: Fundamental/Techncial Analysis 6.14.22Corn
Fundamentals: Yesterday’s weekly Crop Progress report showed corn is 97% planted, 88% emerged, and Good/Excellent conditions at 72%. All within the range of expectations. Yesterday’s weekly export inspections came in at 1,199,976. This was also within the range of expectations. Dr. Cordonnier increased Brazilian corn production by 3mmt to 110mmt. The USDA is at 116mmt, we believe the market is pricing in somewhere in the middle of those two estimates.
Technicals (July): July corn futures were lower yesterday, but finished off the lows, closing right near our pivot pocket, 769-773 ½. We are seeing some of yesterday’s weakness spill over into the overnight/early morning session following yesterday afternoon’s crop progress report. Technical levels remain largely intact. Resistance remains intact from 789 ½-790 ½. A continued failure to reclaim ground above here would mark a lower high, which would keep the door open for a potential lower low and a drop back to the 100-day moving average, 726 ½. The inflection point for a bigger drop would be a break and close below 747-753.
Bias: Neutral/Bearish
Previous Session Bias: Neutral/Bearish
Resistance: 789 ½-790 ½**, 800-803 ¾**, 809-810 ¼***
Pivot: 769-773 ½
Support: 747-753****, 720-726 ½****
Futures trading involves substantial risk of loss and may not be suitable for all investors. Trading advice is based on information taken from trade and statistical services and other sources Blue Line Futures, LLC believes are reliable. We do not guarantee that such information is accurate or complete and it should not be relied upon as such. Trading advice reflects our good faith judgment at a specific time and is subject to change without notice. There is no guarantee that the advice we give will result in profitable trades. All trading decisions will be made by the account holder. Past performance is not necessarily indicative of future results.

Technical Update for July CornCorn (July)
Technicals: July corn futures were able to chew through significant resistance during yesterday’s session, which has opened the door for an extension towards our next resistance pocket, 769-773. This pocket represents the lower high from the end of May, as well as the 50-day moving average. If the Bulls can keep the momentum going and chew through this resistance pocket, a retest of the psychologically significant $8.00 handle wouldn’t be out of the question.
Bias: Neutral
Previous Session Bias: Neutral/Bearish
Resistance: 769-773 ½***, 789 ½-790 ½**, 800-803 ¾**
Support: 747-753****, 729-733**, 716-720 ½****

Corn (Central Banks can't print Food)View On Corn (6 June 2022)
We are seeing some possible bottoming signs, and we shall see a lot higher price pretty soon.
So, it is better to buy in slowly and accumulate them.
Tip and Toe.
Let's see
DYODD, all the best and read the disclaimer too.
Feel Free to "Follow", press "LIKE" "Comment".
Thank You!
Legal Risk Disclosure:
Trading foreign exchange or CFD on margin carries a high level of risk, and may not be suitable for all investors.
The high degree of leverage can work against you as well as for you. Before deciding to trade foreign exchange you should carefully consider your investment objectives, level of experience and risk appetite.
The possibility exists that you could sustain a loss of some or all of your initial investment and therefore you should not invest money that you cannot afford to lose.
You should be aware of all the risks associated with foreign exchange trading, and seek advice from an independent financial advisor.

Corn: 2 possible scenariosAn attempt to show potential paths that corn could take.
• Currently have an up-trending pitchfork (blue): If corn respects trend line support and makes another run up, the trajectory could warrant a move above $9.00 into mid July and into August. Sep Corn will have some work to do to chew through the large inverse but it can be done. The green bars illustrating the move is a ghost feed from this same time frame on 2012’s move higher.
• The down-trending pitchfork (red) will make an attempt to it’s own median line at 6.11 and could theoretically make that move into last half of June (July contract). At this point we could se an attempt back up to compete with recent highs.
So what to do. New crop (Dec22) will follow the course of front months, so use continuous chart to help make decisions on new crop.
On a break above the upper level downtrend line on the red pitch fork (following the green ghost feed) start looking at selling physical, buying puts, selling option premiums (spreads…), etc
On a move below the lower level up-trending blue pitchfork, look for support to re own or buy courage calls (against the red ghost feed). Keep targets on a recovery at retracement’s just below the high mark and be ready to lift out of calls or roll up calls in that area. Buy puts on the recovery to get 100% priced and protected.
All of this is in theory and not necessarily a decisive game plan. Just wanted to share some thoughts...

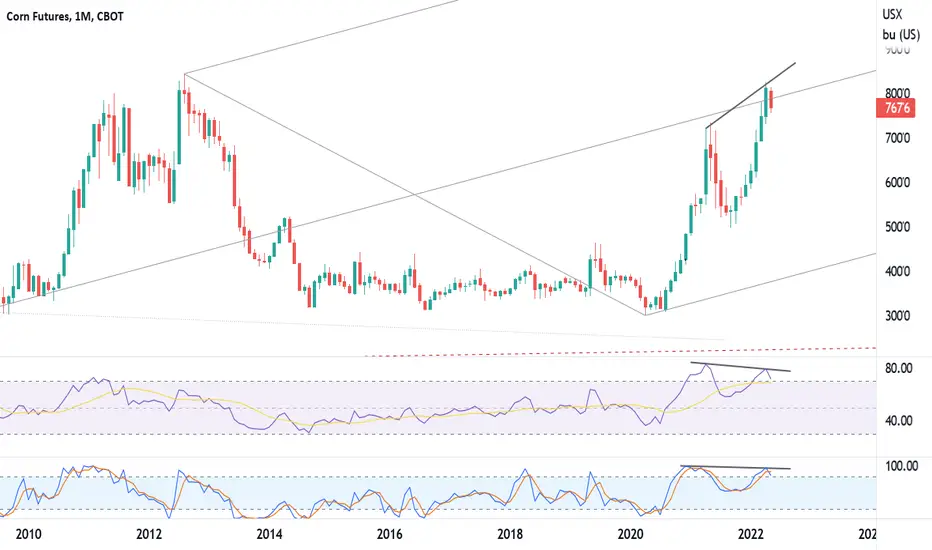
Corn - Monthly continuous Last years high of 7.35 met the median line of the long term pitch fork and turned lower. This year we have met the median line again with a high of 8.24. It appears that the median line has strong resistance. The momentum indicators (RSI and Stochastics) are turning lower. The divergence in lower pivots this year on each indicator accompanied by higher highs in corn cautions of a potential change in trend.
**Cautiously Bullish Corn, this chart is the reason to be cautious**
Corn - Weekly ContinuousThe weekly chart is showing divergence in momentum from 2/28’s pivot high at 7.82 to 4/25’s high of 8.24. Stochastics has turned lower as well. Corn has several areas of support but the lower uptrend line on the pitchfork should offer solid support. For the next few weeks the lower line support area at 6.85 to 7.10.
Targets above at 8.82 will find resistance through mid July. A move above the median line will next target 9.73.