Cattle, Corn, S&P500Cattle, Corn, and S&P 500: The fundamentals may be different now compared to in 2008, but I think these 3 markets are well intertwined. The effect of a major drawdown in the equities could impact all markets for a time. It sure seems that Cattle have some strong fundamentals to make a run up as it did from 2010 to 2014, but the timing of when that potential run higher begins is a million-dollar question. If the equity markets find support, beef should be in the race to higher levels with energies and other commodities…. If equities crash further, be careful
CORN

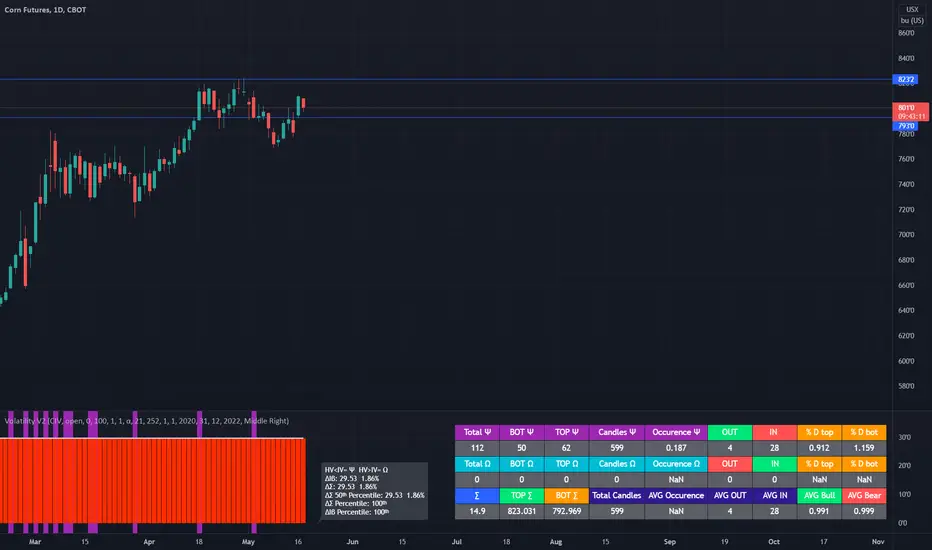
Volatility 19 May 22 Grains Commodities Futures CORN ZC Futures 19 May 2022
Based on the HV measures from the last 5612 candles our expected volatility for today is around 1.59%
However, in order to increase our accuracy I am going to use a 1.25x multiplier => 1.99%
This is translated into a movement from the current opening point of 15.48
With this information our top and bottom , with close to 85% probability for today are going to be
TOP 797.5
BOT 766.5
WHEAT ZW Futures 19 May 2022
Based on the HV measures from the last 5600 candles our expected volatility for today is around 2.84%
However, in order to increase our accuracy I am going to use a 1.25x multiplier => 3.55%
This is translated into a movement from the current opening point of 43.13
With this information our top and bottom , with close to 84% probability for today are going to be
TOP 1265.34
BOT 1178.65
SOYBEAN ZS Futures 19 May 2022
Based on the HV measures from the last 5600 candles our expected volatility for today is around 1.19%
However, in order to increase our accuracy I am going to use a 1.25x multiplier => 1.49%
This is translated into a movement from the current opening point of 24.82
With this information our top and bottom , with close to 84% probability for today are going to be
TOP 1688.5
BOT 1639
OAT ZO Futures 19 May 2022
Based on the HV measures from the last 5600 candles our expected volatility for today is around 2.43%
However, in order to increase our accuracy I am going to use a 1.25x multiplier => 3.04%
This is translated into a movement from the current opening point of 19.56
With this information our top and bottom , with close to 84% probability for today are going to be
TOP 664.35
BOT 625.15
COCOA CC Futures 19 May 2022
Based on the HV measures from the last 5615 candles our expected volatility for today is around 1.46%
However, in order to increase our accuracy I am going to use a 1.25x multiplier => 1.82%
This is translated into a movement from the current opening point of 44.98
With this information our top and bottom , with close to 85% probability for today are going to be
TOP 2550.62
BOT 2459.4
COTTON CT Futures 19 May 2022
Based on the HV measures from the last 5615 candles our expected volatility for today is around 2.24%
However, in order to increase our accuracy I am going to use a 1.25x multiplier => 2.8%
This is translated into a movement from the current opening point of 4
With this information our top and bottom , with close to 85% probability for today are going to be
TOP 148.5
BOT 140.5
COFFEE KC Futures 19 May 2022
Based on the HV measures from the last 5615 candles our expected volatility for today is around 2.94%
However, in order to increase our accuracy I am going to use a 1.25x multiplier => 3.67%
This is translated into a movement from the current opening point of 7.92
With this information our top and bottom , with close to 83% probability for today are going to be
TOP 226
BOT 210

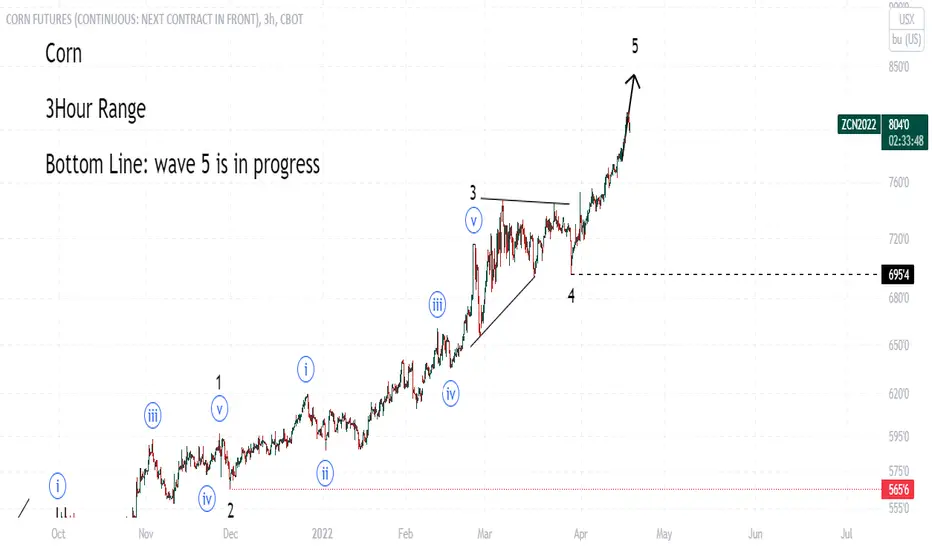
Corn Futures lined up for Elliot 5 WaveCorn looks to be continuing an uptrend, Just completed SOS and starting 5 wave up.

Corn and commitment of traders The market is not looking to find “Fair Value” in this current “Fear Driven” Market. Any thoughts on upside and downside risk above and/or below current prices should be considered…
The fundamentals to support a bullish market remain in place for this corn market. I still believe the job of this market is to see prices high enough to ration demand. A narrow focus on crush, feed, and export demand could argue that price has not rationed demand just yet. I would not discount a potential run up to 9.50 or even 11.00.
But other signals could be telling of demand rationing already. The strong dollar may not ration immediate demand, but it will ration future demand. Remember, this is a Futures Market. No chart attached - but the selloff across the equity markets needs to be monitored. Retail and fund investors have been more speculative into the current stock market and maintained highly leveraged (margined) positions. A continued sell off in equities could cause a major liquidity drain across all tradeable markets. Large Spec Fund’s may reduce their position out of the commodity space for some time. This will ration Paper demand….
Corn – Monthly Continuous: Competing with all time highs.
Commercial Longs (blue): Mostly End users hedged corn, bought to protect margins. Currently more than 200k less contracts compared to this same time last year with a market that is almost a dollar higher (Divergence). But, currently in line with previous years. I am surprised they are not as excited this year to hold more long positions. If they do get excited, I assume that will cause the next strong run up.
Commercial Shorts (yellow): Mostly elevators hedged corn bought from producer. Currently just over 1m short positions held. In line with 18’ and 19’ seasonal positions. Typically, a seasonal position between 800k and 1m shorts held by the commercials represents enough Natural selling to settle down the Corn Market. The commercial elevators appear to own a significant amount of corn. Is end user basis strong enough, and is the July/Sep inverse strong enough to move elevator owned bushels yet???
** In theory elevators are Shorts and end users are Longs. But in this strong demand driven inverted market I expect there to be spread positions placed from both sides to add another layer of protection. All this just makes for a more challenging market when positions are lifted and can self feed a trend regardless of fundamentals and technicals **
Commercial Net (Green): The spread between the Shorts and the Longs (-400k) is not as much in favor of the shorts compared to last year, but still at a historically strong level. (Divergence) A seasonal turn in net positions usually indicates a top is near.
Large Spec Funds (red): In a long and strong position, but again, not as strong as last year (Divergence). In most cases I believe the commercials drive the market more than the funds. The funds like to ride the wave. Combined, the Commercials can hold 1.5m to 2.0m contracts. The funds peak out just under 500k contracts… With that said they can still have a major influence on the market, especially when open interest is low.
Open Interest: Currently at elevated levels compared to the 2011’-2017’ market, but well-off last year’s levels. Enough liquidity in a normalized market, but in a $7-$9 market expect high volatility and deep ranges/corrections….
US Dollar (Orange): Commodity markets struggle to stay strong for a long period of time when the Dollar is above 100.00.

BTC multi-year channel bottomBTC almost at channel lows
I'm expecting bottom around low 20ks
DCA'ing + bidding 23k
Would assume bottom's already in if monthly closes above 33k
- not financial advice

Corn Futures ( ZC1! ), H1 Potential for Bullish bounceType : Bullish Bounce
Resistance : 808'4
Pivot: 801'2
Support : 795'2
Preferred Case: With price moving above our ichimoku cloud, we have a bullish bias that price will rise to our 1st resistance at 808'4 in line with the horizontal swing high resistance from our pivot of 801'2 in line with the 50% Fibonacci retracement and horizontal swing low support.
Alternative scenario: Alternatively, price may break pivot structure and head for 1st support at 795'2 in line with the horizontal swing low support.
Fundamentals: No Major News
Any opinions, news, research, analyses, prices, other information, or links to third-party sites contained on this website are provided on an "as-is" basis, as general market commentary, and do not constitute investment advice. The market commentary has not been prepared in accordance with legal requirements designed to promote the independence of investment research, and it is therefore not subject to any prohibition on dealing ahead of dissemination. Although this commentary is not produced by an independent source, FXCM takes all sufficient steps to eliminate or prevent any conflicts of interest arising out of the production and dissemination of this communication. The employees of FXCM commit to acting in the clients' best interests and represent their views without misleading, deceiving, or otherwise impairing the clients' ability to make informed investment decisions. For more information about the FXCM's internal organizational and administrative arrangements for the prevention of conflicts, please refer to the Firms' Managing Conflicts Policy. Please ensure that you read and understand our Full Disclaimer and Liability provision concerning the foregoing Information, which can be accessed on the website.

Expected Key Points Corn /ZC 17 May 2022CORN /ZC Futures 17 May 2022
The daily expected volatility is around 1,86%
With an 82% accuracy based on the historical data, we can assume that the price of NDX/NQ today is going to be between
TOP 823
BOT 792
All of this taken into account with the opening price of today which was 808*
✅CORN TIME TO SELL|SHORT🔥
✅CORN has hit a key structure level
Which implies a high likelihood of a move down
As some market participants will be taking profit from their long positions
While others will find this price level to be good for selling
So as usual we will have a chance to ride the wave of a bearish correction
SHORT🔥
✅Like and subscribe to never miss a new idea!✅

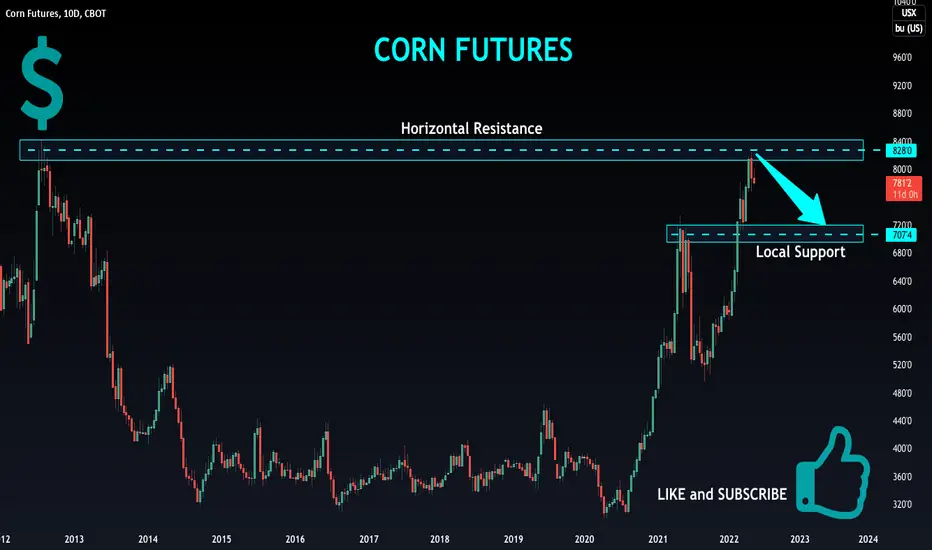
CORN FUTURES Swing Short! Sell!
Hello,Traders!
CORN has reached a massive horizontal resistance
Which happens to be an all time high for the commodity
And so we are already seeing a bearish reaction
Which I think will continue and the price
Will retest the local support below
Sell!
Like, comment and subscribe to boost your trading!
See other ideas below too!
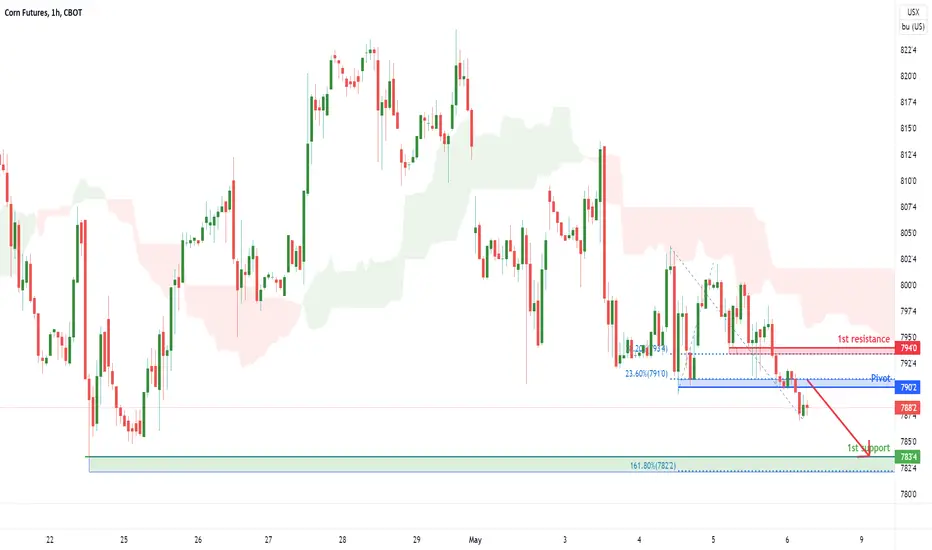
Corn Futures ( ZC1! ), H1 Potential for Bullish bounce Type : Bullish Bounce
Resistance : 801'6
Pivot: 791'4
Support : 783'0
Preferred Case: With price moving above our ichimoku cloud, we have a bullish bias that price will rise to our 1st resistance in line with the horizontal pullback resistance from our pivot of 791'4 in line with the 38.2% Fibonacci retracement and horizontal pullback support area.
Alternative scenario: Alternatively, price may break pivot structure and head for 1st support in line with the pullback support.
Fundamentals: No Major News

Corn Futures ( ZC1! ), H1 Potential for Bearish ContinuationType : Bearish Continuation
Resistance : 791'0
Pivot: 784'6
Support : 769'4
Preferred Case: With price expected to reverse off the ichimoku resistance, we have a bearish bias that price will drop to our 1st support in line with the horizontal swing low support from our pivot of 784'6 in line with the horizontal swing high support and 38.2% Fibonacci retracement.
Alternative scenario: Alternatively, price may break pivot structure and head for 1st resistance in line with the overlap resistance and 50% Fibonacci retracement.
Fundamentals: No Major News

Corn Futures ( ZC1! ), H1 Potential for Bearish ContinuationType : Bearish Continuation
Resistance : 785'4
Pivot: 777'0
Support : 767'2
Preferred Case: With the ichimoku indicating some bearish momentum, we have a bearish bias that price will drop to our 1st support in line with the 78.6% Fibonacci retracement and horizontal pullback support from our pivot of 767'2 in line with the horizontal pullback support from our pivot of 777'0 in line with the 50% Fibonacci retracement and horizontal overlap resistance.
Alternative scenario: Alternatively, price may break pivot structure and head for 1st resistance in line with the overlap resistance and 38.2% Fibonacci retracement.
Fundamentals: No Major News

Corn Futures ( ZW1! ), H1 Potential for Bearish ContinuationType : Bearish Continuation
Resistance : 783'4
Pivot: 778'0
Support : 767'2
Preferred Case: With the ichimoku indicating some bearish momentum, we have a bearish bias that price will drop to our 1st support in line with the 78.6% Fibonacci retracement and horizontal pullback support from our pivot of 778'0 in line with the horizontal pullback support.
Alternative scenario: Alternatively, price may break pivot structure and head for 1st resistance in line with the pullback resistance.
Fundamentals: No Major News

Corn Futures (ZL1!), H1 Potential for Bearish ContinuationType : Bearish Continuation
Resistance: 794'0
Pivot: 790'0
Support : 783'4
Preferred case: With price expected to reverse off the resistance of the ichimoku cloud, we see a potential bearish continuation from our pivot level which is in line with 23.6% Fibonacci retracement and horizontal pullback resistance towards our 1st support level of in line with the horizontal swing low support and 161.8% Fibonacci extension.
Alternative scenario: Alternatively, price may break our pivot structure and head for 1st resistance in line with the 38.2% Fibonacci retracement and horizontal pullback resistance.
Fundamentals: No major news.
Corn and Rate of Change PotentialCorn – 3mo Continuous: Comparing our current Bull market with the previous 4 major bull markets of the past 50 years. Previous price action on charts are often used for support and resistance. I like to look at rate of change during certain periods. Currently the 24 mo ROC is at 140% and compares to the 95-96 and the 11-12 rally’s. The previous all time high on corn was 8.43 in Aug 12’ and will act as resistance. If we look at potential price above 8.43, the ROC from 71-73 can be used to project potential up to the 9.50 area. If we use the 06-08 ROC that projects price up to 11.35.
**Disclosure** Do not take this as trading advice. The potential is there for 9.50 to 11.35 Corn, but anything could keep us from getting above today’s High.

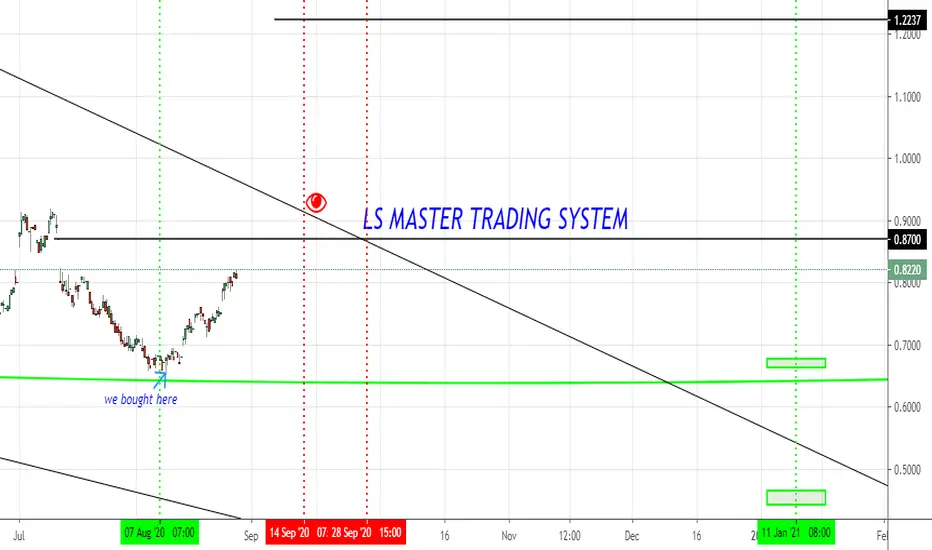
CORN FUTURES SELL CALL OUT BY JOHN THE FOREX GUY!Hi guys this is john the forex guy. After a few months of refining and twerking my plan approach I'm back guys. I believe corn futures will soon sell this is based on the the fact that we are at a psychological supply area but what come to light through my team member is that corn is really over supplied in the world looking deeper these following few months will be crucial at determining how this unfolds.
Take note guys I am a long term trader bare in mind these trade will run on average for weeks to months so always be mentally ready to hold a trade for 3 months or even more. These are the the type of trade I call home-runs, why?
(A) Reduce your exposure to the markets by trading fewer trades a year, a person who opens a trade every day is highly likely to crash and burn compared to those who trade less, let's say 1 to 30 trades a year are more likey to keep their winnings in the long run.
(B) Low risk on each trade usually between 1% and 5% of your account (excluding commission just trade value)
(C) High reward on each trade a minimum of 10% profit and uncapped potential reward could be 20% or 113% profit of your account it is unlimited! (excluding commission)
(D) All these factors from A to C add up to this; In order to lose all your capital you need to lose 15 to 20 trades in a raw but looking at the way we approach the markets and take our trades it is highly unlikely to lose all your capital because it is almost impossible to take 15 trades a year if you're holding 1 trade for almost 2-3 months.
I will give you an IDEA/EXAMPLE how I am taking this trade lets base this on a $100 account:
(A) Open 1x position SELL
(B) Stop loss -$5.50 (5.5% loss of $100)
(C) Take profit +$25.00(25% profit of $100)
Disclaimer I not a financial advisor I am simply a retail trader sharing my trade where I entered, plan to exit loss and profit so always do your own research before committing/investing your money.

Corn update -25/04/2022expecting a move higher to complete wave ((v)) of 5, key levels to note ( 753 - 813.6 ).

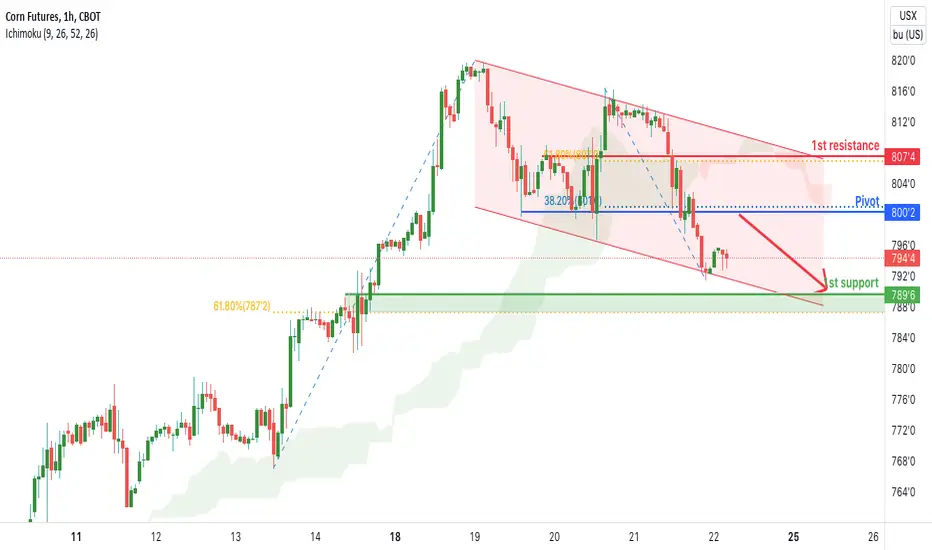
Corn Future (ZC1!), H1 Potential for Bearish ContinuationType : Bearish Continuation
Resistance: 807'4
Pivot: 800'2
Support : 789'6
Preferred case: With price moving below the ichimoku cloud and the descending channel, we see a potential bearish continuation from our pivot level of 800'2 which is in line with 38.2% Fibonacci retracement and horizontal overlap resistance towards our 1st support level of 789'6 which is in line with the horizontal pullback support and 61.8% Fibonacci retracement.
Alternative scenario: Alternatively, price may break our pivot structure and head for 1st resistance level of 807'4 in line with 61.8% Fibonacci retracement and horizontal pullback resistance.
Fundamentals: No major news.
Corn Futures (ZC1! ), H1 Potential for Bearish MomentumType: Bearish Momentum
Resistance: 814'4
Pivot: 807'4
Support: 795'4
Preferred case: We see the potential for a bearish dip from our pivot level at 807'4 in line with 38.2% Fibonacci retracement towards our 1st support level at 795'4 in line with 50% Fibonacci retracement, 61.8% Fibonacci projection and -27.2% Fibonacci expansion.
Alternative scenario: Alternatively, price might break our pivot structure and head for 1st resistance level at 814'4 in line with 78.6% Fibonacci retracement.
Fundamentals: No major news.

CORN: Cup & Saucer pattern targets 976Both the measured Cup move & the measure bullish flag move targets 976.
Russian invasion may escalate & further worsen the commodity crisis like wheat, corn, fertilizer & metals
like palladium, uranium & platinum.
Not trading advice

Corn Futures Consolidating after S/R Flip$CORN $ZC1! futures currently consolidating above previous resistance turned support. Bull flag setup from a TA perspective. Will long closer to support for another leg up.
