CORN, bound for huge bounce.. Drought will make prices surge!CORN has overextended correction to 5.74 from a high of 6.8. The overreaction is a bit on the unreasonable side with worst DROUGHT in years endangering world's supply.
Price is back at 1.0 FIB level. This is beyond bargain / discount. Best to seed at this range.
Based on monthly data, the 'trend shift' based on metrics hasn't changed. Reversal is on queue at the current price range. If anything, the market is too generous to offer at very low prices before the potential future valuation.
4H histogram is currently shifting -- with buyers attempting to reverse the trend.
Spotted at 5.7
TAYOR
Safeguard capital always.
-------------
some related news:
Central US is now getting worst of the drought. Corn crops are stressed, rivers are running low
The middle of the country is extraordinarily dry
ByJIM SALTER Associated Press
June 30, 2023, 12:06 AM
Drought Midwest
This photo provided by Mike Shane shows Shane as he stands in his corn field near Peoria, Ill., Tuesday, June 27, 2023. By now, the corn stalks should be 10 feet high. Instead, they’re barely up to Shane’s waist. Illinois and other corn-growing states in the cent...Show more
The Associated Press
ST. LOUIS -- Mike Shane’s Illinois farm got a nice soaking on May 8, shortly after he planted his corn crop. Since then, rain has been hard to come by.
Plenty of storms have ventured close only to fizzle out before making it to Shane’s 200-acre spread near Peoria.
“It comes across the Mississippi River and then just disappears,” Shane, 47, said. “My corn looks absolutely terrible right now.” Without substantial rain soon, “I just don’t see any hope for it,” he said.
Heavy rain over the winter eased the drought in the West, but now the middle of the country is extraordinarily dry. Crops are stressed, rivers are running low, and cities and towns are anxiously hoping for a break in the weather.
Experts say the drought in the central U.S. is the worst since at least 2012, and in some areas, is drawing comparisons to the 1988 drought that devastated corn, wheat and soybean crops. This year, although temperatures have been generally mild through the spring and early days of summer, rainfall has been sorely lacking.
The U.S. Drought Monitor, operated by the federal government and the National Drought Mitigation Center at the University of Nebraska-Lincoln, reports that nearly half of Kansas is in either extreme or exceptional drought condition — the highest drought designation. More than a quarter of Nebraska is in extreme drought, and 13% is in exceptional drought. Arid conditions permeate Minnesota, Iowa, Wisconsin, Michigan, Indiana, Missouri and Kentucky.
The frequency and intensity of droughts and rainfall are increasing due to burning fossil fuels and other human activity that releases greenhouse gases, according to data from a pair of satellites used to measure changes in Earth’s water storage. The study was published in March in the journal Nature Water.
Adam Hartman, a meteorologist at the National Oceanic and Atmospheric Administration’s Climate Prediction Center, said some parts of the central U.S. have been experiencing extreme drought since the winter. In other states, “flash droughts” have popped up over the past 2-3 months.
“As a result you’ve see drastic losses in topsoil, subsoil moisture,” Hartman said. “We’ve seen ground water levels start to lower as well. We’ve seen stream flows start to decline.”
Crops are feeling the impact. The U.S. Department of Agriculture now rates only half of the U.S. corn crop as good or excellent — the lowest percentage since 1988. Nearly two-thirds of the nation’s corn-growing areas are in drought.
“That gives us some indicator that we’re seeing widespread stress on those crops throughout the Corn Belt,” said Krista Swanson, an economist for the National Corn Growers Association.
If rains don't arrive soon, Swanson believes total yield could be down about 1 billion bushels from the original projection of 16.7 billion bushels.
That won’t necessarily mean higher costs for consumers because much of the corn is used for feed, ethanol or is exported, Swanson said. The real impact is on the farmers.
“Their cost-per-acre is the same regardless of what they produce,” Swanson said. “In these years where we have lower production, on the farmer side that’s a challenge.”
Water levels are dipping in rivers. The Mississippi River — especially from southern Illinois to the south — is extremely low in many spots. It was just last fall that the river reached or neared record low-water marks in several places, only to bounce back to flood levels in the spring, before the latest drought-fueled decline.
Lynn Muench, a senior vice president for the American Waterways Operators, which advocates for the tugboat, towboat and barge industry, said barge capacity is being voluntarily reduced on parts of the Mississippi River.
Losing capacity is a financial setback but operators are taking it in stride, Muench said.
“We’re a flexible and resilient industry so we’ll keep going,” he said.
Colin Wellenkamp, executive director of the Mississippi River Cities and Towns Initiative, said many communities are on edge. The drought last fall cost river communities billions of dollars in losses due to increased energy and water purification costs, lost tourism revenue, commodity losses and other hits.
“Now we’re right back into drought again,” Wellenkamp said. So far, impact has been minimal, “but if we don’t get relief in July, that’s all going to change,” he said.
On Shane's 200-acre farm, corn should be standing 10 feet tall by now. It's barely to his waist. The leaves are yellowed and Shane isn't certain the ears of corn are even developing.
“If that's the case, it's worthless,” he said.
But farmers aren't giving up hope. Swanson said the El Nino weather pattern that has taken hold typically means more rain and better growing conditions in the central U.S.
“We could see more favorable weather over the next two months, which could have a positive impact,” she said.
But even with El Nino, Hartman noted that the seasonal outlook for the summer months projects below-normal rainfall.
“This drought could stick around for a little bit,” Hartman said.
CORN

Can Corn Conquer Climate Change?The global food system is under siege from the escalating climate crisis, and corn, a pivotal commodity, is facing a particularly formidable challenge. Rising temperatures, erratic rainfall patterns, and the increased prevalence of pests and diseases are all conspiring to undermine corn production. This article delves into the intricate relationship between corn and climate change, examining the potential consequences for food security, economic stability, and social well-being.
Beyond the immediate threats posed by climate change, the impacts on corn production can have far-reaching consequences. Reduced yields can lead to price volatility, making it difficult for low-income households to afford basic food staples. This can contribute to food insecurity and malnutrition, particularly in vulnerable populations. Moreover, corn production is a major source of income for many farmers, especially in developing countries. Climate change-induced crop failures can have devastating consequences for rural livelihoods and economic stability.
However, the challenges are not insurmountable. By adopting sustainable agricultural practices, investing in climate-resilient crop varieties, and fostering global cooperation, we can safeguard the future of corn and ensure a more sustainable and equitable food system for generations to come. Climate-smart agriculture, which includes practices like crop rotation, cover cropping, and precision agriculture, can improve soil health, reduce water use, and enhance resilience to climate change. Additionally, breeding for resilience can develop corn varieties that are more tolerant to heat, drought, and pests.
Furthermore, promoting crop diversification can help reduce the risk of crop failures and ensure food security even in the face of climate-related challenges. Governments can also play a crucial role in supporting farmers by providing financial assistance, access to climate information, and investments in agricultural research and development.
In conclusion, the future of corn is inextricably linked to our ability to adapt to a changing climate. By embracing sustainable practices, investing in innovation, and fostering global cooperation, we can ensure that corn continues to play a vital role in feeding the world. It's a call to action, a challenge to rethink our approach to agriculture, and a reminder that the future of food is in our hands.
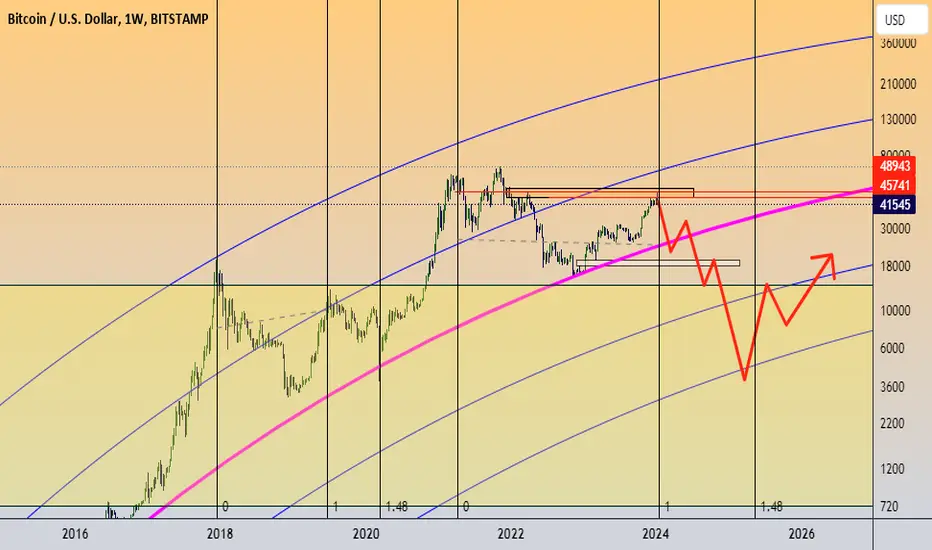
BTC $38-$40k low before macro upsideSorry to break it to y'all, but the BTC chop isn't finished yet. I expect a drop to around the $40ks which coincides with the Nov 22 low from a momentum perspective, unlocking another 10 months of upside like we previously experienced.
CAPITALCOM:US500 is the main cause of this, which will cause another capitulation event before assets break correlation and boom. Timeframe can be forecasted using the resistance fan lines. I am a MAXI so trust the analysis, I want $300k+ just as much as you all do. Kappa.

CORN Buy IdeaFOREXCOM:CORN has shown big upside move after a long term bearish trend. Currently, It's retracing towards an ascending trendline retest where we can look for buying setups

CORN Buy IdeaFOREXCOM:CORN has completed it's ABCD harmonic pattern and currently trading in potential reversal zone. We might see possible bullish move here and can try to look for buy side opportunities

CORN Buy IdeaFOREXCOM:CORN has completed it's ABCD harmonic pattern and currently trading in potential reversal zone. We might see possible bullish move here and can try to look for buy side opportunities

Momentum Trading In Agricultural CommoditiesMomentum trading, a strategy as old as the markets themselves, has found fertile ground in the sprawling fields of agricultural commodities.
As the seasons change, so do the prices of wheat, corn, soybeans, and other staples, tracing patterns as predictable as the migration of birds or the spring blossom.
This paper delves into these seasonal trends, uncovering how they can serve as reliable signals for astute investors looking to harness the power of momentum trading.
SEASONAL TRENDS IN AGRICULTURAL COMMODITIES
Mint Finance has previously highlighted some of these seasonal trends in Corn and Soybean in detail previously
In short, seasonal cycles in crop performance are linked to crop harvest cycles. Pre-harvest, inventory drawdowns tend to drive price higher while post-harvest, a glut of inventory tends to drive prices lower.
Corn
Corn prices start declining in June following the harvest in China (second largest corn producer) and Brazil (third largest corn producer). Prices reach their lowest in October, coinciding with the harvest in the US.
Over the past five years, corn prices have increased in the first half of the year before declining sharply in late June. In 2024, indexed price performance shows prices sharply lagging the seasonal trend as we approach the date on which prices generally declined the last five years.
Wheat
Wheat seasonality is less pronounced than other agri-commodities due to its relatively global distribution. Still, wheat prices generally rise during the first part of the year before declining in late June as all the major producers - China, Indian, EU, Russia, and US harvest crops during this period.
This year, wheat prices started the year off on a bearish note. After bottoming in early-March, prices started to rise sharply peaking in late-May. Mint Finance covered some of the factors behind this rally in a previous paper (Extreme Weather Sends Wheat Prices Surging). Prices have started to normalize in June, a few weeks before the seasonal price decline generally begins.
Soybean
Soybean prices generally rise during the first part of the year. In late-June, as the Brazil harvest reaches its peak, prices decline sharply. Prices remain subdued until September when the US crop is harvested.
This year, prices have sharply lagged their seasonal performance. Despite the rally in early-May driven by flooding in Brazil, prices remain lower than their level at the start of 2024. Moreover, the rally following the flood-driven rally has retraced a few weeks before the seasonal price decline generally takes place.
MOMENTUM TRADING IN AGRICULUTAL COMMODITIES
Investors can execute momentum trading strategies by leveraging these seasonal trends. In this context, momentum trading strategy refers to a relatively simple trading strategy where investors either buy or sell a futures contract at the start of the month based on the seasonal price performance during that month.
For instance, if seasonal trends show that June generally results in a price decline, the strategy would consist of going short on the commodity at the start of June and closing the position at the end of the month.
Although, at face value, this strategy may seem overly simplistic, its return and accuracy are surprisingly high.
The simulations are based on a position in the front-month futures, consisting of one contract of the agricultural commodity, opened at the beginning of the month and closed at the end.
Corn
For Corn, running the momentum trading strategy would have yielded average annual returns of USD 8,500 per year over the past five years (2019-2023). Crucially, performance of this strategy in 2024 is sharply lower as it would yield total PnL of just USD 63 this year.
Wheat
Similarly, for wheat, this strategy returned an average PnL of 4,650 per year during 2019-2023. So far in 2024, this strategy would have yielded USD 6,600 in wheat futures in 2024.
Soybean
In Soybean futures, momentum trading would have been the most successful over the past five years. This strategy would have yielded an average of USD 13,600 per year between 2019 and 2023. However, in 2024, this strategy would not have been successful as it would have resulted in a loss of USD 8,700 so far.
SUMMARY AND 2024 PERFORMANCE
It is clear that although this strategy is successful on a long timeframe, it is not necessarily profitable each month. For instance, the Soybean momentum trading strategy would have resulted in a loss in 2024 while Corn momentum trading strategy would have resulted in flat returns.
The reason behind this divergence from seasonal trend is clear when comparing the seasonal price performance charts at the start of the paper. Fundamental factors can result in broad-based trends throughout the year which can skew returns. For instance, as Soybean prices have been declining for most of 2024, a long position would have resulted in a loss regardless of seasonal trends.
As such, it is crucial to supplement this strategy using fundamental inputs on what the long-term price trend for the crop is. For a crop which is in a down-cycle, a long position would not make sense and vice versa.
In the near-term, all three crop’s prices tend to decline during July based on seasonal trends. However, the outlook for corn is most bearish. The latest WASDE report , suggested that USDA expects global corn production in marketing year 2024-2025 to reach 1,220.5 million metric tons compared to a forecast of 1,219.93 million MT last month. The increase in production comes from forecast for higher output from Ukraine and Zambia more than offsetting the decline in Russia.
Moreover, USDA forecasts a season average price of USD 4.4 per bushel which is lower than the current futures price of USD 4.57. Asset managers are also shifting their view on corn prices bearish once again as COT report showed asset managers increasing net short positioning last week.
Both fundamental and seasonal factors support a price decline in corn over the next month. However, seasonal trends are not exact. Particularly in 2024, seasonal trends have underperformed their usual returns from the last five years.
Investors can opt to use options instead of futures to express the same view of weakening prices. Options provide fixed downside risk and require only an upfront premium, avoiding the need to manage margins as futures prices fluctuate.
A long put position in CME corn options expiring on August 23 (ZCU24) can be used to gain downside exposure.
CME Corn puts are relatively cheaper compared to calls. Moreover, options IV (measured by the CVOL index) is lower compared to the peaks seen during the same time last year. An options position would benefit from both falling prices and rising IV.
Source: CVOL
A long put options position on corn futures presents fixed downside of USD 464 (USc 9.29 x 5000/100) and unlimited upside. A strike price of USc 430/bushel represents delta of -0.29. This position would break-even at USc 420/bushel.
MARKET DATA
CME Real-time Market Data helps identify trading set-ups and express market views better. If you have futures in your trading portfolio, you can check out on CME Group data plans available that suit your trading needs tradingview.sweetlogin.com
DISCLAIMER
This case study is for educational purposes only and does not constitute investment recommendations or advice. Nor are they used to promote any specific products, or services.
Trading or investment ideas cited here are for illustration only, as an integral part of a case study to demonstrate the fundamental concepts in risk management or trading under the market scenarios being discussed. Please read the FULL DISCLAIMER the link to which is provided in our profile description.

Corn ,bias to the downside...Hello fellow traders , my regular and new friends!
Welcome and thanks for dropping by my post.
Bias should be still shorting it.But take note of the 440 zone.
Do check out my recorded video (in trading ideas) for the week to have more explanation in place.
Do Like and Boost if you have learnt something and enjoyed the content, thank you!
-- Get the right tools and an experienced Guide, you WILL navigate your way out of this "Dangerous Jungle"! --
*********************************************************************
Disclaimers:
The analysis shared through this channel are purely for educational and entertainment purposes only. They are by no means professional advice for individual/s to enter trades for investment or trading purposes.
*********************************************************************

Corn,Price actions didnt hold up last week..Hello fellow traders , my regular and new friends!
Welcome and thanks for dropping by my post.
Turning bearish on this one..wheat could be as well..it seems like trying to push lower with the toppish pattern that you are seeing on h4...
Do check out my recorded video (in trading ideas) for the week to have more explanation in place.
Do Like and Boost if you have learnt something and enjoyed the content, thank you!
-- Get the right tools and an experienced Guide, you WILL navigate your way out of this "Dangerous Jungle"! --
*********************************************************************
Disclaimers:
The analysis shared through this channel are purely for educational and entertainment purposes only. They are by no means professional advice for individual/s to enter trades for investment or trading purposes.
*********************************************************************

Corn and Wheat to look for long...why?Hello fellow traders , my regular and new friends!
Welcome and thanks for dropping by my post.
Why? will share my thoughts in my trading analysis this week.
Technical wise yes,part of it.
Do check it out ;)
Do check out my recorded video (in trading ideas) for the week to have more explanation in place.
Do Like and Boost if you have learnt something and enjoyed the content, thank you!
-- Get the right tools and an experienced Guide, you WILL navigate your way out of this "Dangerous Jungle"! --
*********************************************************************
Disclaimers:
The analysis shared through this channel are purely for educational and entertainment purposes only. They are by no means professional advice for individual/s to enter trades for investment or trading purposes.
*********************************************************************

Inflation & Agricultural Prices - On the Rise Again Inflation is expected to rise again because the prices of staples such as wheat, rice, corn, and soybean meal have been increasing over the last two months. Additionally, we've seen a 20% increase in soybean meal prices since the low in February.
Chicago SRW Wheat Futures & Options
Ticker: ZW
Minimum fluctuation:
1/4 of one cent (0.0025) per bushel = $12.50
Soybean Meal Futures & Options
Ticker: ZM
Minimum fluctuation:
0.10 per short ton = $10.00
Disclaimer:
• What presented here is not a recommendation, please consult your licensed broker.
• Our mission is to create lateral thinking skills for every investor and trader, knowing when to take a calculated risk with market uncertainty and a bolder risk when opportunity arises.
CME Real-time Market Data help identify trading set-ups in real-time and express my market views. If you have futures in your trading portfolio, you can check out on CME Group data plans available that suit your trading needs tradingview.sweetlogin.com

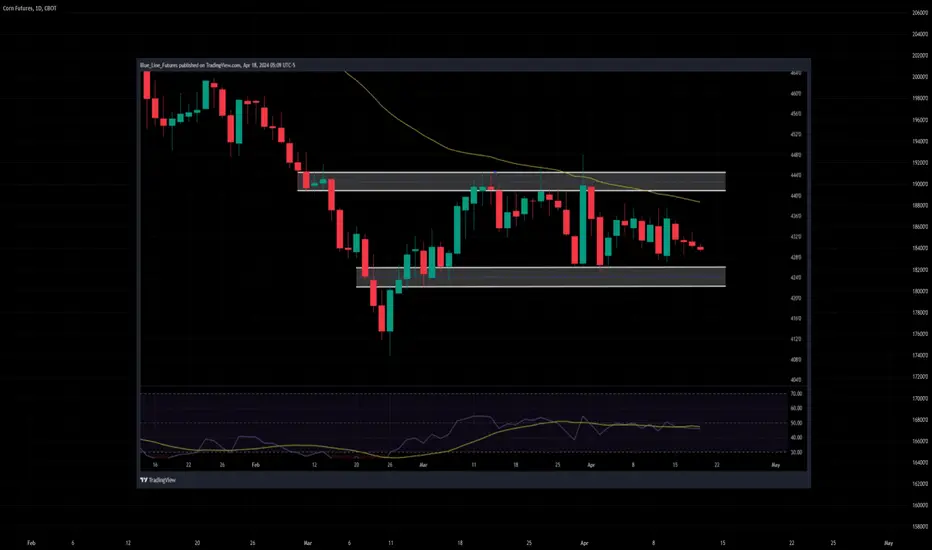
Corn Futures:Evaluating Seasonal Trends Amidst Market VolatilityAs April unfolds, investors and traders in the corn futures market find themselves at a critical juncture marked by seasonal trends and heightened volatility. Historically, April has been a period of growth in corn prices, driven by various factors including planting intentions, weather conditions, and demand patterns. However, the current landscape presents a complex picture influenced by a myriad of geopolitical, climatic, and logistical disruptions.
While the overall corn production from key sources such as the US, Brazil, Argentina, and Ukraine has remained relatively stable, the market has experienced significant turbulence. Geopolitical conflicts, including trade disputes and tensions in key producing regions, have added layers of uncertainty, impacting supply chains and trade dynamics. Severe weather events, ranging from droughts to floods, have disrupted planting schedules and crop yields, further exacerbating market volatility. Additionally, transport issues, including congestion at ports and logistical bottlenecks, have contributed to fluctuations in day-to-day prices and overall market sentiment.
Amidst this backdrop, market participants are actively seeking long setups, anticipating a potential upswing in corn prices. Historical data indicating seasonal strength in April provides a compelling rationale for such positions. Moreover, underlying factors such as resilient demand from sectors including animal feed, ethanol production, and food processing continue to support a bullish outlook for corn.
However, navigating the corn futures market requires careful consideration of both macroeconomic factors and micro-level dynamics. Traders must remain vigilant in monitoring weather forecasts, geopolitical developments, and supply chain disruptions for timely decision-making. Additionally, leveraging technical analysis tools and risk management strategies can help mitigate the impact of market volatility and optimize trading opportunities.
In conclusion, while April historically heralds a period of price growth in corn futures, the current environment characterized by heightened volatility necessitates a nuanced approach to trading. By combining an understanding of seasonal trends with a comprehensive assessment of market fundamentals and risk factors, traders can position themselves to capitalize on potential opportunities while managing inherent uncertainties.

Corn broke the upper side of the rangeEASYMARKETS:CRNUSD
Disclaimer:
easyMarkets Account on TradingView allows you to combine easyMarkets industry leading conditions, regulated trading and tight fixed spreads with TradingView's powerful social network for traders, advanced charting and analytics. Access no slippage on limit orders, tight fixed spreads, negative balance protection, no hidden fees or commission, and seamless integration.
Any opinions, news, research, analyses, prices, other information, or links to third-party sites contained on this website are provided on an "as-is" basis, are intended only to be informative, is not an advice nor a recommendation, nor research, or a record of our trading prices, or an offer of, or solicitation for a transaction in any financial instrument and thus should not be treated as such. The information provided does not involve any specific investment objectives, financial situation and needs of any specific person who may receive it. Please be aware, that past performance is not a reliable indicator of future performance and/or results. Past Performance or Forward-looking scenarios based upon the reasonable beliefs of the third-party provider are not a guarantee of future performance. Actual results may differ materially from those anticipated in forward-looking or past performance statements. easyMarkets makes no representation or warranty and assumes no liability as to the accuracy or completeness of the information provided, nor any loss arising from any investment based on a recommendation, forecast or any information supplied by any third-party.

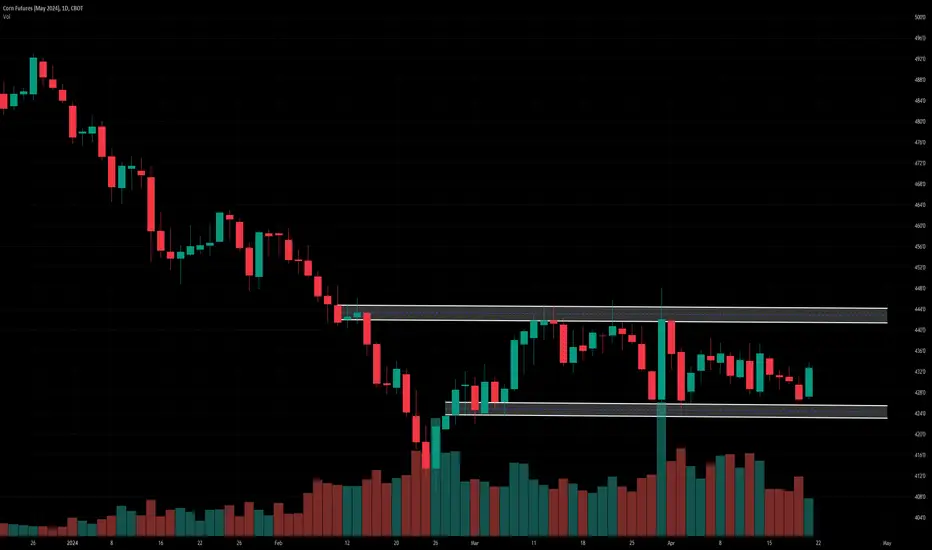
Can Corn Futures Stage a Spring Rally?We've shifted our focus to the July futures contracts as the volume starts to increase there and decrease in May futures. May options expiration is this Friday, which means first notice day is next week. If you're in May futures, you may consider exiting or rolling those positions.
Corn
Technicals (July)
July corn futures have traded on both sides of unchanged as we start a new week of trade. The fact that the Bulls were able to defend support late last week is a silver lining for the Bull camp, but upside expectations are likely tempered as it continues to be a mostly sideways trade over the last month. The sideways trade isn't a great environment for the perma-bull or perma-bear, but it's great for shorter term traders, on both sides of the market.
Bias: Bullish/Neutral
Resistance: 441 3/4-444 1/2***, 449 1/2-451****
Pivot: 431 1/2-435
Support: 433 1/4-436****, 422 1/4-424 1/4***
Fund Positioning
Friday’s Commitment of Traders report showed that Funds were net sellers of about 16k contracts (through 4/16/24), that puts their net short position at 279,570. Broken down that is 161,576 longs VS 441,146 shorts.
Seasonal Trends
(Past performance is not necessarily indicative of future results)
Check out this link to review the chart.
bluelinefutures.com
Below is a look at price averages for December corn, using the 5, 10, 15, 20, and 30 year averages. We update this each Monday. If you'd like to look at different contract months, spreads, etc, let us know and we can send those charts to you.
Check out Blue Line Futures
bluelinefutures.com
Email info@Bluelinefutures.com or call 312-278-0500 with any questions -- our trade desk is here to help with anything on the board!
Futures trading involves substantial risk of loss and may not be suitable for all investors. Therefore, carefully consider whether such trading is suitable for you in light of your financial condition. Trading advice is based on information taken from trade and statistical services and other sources Blue Line Futures, LLC believes are reliable. We do not guarantee that such information is accurate or complete and it should not be relied upon as such. Trading advice reflects our good faith judgment at a specific time and is subject to change without notice. There is no guarantee that the advice we give will result in profitable trades. All trading decisions will be made by the account holder. Past performance is not necessarily indicative of future results.
Blue Line Futures is a member of NFA and is subject to NFA’s regulatory oversight and examinations. However, you should be aware that the NFA does not have regulatory oversight authority over underlying or spot virtual currency products or transactions or virtual currency exchanges, custodians or markets. Therefore, carefully consider whether such trading is suitable for you considering your financial condition.
With Cyber-attacks on the rise, attacking firms in the healthcare, financial, energy and other state and global sectors, Blue Line Futures wants you to be safe! Blue Line Futures will never contact you via a third party application. Blue Line Futures employees use only firm authorized email addresses and phone numbers. If you are contacted by any person and want to confirm identity please reach out to us at info@bluelinefutures.com or call us at 312- 278-0500

Corn recouping early week loses and setting up a test of 3-star.Corn
Technicals (May)
May corn futures tested the low end of the range in yesterday's trade and have so far been able to defend it, with prices working back higher in the overnight and early morning trade. We still like the risk reward trade to the buy side from the low end of the range. A break and close support would neutralize that bias as it could put the Bears back in complete control of the technical landscape.
Bias: Bullish/Neutral
Resistance: 441 3/4-444 1/2***, 447 1/2-450****
Pivot: 431 1/2-435
Support: 421-422***
Fund Positioning
Friday’s Commitment of Traders report showed that Funds were net sellers of about 4k contracts (through 4/9/24), that puts their net short position at 263,554. Broken down, that is 158,480 longs VS 422,034 shorts.
Seasonal Trends
(Past performance is not necessarily indicative of future results)
Below is a look at price averages for December corn, using the 5, 10, 15, 20, and 30 year averages.
Check out CME Group real-time data plans available on TradingView here: tradingview.sweetlogin.com
Disclaimers:
CME Real-time Market Data help identify trading set-ups and express my market views. If you have futures in your trading portfolio, you can check out on CME Group data plans available that suit your trading needs tradingview.sweetlogin.com
*Trade ideas cited above are for illustration only, as an integral part of a case study to demonstrate the fundamental concepts in risk management under the market scenarios being discussed. They shall not be construed as investment recommendations or advice. Nor are they used to promote any specific products, or services.
Futures trading involves substantial risk of loss and may not be suitable for all investors. Trading advice is based on information taken from trade and statistical services and other sources Blue Line Futures, LLC believes are reliable. We do not guarantee that such information is accurate or complete and it should not be relied upon as such. Trading advice reflects our good faith judgment at a specific time and is subject to change without notice. There is no guarantee that the advice we give will result in profitable trades. All trading decisions will be made by the account holder. Past performance is not necessarily indicative of future results.
A Stick In The MudCorn
Technicals (May)
What more is there to say about the corn market that hasn’t been said already? The market remains range bound with daily ranges shrinking as of late, reminiscent of watching paint dry. The CME CVOL index which measures volatility remains near the low end of the years range. Typically, we start to see that increase this time of year, but perhaps we need to get the May contract into delivery to liven things up. On that same topic, trade volume is starting to shift out from the May contract to July, with first notice day just under two-weeks away.
Bias: Bullish/Neutral
Resistance: 441 3/4-444 1/2, 447 1/2-450*
Pivot: 431 1/2-435
Support: 421-422***
Fund Positioning
Friday’s Commitment of Traders report showed that Funds were net sellers of about 4k contracts (through 4/9/24), that puts their net short position at 263,554. Broken down that is 158,480 longs VS 422,034 shorts.
Seasonal Trends
(Past performance is not necessarily indicative of future results)
Below is a look at price averages for December corn, using the 5, 10, 15, 20, and 30 year averages.
Check out CME Group real-time data plans available on TradingView here: tradingview.sweetlogin.com
Disclaimers:
CME Real-time Market Data help identify trading set-ups and express my market views. If you have futures in your trading portfolio, you can check out on CME Group data plans available that suit your trading needs tradingview.sweetlogin.com
*Trade ideas cited above are for illustration only, as an integral part of a case study to demonstrate the fundamental concepts in risk management under the market scenarios being discussed. They shall not be construed as investment recommendations or advice. Nor are they used to promote any specific products, or services.
Futures trading involves substantial risk of loss and may not be suitable for all investors. Trading advice is based on information taken from trade and statistical services and other sources Blue Line Futures, LLC believes are reliable. We do not guarantee that such information is accurate or complete and it should not be relied upon as such. Trading advice reflects our good faith judgment at a specific time and is subject to change without notice. There is no guarantee that the advice we give will result in profitable trades. All trading decisions will be made by the account holder. Past performance is not necessarily indicative of future results.
Corn Prices To Fire Up on Rising Energy CostsIt is official. Inflation is back. But not everywhere. Food inflation is on the decline. All three major crops, Soybean, Wheat, and Corn have declined substantially. Bearish sentiments rings loud across agri with ample supplies combined with solid harvest expectations.
Among crops, corn has fared best. Its prices have not declined as much. Corn outlook is positive given South American supply uncertainty and gasoline linked demand spike.
Corn prices face downside risk from ample supply in the near term. Prices have the potential to spike during later part of the year due to supply uncertainty and higher consumption.
Traders can deploy a calendar spread in CME Corn futures comprising of a short September 2024 Corn Futures (ZSU2024) and a long March 2025 Corn Futures (ZSH2025) to gain from shifting dynamics.
RECORD US CROP WILL SUPPRESS NEAR TERM CORN PRICE
The US produced a record 389.69 million MT of corn last year as per latest USDA figures. Massive production is a result of record high yield of 177.3 bushels per acre.
Globally, corn production in the current marketing year is expected to reach a record 1,227 million MT, due to the US crop last year.
Higher supply is expected to lead to a buildup in ending stocks. Stocks are expected to increase from 302.19 million MT to 318.28 million MT. This represents a buildup of almost 16 million MT.
Ample supplies are a headwind to near term corn prices.
USDA ESTIMATES MAY BE TOO OPTIMISTIC
Global corn production forecasts by USDA may be too optimistic. Upcoming harvests from Brazil and Argentina may spring surprises to the downside.
USDA’s forecast for the Brazil corn crop is currently at 124 million MT. Brazil’s national agricultural agency - CONAB - puts the harvest at 110.9 million MT as per their latest crop survey . The difference stems from USDA’s assumption of higher planted area.
CONAB recently cut its estimate for planted area pointing to lower crop prices dissuading farmers from planting corn. Planting in Brazil is delayed from its usual schedule.
USDA is also optimistic about the Argentinian crop. It reduced its forecast for Argentinian corn by 1 million MT to 55 million MT in the latest WASDE report. However, that is still optimistic given the ongoing spread of spiroplasma disease. Last week, Argentina’s Rosario Exchange slashed corn estimates to just 50.5 million MT from a previous forecast of 57 million MT citing crop loss linked with diseases.
USDA estimates are 18 million MT higher than harvest forecasted by regional agencies across Brazil & Argentina. Corn supplies may end up being much tighter than the USDA is currently forecasting if harvests come softer than anticipated.
ETHANOL PRODUCTION IS LIKELY TO INCREASE CORN CONSUMPTION
USDA increased its forecast for corn consumption for ethanol production by twenty-five million bushels (635k MT) in the latest WASDE report. With gasoline and crude prices on a tear, ethanol blending into gasoline is likely to remain elevated during the coming months driving corn demand.
Sustainable Aviation Fuel (SAF) serves as another source of corn demand in 2024. The Biden Administration is set to release its primary climate model for SAF subsidies under the Inflation Reduction Act in the “very near future”.
While recent reports have stated that the model may be restrictive compared to corn-ethanol industry expectations, the subsidies will undoubtedly drive higher demand for corn-ethanol.
CORN FUTURES CONTANGO IS STEEPENING
Corn Futures term structure has become noticeably steeper over the past three months. Premium for dated contracts have increased. Specifically, corn delivery in later part of 2024 and early 2025 command higher premium.
MARKET METRICS ARE TURNING LESS BEARISH FOR CORN
CME Corn Options positions are currently skewed bullish with a put/call ratio of 0.84. Over the past week, bullish positioning has increased with large call option buildup on June (OZCN4) and December contracts (OZCZ4).
Asset managers have also started to reduce net short positioning on CME Corn Futures since positioning reached its all-time low mid-February.
HYPOTHETICAL TRADE SETUP
South America corn supply remains uncertain even as the US delivers a record harvest. Corn prices will remain bearish in the near term amid ample supplies. Longer term, supply shocks and rising demand has the potential to send corn prices higher. This is evident from steepening contango in CME Corn Futures.
To express the view on corn prices increasing towards the end of the year, traders can establish a calendar spread comprising of short position in September 2024 futures (ZCU2024) and a long position in March 2025 futures (ZCH2025). CME corn futures offer deep liquidity even for contracts in 2025 allowing such calendar spreads to be executed efficiently.
A hypothetical trade setup comprising of the calendar spread consisting of short ZCU2024 and long ZCH2025 also offers margin benefits. The calendar spread position is margin efficient with the entire position requiring margin of just USD 350 as of 15/April/2024.
This position not only benefits from the supply trend but also the seasonal trend in corn prices. Corn prices tend to rise from October through February due to seasonal factors. Between April to September, prices tend to decline. This hypothetical spread is supported by both trends.
• Entry: 1.06185 (ZCH2025/ZCU2024 = 485/456.75 as of 12/April)
• Target: 1.076
• Stop Loss: 1.052
• Profit at Target: USD 323 (Target price = 1.33% higher than Entry => Profit = 1.33% x notional = 1.33% x (485 x Contract Size) = 1.33% x (485 x 5000/100))
• Loss at Stop Loss: USD 225 (Stop level = 0.93% below entry => Loss = 0.93% x notional)
• Reward to Risk: 1.44x
MARKET DATA
CME Real-time Market Data helps identify trading set-ups and express market views better. If you have futures in your trading portfolio, you can check out on CME Group data plans available that suit your trading needs tradingview.sweetlogin.com
DISCLAIMER
This case study is for educational purposes only and does not constitute investment recommendations or advice. Nor are they used to promote any specific products, or services.
Trading or investment ideas cited here are for illustration only, as an integral part of a case study to demonstrate the fundamental concepts in risk management or trading under the market scenarios being discussed. Please read the FULL DISCLAIMER the link to which is provided in our profile description.

Grain Futures Gain GroundGrain futures are higher in the early morning trade as some as headline risk looms into the weekend.
Corn
Technicals (May)
May corn futures are fractionally lower in the early morning trade as prices linger near our pivot pocket from 431 1/2-435, which just happens to be right near the middle of first support and first resistance. We like the upside potential in corn but some of the deferred contracts have a more friendly technical landscape than the May.
Bias: Bullish/Neutral
Resistance: 441 3/4-444 1/2***, 447 1/2-450****
Pivot: 431 1/2-435
Support: 421-422***
Fund Positioning
Friday’s Commitment of Traders report showed that Funds were net sellers of about 8k contracts (through 4/2/24), that puts their net short position at 259,556.
Seasonal Trends
(Past performance is not necessarily indicative of future results)
Below is a look at price averages for December corn, using the 5, 10, 15, 20, and 30 year averages.
Technicals (May)
May soybean futures are fractionally higher in the early morning trade. Support from 1170-1175 will continue to be very important for the Bulls to defend through this week's trade. A break and close below could spark another wave of pressure. On the resistance side of things, they want to see a close above resistance from 1198-1205 1/2.
Bias: Neutral/Bullish
Resistance: 1198-1205 1/2***, 1212 3/4-1216***
Pivot: 1187
Support: 1170-1175***, 1161-1167****
Fund Positioning
Friday's Commitment of Traders report showed Funds were net sellers of roughly 3.5k contracts, trimming their net short position to 138,256 contracts.
Seasonal Trends
(Past performance is not necessarily indicative of future results)
Below is a look at price averages for November soybeans, using the 5, 10, 15, 20, and 30 year averages.
Wheat
Technicals (May)
Wheat futures broke out above trendline resistance last week which adds to the recent trend of higher highs and higher lows. If the Bulls can achieve a close above resistance from 568 1/2-570 we could see it open the door for an extension towards the psychologically and technically significant $6.00 level.
Bias: Neutral/Bullish
Resistance: 568 1/2-570***, 595 3/4-600***, 608 1/2-611**
Pivot: 550-555
Support: 525**
Seasonal Trends
(Past performance is not necessarily indicative of future results)
Below is a look at price averages for July wheat, using the 5, 10, 15, 20, and 30 year averages. Historically this isn't the most friendly time of year.
Check out CME Group real-time data plans available on TradingView here: tradingview.sweetlogin.com
Disclaimers:
CME Real-time Market Data help identify trading set-ups and express my market views. If you have futures in your trading portfolio, you can check out on CME Group data plans available that suit your trading needs tradingview.sweetlogin.com
*Trade ideas cited above are for illustration only, as an integral part of a case study to demonstrate the fundamental concepts in risk management under the market scenarios being discussed. They shall not be construed as investment recommendations or advice. Nor are they used to promote any specific products, or services.
Futures trading involves substantial risk of loss and may not be suitable for all investors. Trading advice is based on information taken from trade and statistical services and other sources Blue Line Futures, LLC believes are reliable. We do not guarantee that such information is accurate or complete and it should not be relied upon as such. Trading advice reflects our good faith judgment at a specific time and is subject to change without notice. There is no guarantee that the advice we give will result in profitable trades. All trading decisions will be made by the account holder. Past performance is not necessarily indicative of future results.
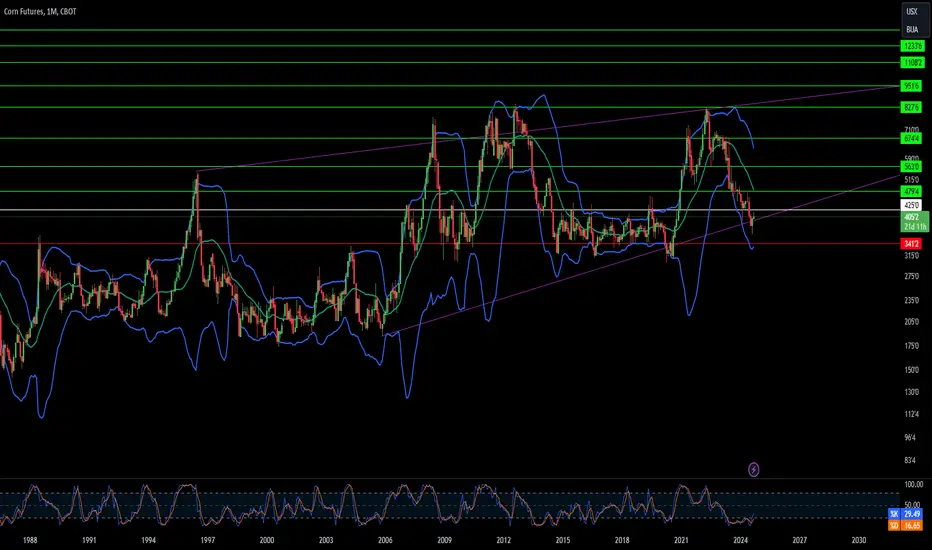
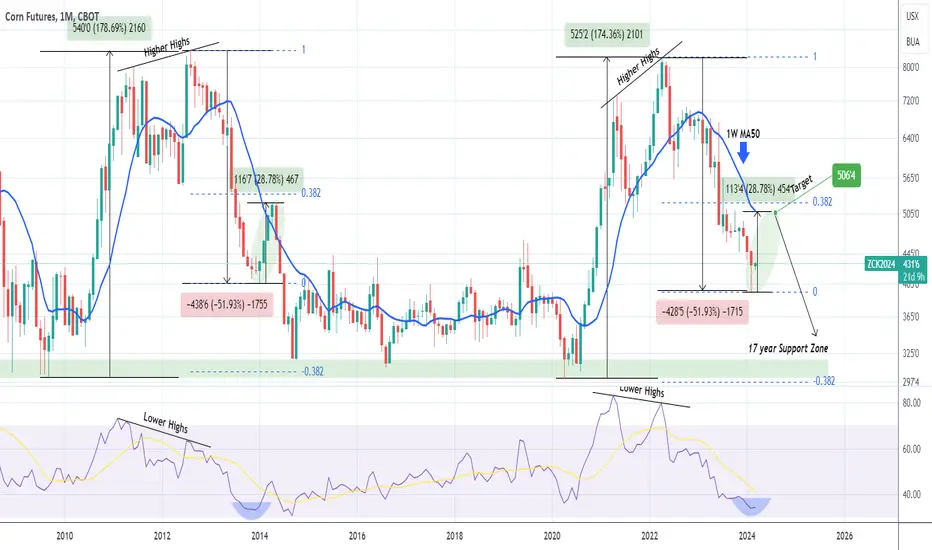
CORN Excellent 4-month buy opportunity.Corn's (ZC1!) price action since the COVID recovery in early 2020 is showcasing an amazing resemblance with the previous full Cycle of 2009 - 2014. This is better illustrated on the 1M (monthly) time-frame. Both started the Bull phase on a roughly +175% rebound on the 17 year Support Zone, topping on a Higher Highs (which was a Bearish Divergence with the Lower Highs of the 1M RSI) and then declined both astonishingly by -51.93%.
This is where the market is at now. In 2014 the price rebounded by +28.78% back above the 1W MA50 marginally and just below the 0.382 Fibonacci retracement level, before resuming the long-term decline to the 17 year Support Zone.
As a result, this presents an excellent 4-month buy opportunity with 506'4 as the Target (+28.78%). Notice also that the 1M RSI is on the exact same level (33.75) as it was on the January 2014 Low, and is reversing.
-------------------------------------------------------------------------------
** Please LIKE 👍, FOLLOW ✅, SHARE 🙌 and COMMENT ✍ if you enjoy this idea! Also share your ideas and charts in the comments section below! This is best way to keep it relevant, support us, keep the content here free and allow the idea to reach as many people as possible. **
-------------------------------------------------------------------------------
💸💸💸💸💸💸
👇 👇 👇 👇 👇 👇
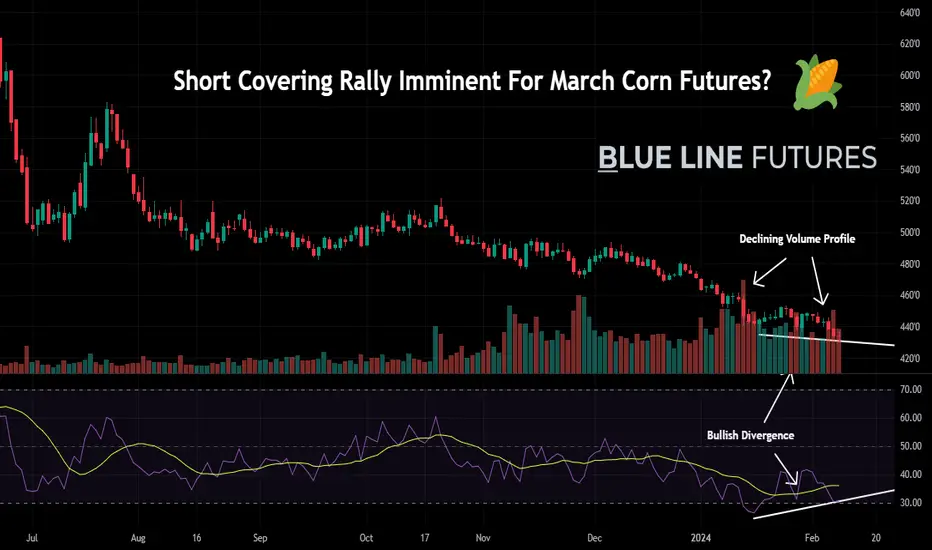
Is A Short-Covering Rally in Corn Imminent? There’s no beating around the bush - the fundamentals for corn remain bearish ahead of Thursday’s USDA report. Last month, USDA caught many by surprise revising ‘23 corn yields to record-highs of 177.3 bushels per acre. Since then, corn futures have continuously grinded lower. But, could a short-covering rally be in the offing soon?
Per the last CFTC Commitments of Traders report, managed money funds have amassed a net-short position of 280,151 contracts (combined futures & options). That represents the largest net-short position in corn since 2019. While corn has continued making new lows, each of the last 4 contract lows have come in conjunction with less and less conviction - namely bullish divergence on the standard 14-day RSI. Moreover, the volume profile has gradually softened since the January USDA report. Thus, it's possible that all of the bears have already sold. The first step in a short-covering rally is getting bears to stop selling - and a friendly WASDE report on Thursday bares the potential to make that happen.
Check out CME Group real-time data plans available on TradingView here: tradingview.sweetlogin.com
Disclaimers:
CME Real-time Market Data help identify trading set-ups and express my market views. If you have futures in your trading portfolio, you can check out on CME Group data plans available that suit your trading needs tradingview.sweetlogin.com
*Trade ideas cited above are for illustration only, as an integral part of a case study to demonstrate the fundamental concepts in risk management under the market scenarios being discussed. They shall not be construed as investment recommendations or advice. Nor are they used to promote any specific products, or services.
Futures trading involves substantial risk of loss and may not be suitable for all investors. Trading advice is based on information taken from trade and statistical services and other sources Blue Line Futures, LLC believes are reliable. We do not guarantee that such information is accurate or complete and it should not be relied upon as such. Trading advice reflects our good faith judgment at a specific time and is subject to change without notice. There is no guarantee that the advice we give will result in profitable trades. All trading decisions will be made by the account holder. Past performance is not necessarily indicative of future results.
EU faces pressure to defuse mounting anger as farmers protest aGiven the mounting anger and protests by farmers across Europe, there appears to be a significant challenge stemming from contradictory and potentially detrimental agricultural policies. The grievances include increased costs for agricultural diesel, additional fees for water consumption, complex regulations, and objections to bans on pesticides and herbicides mandated by the EU's Green Deal. The farmers are also concerned about the import of beef from countries like Brazil and Argentina, which they argue have laxer rules on animal welfare, making competition difficult.
This unrest, originating in France but spreading to neighboring countries, signals a broader issue with unpredictable government decisions affecting agriculture. In the Netherlands and Germany, similar protests have arisen over regulations to cut nitrogen emissions and phase out fuel subsidies, respectively. In Germany, there is also resentment over what is perceived as the unfair application of environmental policies.
With protests extending to Poland, Romania, Slovakia, Hungary, and Bulgaria, concerns range from unfair competition from cut-price cereals to high taxes and tight regulations. The impact of droughts, floods, and wildfires, combined with the squeeze from green policies, has fueled discontent.
For investors, this could be a pivotal moment to consider commodities such as cereals, soybeans, and copper. The disruptions in European agriculture may create fluctuations in the market, making these commodities potentially attractive for investment. However, it is crucial to monitor developments closely as tensions continue to grow, and the agricultural sector shapes up to be a major issue in the upcoming European Parliament elections in June.
