ZC1! - Corn Futures - What to expect on 2hr.I like when charts show fresh highs, you just let it do its thing till it signals which way its about to go. Looking to get short on this one as its coming up to a nice past resistance level. Not financial advice. Trade safe.
CORN
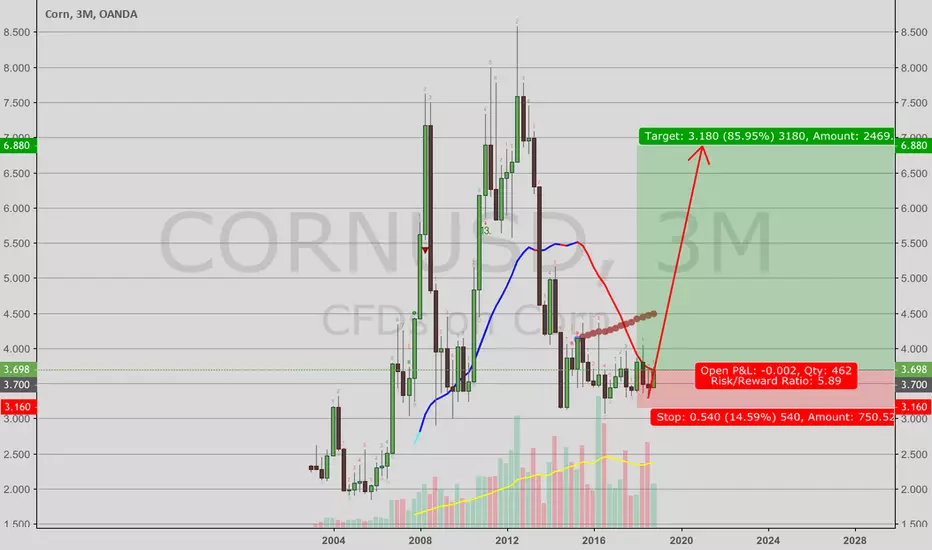
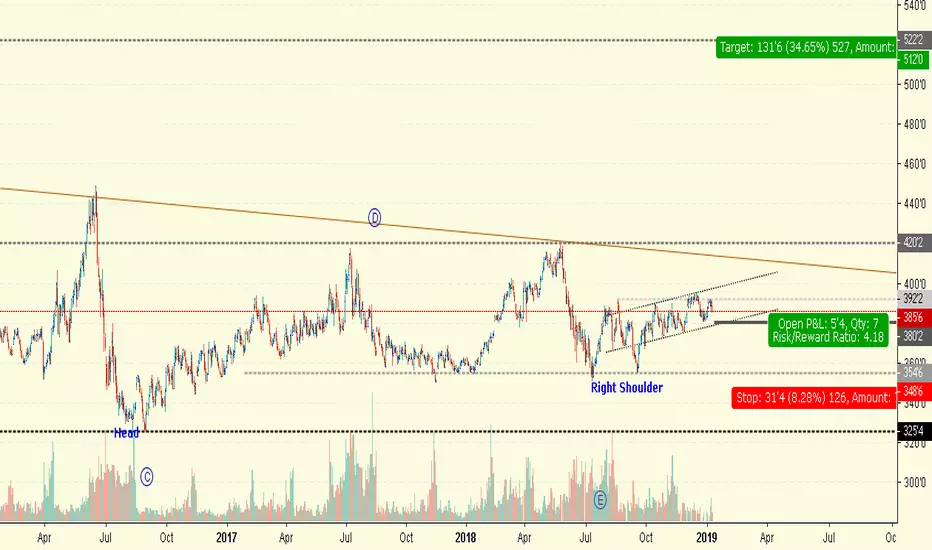
We break this Line and Game on to 2011 HighsCorn plantings around the world are extremely behind schedule. As corn's plant by date passes prices will skyrocket. The red line is the range breakout area to go long for a parabolic move.

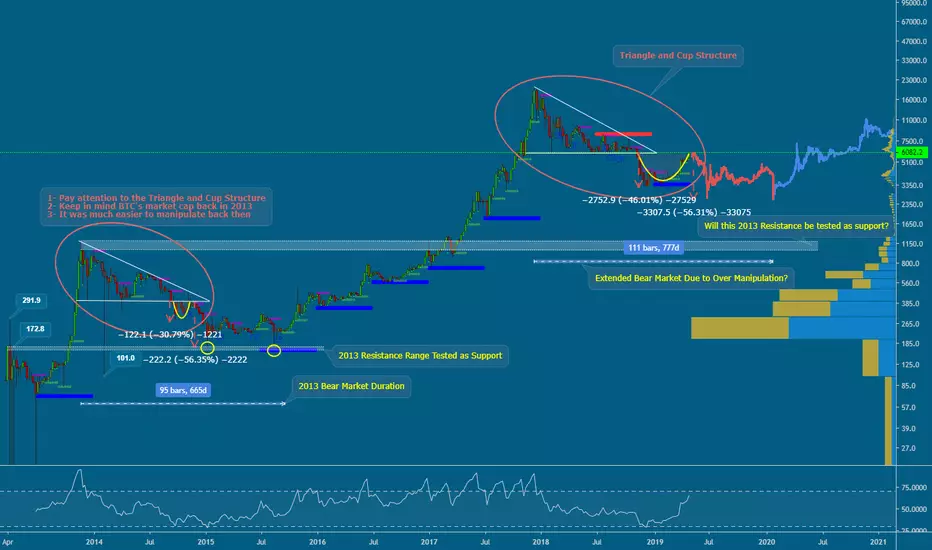
Short Term BearMewn Bois for wutever reason think that after all the manipulation during this bear market the current bear market will be shorter than the previous one! Anal-yze this and think again! ;D
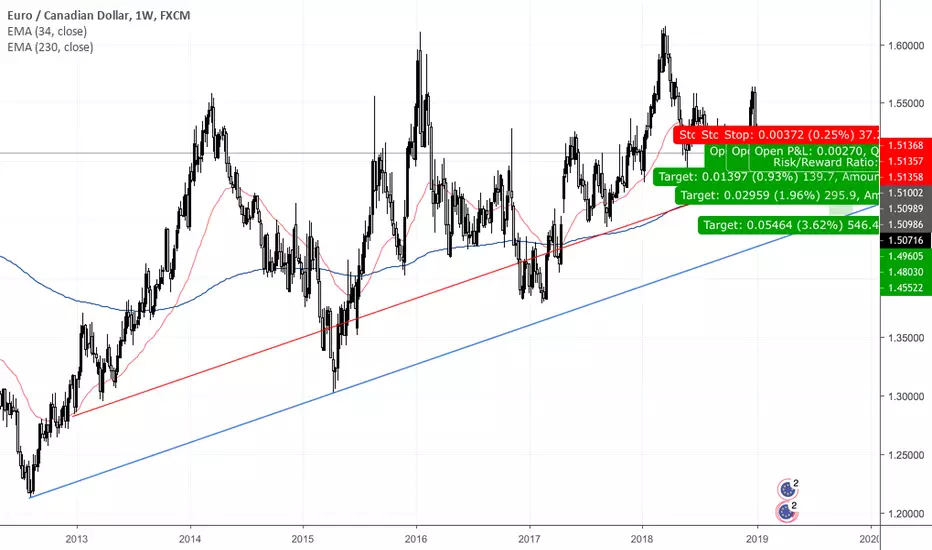
Ideas on EURCAD: Long Term Short This pair has huge potentials on heading down. Previous high on Mid-march 2018 doesn't impressed that many traders, and it's been forming a weird H&S pattern. I may set a sell order at 1.51. expecting to hold for a while with positive swap income as well.
Sell Order: 1.51
TP 1: 1.4963
TP2: 1.4808
TP3: 1.455
SL: 1.5137
Resistance & Excessive SweatingAs we come up to bat against this resistance once more, it's important to remember to stay hydrated and keep those electrolytes up as the price does its best impression of the little-engine-that-could in mid-air.
This is not a spot where the TA is super clear, it's primed for a fakeout in either direction.
For the bullish case we have made some lower highs and broken upward out of the downtrend that saw us hit a yearly ATL, the price is is also still bouncing off diagonal support while it holds in the 4k-ish area with more stability than it has in the past.
For da bears it's not a higher high, and the last touch up into the 4k's missed the mark too....which is never a good sign. It's leaning on the support it has established a bit more heavily as well, and there isn't any notable volume going on yet to support a strong break upward. Frankly, the price action looks a bit tired...but Bitcoin has always been willing to play head games that would put Brent Crude traders in a mental ward; so, as always anything can happen.
As far as the psyops, it's a juicy short opportunity since setting a tight ass stop is easy, especially for all the 5m chart scalpers...which can lead to all sorts of types of traders piling on for a short at this point. Bitcoin bulls are also completely irrational when it comes to short term trading and whatever horribly disfigured HODLr's have managed to stay alive and are still waiting for a run to 10k have gone so far beyond suffering they'll be foaming at the mouth to see BTC break upwards.
S t a y f r o s t y .

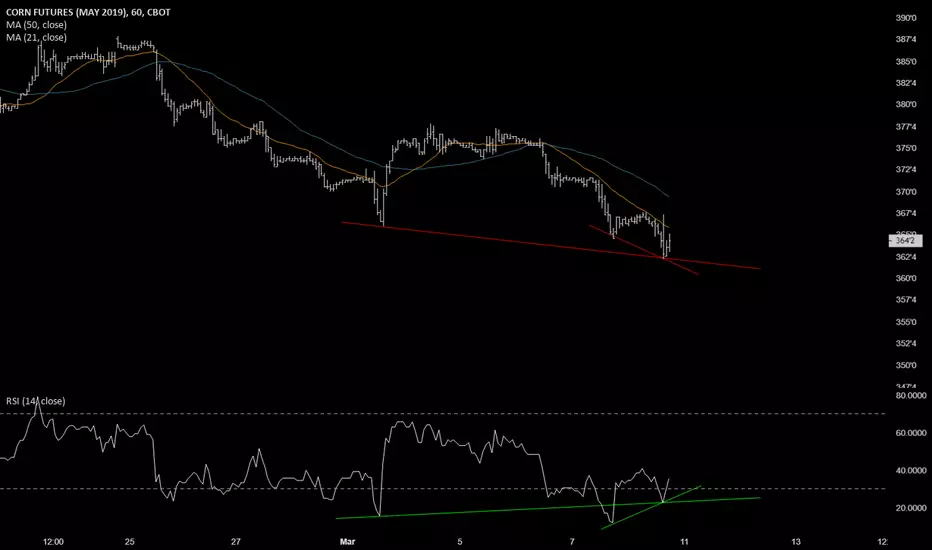
BULLISH DIVERGENCE MAY CORN two cases of clear bullish divergence here on the 60 min chart. new contract low was made during the last session.
I expect some short covering into the beginning of the week, a bounce off the lows signaled by the bullish divergence is possible. I could also see some further pressure occur until the bounce materializes
Everything here is purely my opinion, and in no way advice or recommendations on making trades. I may or may not hold positions in the instruments I analyze.

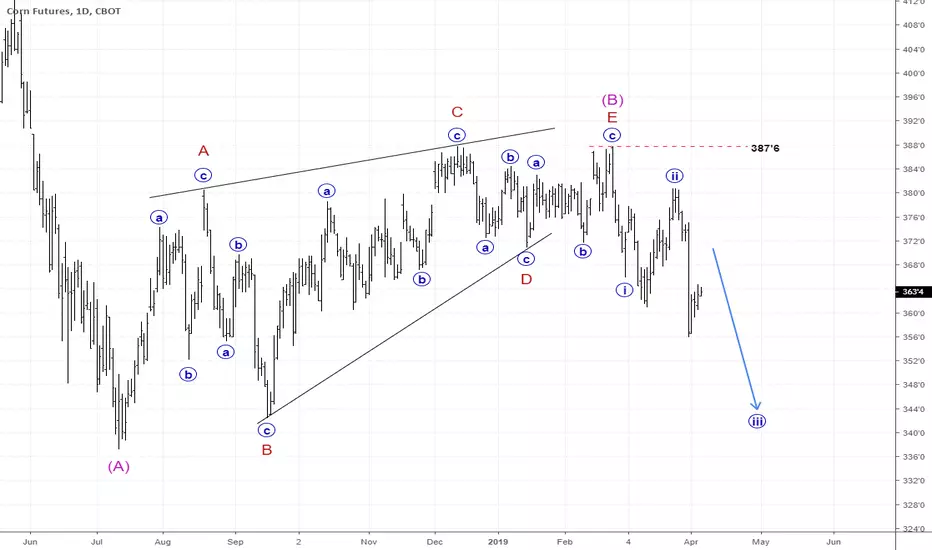
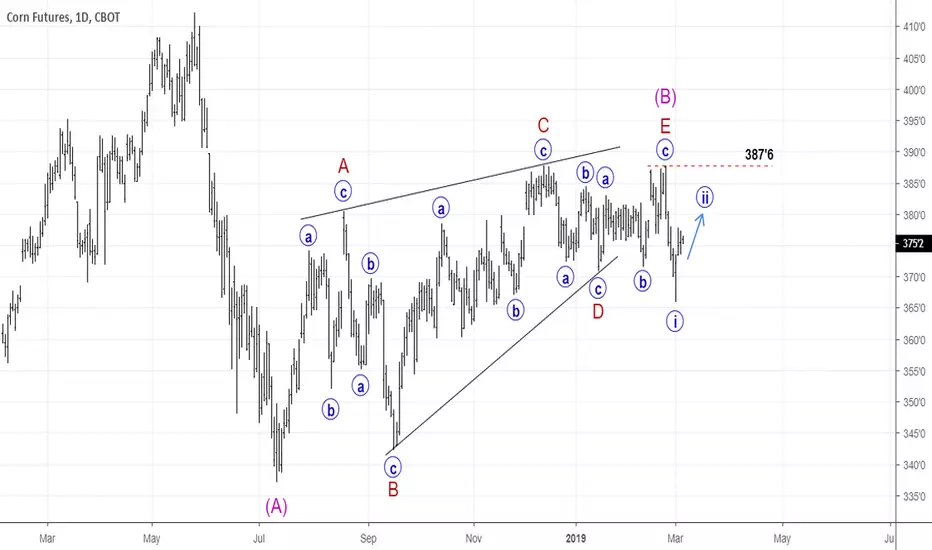
CORN DAILY CHART ANALYSISKey Level: 387’6
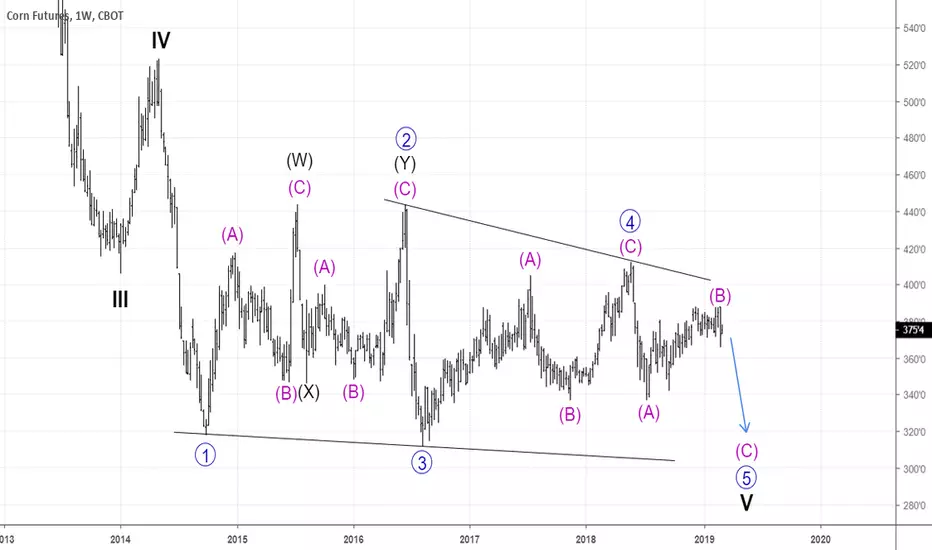
I’m working on the idea of triangle wave (B) complete and wave (C) is developing into 5 wave motive structure.
By using Elliot rule of “WAVE 2 never retrace 100% of wave 1”, we can establish an invalidation level that served as our key level of this analysis.
If wave (B) complete, corn has no business to go above 387’8 level and I’m looking forward to short with corn in wave 3.
Let’s see how corn market develop in the next coming days, week and month :D
Please leave a comment if you have any idea and suggestion to improve this corn analysis.
Happy trading

Corn Futures? A big question mark.What is going to happen with ag commodity futures in the coming months. Where are we going?
We are getting closer to the ever so important growing season in the United States, and ag futures have been stuck in a rut. Specifically corn.
February 8th, the USDA released another one of their important reports and traders saw a decrease in stocks/yield as well as other juicy information. Overall the report was nothing to get the market too excited. After the close us traders saw yesterday, it leaves me even more curious of where these futures are going to go.
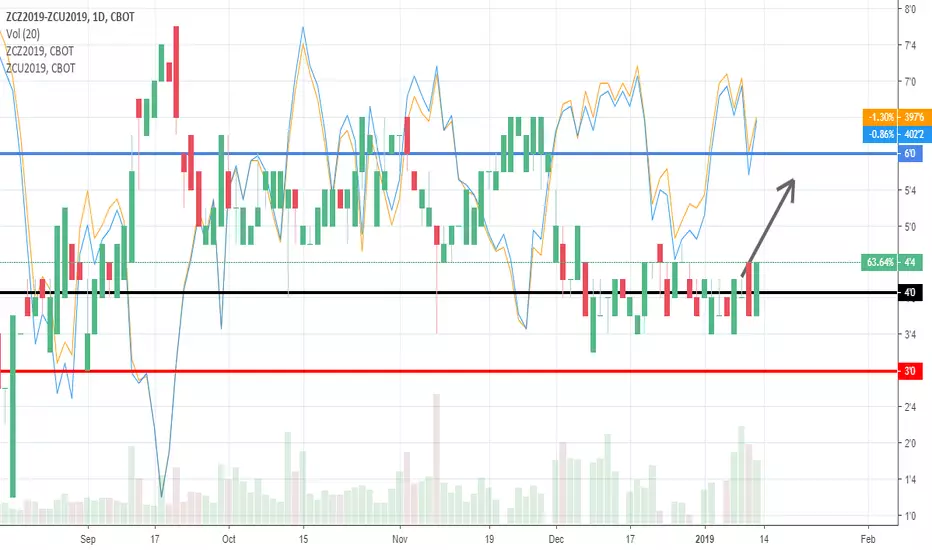
From a chart prospective, we have seen strong congestion in corn futures. Looking at the chart here for CZ9 (dec 19), you can see a possible ascending triangle. I am not completely convinced.
I am torn fundamentally with the idea of larger acres coming and then throw in the size of the corn carry out, which is lower than we have seen in a while.
Off the cusp there are a few very interesting variables at play in the ag futures world. Throw in the continuing trade negotiations and every analyst prediction is radically altered.
For now it will be interesting to sit back and watch how this unfolds.
Comments always encouraged.
Everything here is purely my opinion, and in no way advice or recommendations on making trades. I may or may not hold positions in the instruments I analyze.
L.R.

CORN USD BUY (CORN – US DOLLAR)Hi there. Price is forming a continuation pattern to the upside. Wait for the price to hit the bottom of the pattern and watch strong price action for buy.
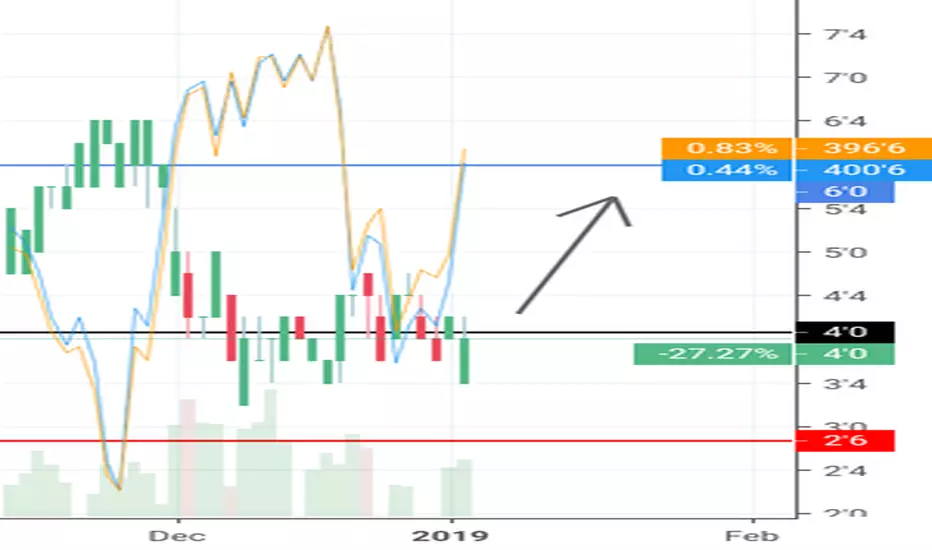
#ZC_F $ZC_F #Corn – BEAR SPREADThe corn bear spread offers quite nice RRR 1:2. I have already entered at 4,0. My SL is set at 3,0 ($50/contract) and my PT at 6,0 ($100/contract).


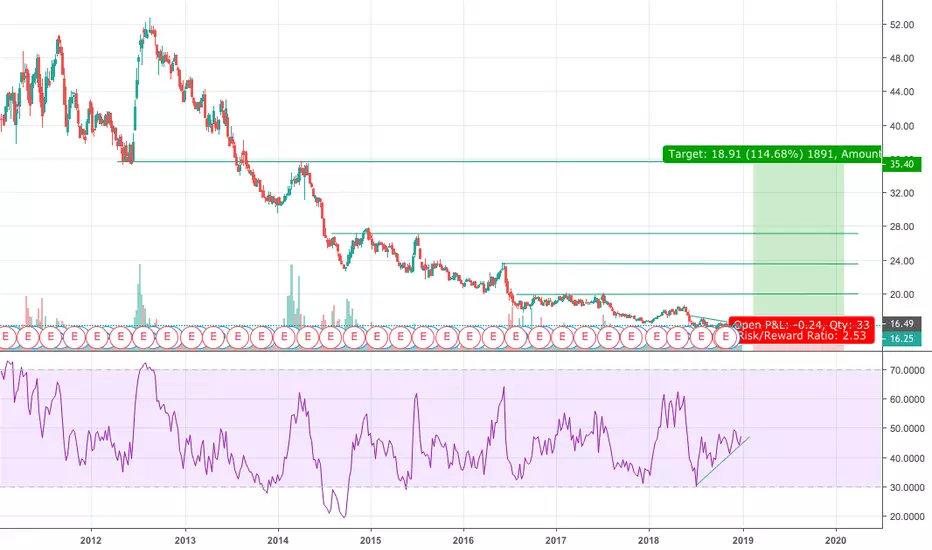
Long the CORNKeep it simple stupid.
I will buy on breakout to the upside with volume. Or, more conservatively, wait for a retest after breakout.
Entry around $16.5. Resistance levels marked on the chart at $20, $23, $27, etc.
Why would I make this trade?
> CORN consolidating...CORNSOLIDATING!
> RSI Increasing
> Equity prices are falling across the board. See the DOW and S&P500.
> Commodity prices are rising as investors move into safer assets. See WEAT, Silver, and Gold.
> Corn is king. And used for food, packaging, and fuel.
What will happen as the world enters recession, instability, climate change, maybe war? Which assets will capital move into?
Rule yourself.
*This is not investment advice*
#ZC_F $ZC_F #Corn – BEAR SPREADThis bear spread is quite cheap. I see a potential to grow to price 6,0. There is a strong S/R zone. Entry 4,0 / SL 3,0 ($50/contract) / PT 6,0 ($100/contract)
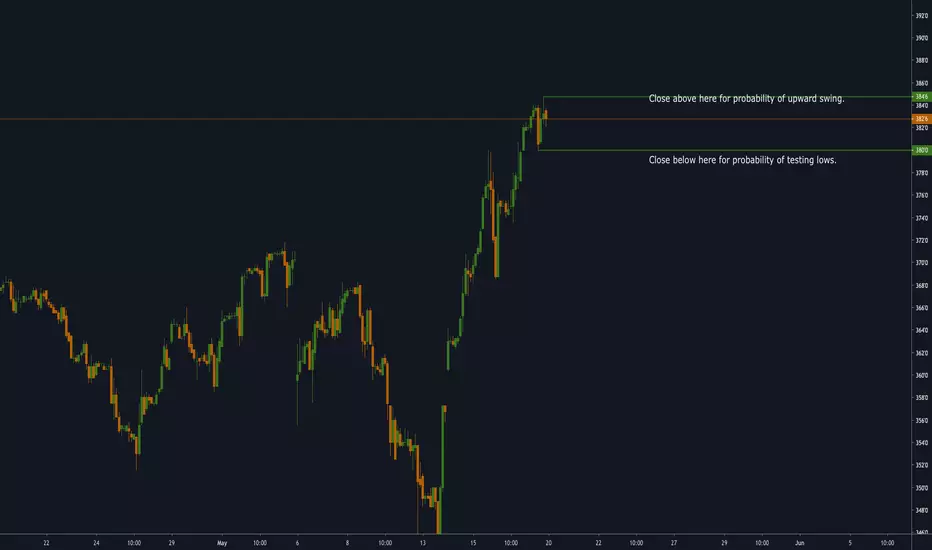
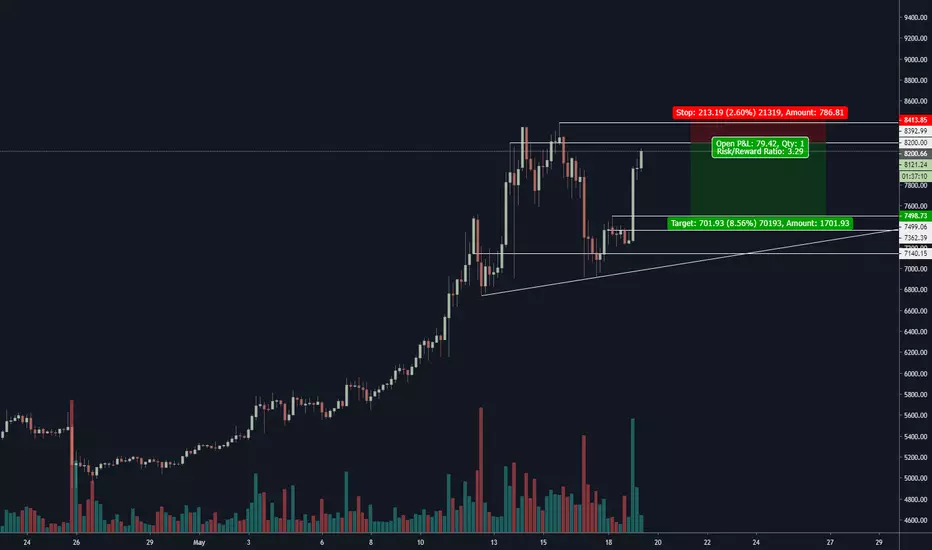
BitcornBitcoin possible inverse head and shoulders pattern with increasing RSI on 4H chart. High volume break of 4500 confirms pattern breakout with a target of major resistance in the 5700 range. Breakdown below 3700 invalidates pattern suggesting a test of the lows. Hold on to your bread shits about to get real