CORN

Corn and other Soft Grains look Bullish 2018 $ZC_F interest rates going higher, enjoy the pull of inflation for your grains, that and colder weather forecast forget global warming, how about the cooling that is reality?

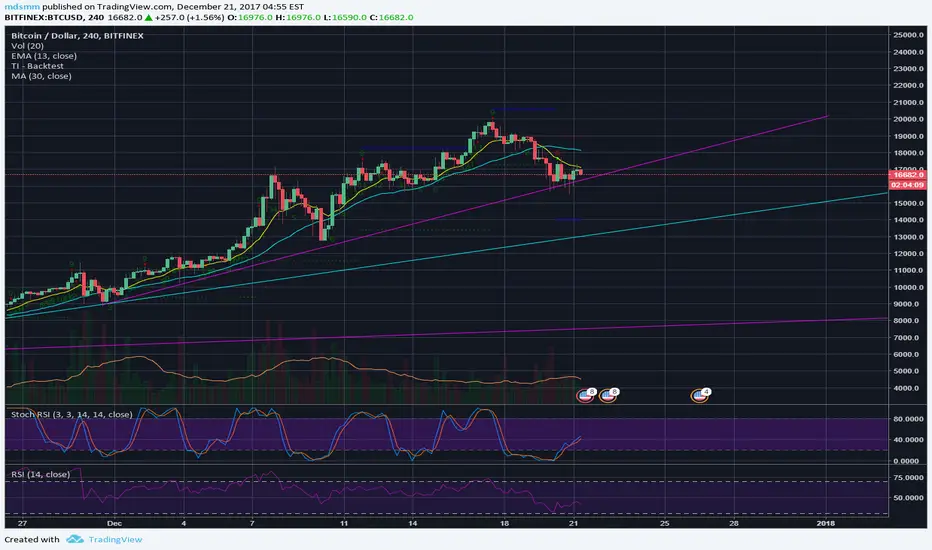
21/12/2017 - BTCUSD - update21/12/2017 - BTCUSD - update
With the BCH fuzz, bitcoin took some hits lately. + Congested network which could be solved if everyone would upgrade to Segwit..
Lots of interesting stuff going on.
Bitcoin seems pretty weak at this point, don't use too much leverage as it might take another leg down.
Always keen to enter a discussion here, or let me know your comments.
This is no financial advice
Risk management IS KEY
Trade accordingly – use SLs
Trade at your own risk
Follow me on Twitter: twitter.com
Margin trading at Bitmex: bitmex.com/register/sxj5Eo
Trading at Binance: www.binance.com
Tips are welcome, but not at all necessary
BTC: 18D82nnqc7H3P3WuSB5gtJPnkJwPzYHkEj
LTC: LUTu5GeihTGhpDUtFAiHpVAZJo24r3LVyh
ETH: 0x57575b1b0950cae3a8d10ae7443c5a0b95465c86
15/12/2017 - BTCUSD - Rising wedge on larger time frames15/12/2017 - BTCUSD - Rising wedge on larger time frames
Smaller time frames are bullish, however looking from a larger time frame, we see that there has been a rising wedge for a week.
BTCUSD Longs are increasing, BTCUSD Shorts maintain around the same level. - take in mind that all those longs will take profit at some point.
Trading the breakout?
- expect a lot of stop losses getting hit (either way)
Always keen to enter a discussion here, or let me know your comments.
This is no financial advice
Trade accordingly – use SLs
Trade at your own risk
Follow me on Twitter: twitter.com
Tips are welcome, but not at all necessary
BTC: 18D82nnqc7H3P3WuSB5gtJPnkJwPzYHkEj
LTC: LUTu5GeihTGhpDUtFAiHpVAZJo24r3LVyh
ETH: 0x57575b1b0950cae3a8d10ae7443c5a0b95465c86

10/12/2017 - BTCUSD - update10/12/2017 - BTCUSD - update
BTC fell through previous channel.
Now trading again in an upwards channel within the bear channel.
Always keen to enter a discussion here, or let me know your comments.
This is no financial advice
Trade accordingly
Trade at your own risk
Tips are welcome, but not at all necessary
BTC: 18D82nnqc7H3P3WuSB5gtJPnkJwPzYHkEj
LTC: LUTu5GeihTGhpDUtFAiHpVAZJo24r3LVyh
ETH: 0x57575b1b0950cae3a8d10ae7443c5a0b95465c86

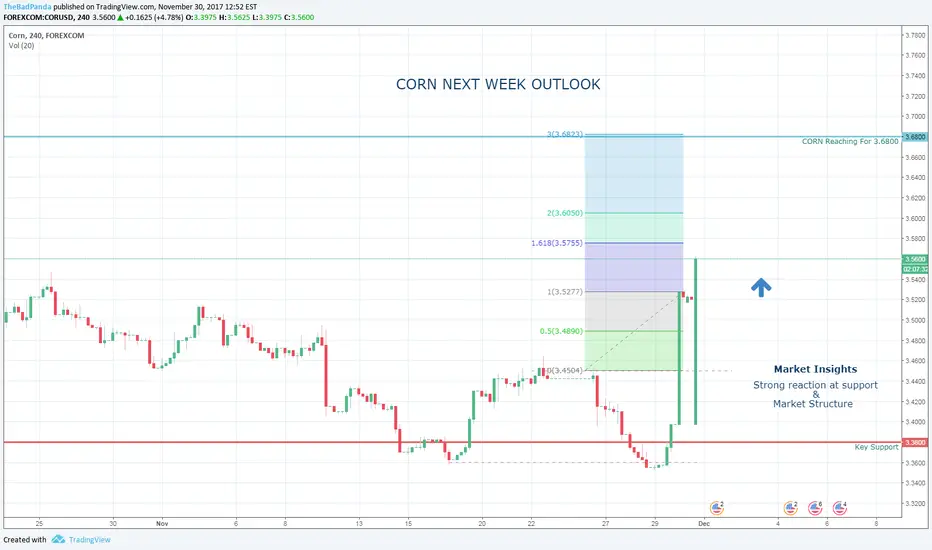
Seasonal Swing In CORNIt must be thanksgiving and Christmas because CORN has been looking ready to pop for some weeks now. December/January is a typical bullish swing for CORN.
I expect price to move up into the 3.68 level in the coming week or two. Beyond that will be hard to say. There is some strong Bearish market structure lurking around.
Note: All ideas expressed here are presented solely for learning and educational purposes only. Any gains or losses assumed by trading ideas presented by The Bad Panda are done so at your own risk.
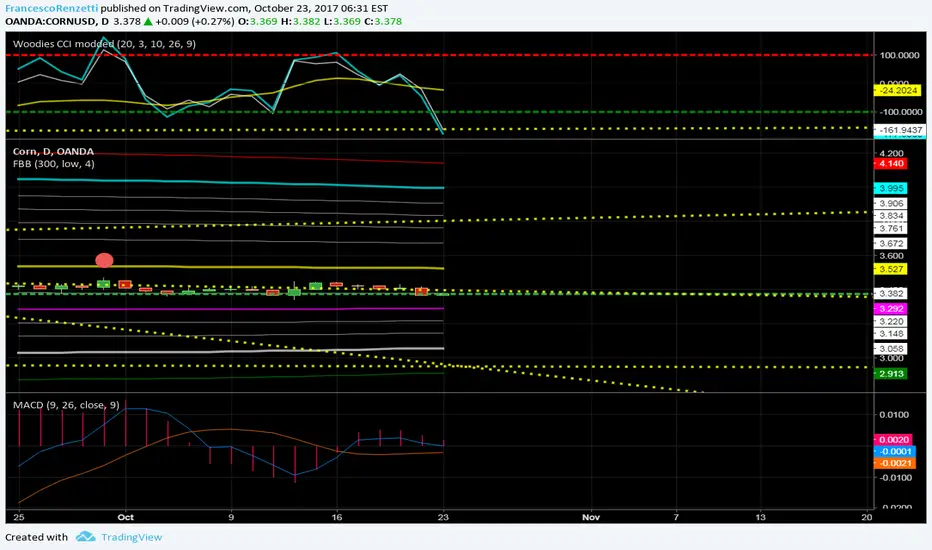
Corn , possible huge breakup in 3/8 daysCCI long deep sold is changing.
get ready , dont use capital you cant afford to lose.
good luck
fr
LArgest 4 or less traders in corn by GROSS Positions Please review CME group commitement of trader's report (4 or less largest)
As of Date: 7/3/2017Total OI: 1,753,868
Long - Short
156,094 --- 175,387
As of Date: 7/11/2017Total OI: 1,840,817
Long - Short
167,514 --- 213,535
As of Date: 8/22/2017Total OI: 1,874,724
Long - Short
185,598 --- 243,714
As of Date: 8/29/2017Total OI: 1,707,700
Long - Short
158,816 --- 203,216
Asset Active months March (H); May (K); July (N); Sep (U); Dec (Z)
CORN ZC
Open Interest :
Highest 2,080,000 contracts Average: 1,775,000 contracts
Lowest 1,470,000 contracts
Asset managers OI Date OI on date Percent of OI Ave. OI net
Most Bulish net OI 342,893 21/08/2012 2,073,500 16.54 1.48
Most bearish net OI (229,176) 8/3/2016 1,687,116 -13.58 Previous Change
current (64,945) 29/08/2017 1,707,700 -3.80 -0.91 -2.89
Producers OI Date OI on date Percent of OI Ave. OI net
Most Bulish net OI (13,396) 5/11/2013 1,941,041 -0.69 -13.65
Most bearish net OI (555,715) 14/06/2016 2,088,225 -26.61 Previous Change
current (231,883) 29/08/2017 1,707,700 -13.58 -13.72 0.14
Swap dealers/ deal OI Date OI on date Percent of OI Ave. OI net
Most Bulish net OI 305,017 7/10/2014 1,893,351 16.11 13.18
Most bearish net OI 197,349 13/06/2017 1,923,781 10.26 Previous Change
current 234,747 29/08/2017 1,707,700 13.75 12.11 1.64
Other reportables OI Date OI on date Percent of OI Ave. OI net
Most Bulish net OI 134,212 8/11/2016 1,751,431 7.66 4.40
Most bearish net OI 21,663 17/07/2012 1,916,920 1.13 Previous Change
current 63,374 29/08/2017 1,707,700 3.71 3.01 0.70


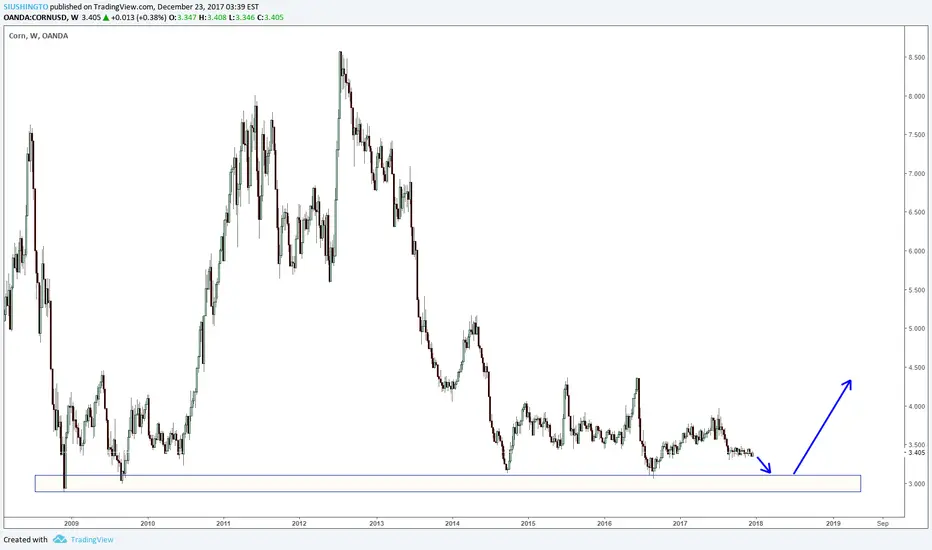
Corn Preparing to Turn?Corn has been decelerating for quite a few months now and is currently rejecting key resistance (monthly 200ema/200ma + monthly fibs) with a high-test.
Price action seems to be hinting at a turn from here in the near future down to $302.00, the September '09 low that sent us into an enormous rally to form the '12 highest high. I'm watching for a rejection of this 09' level over the next year or two that should align with the bottom in wheat. I expect a HUGE rally following that bottom to retest $746.00
---
Checkout my website @ PatsTrades (link is on my profile page below my picture) for my analysis on other trades like this and subscribe to avoid missing out on ideas and entries.
Thanks!!

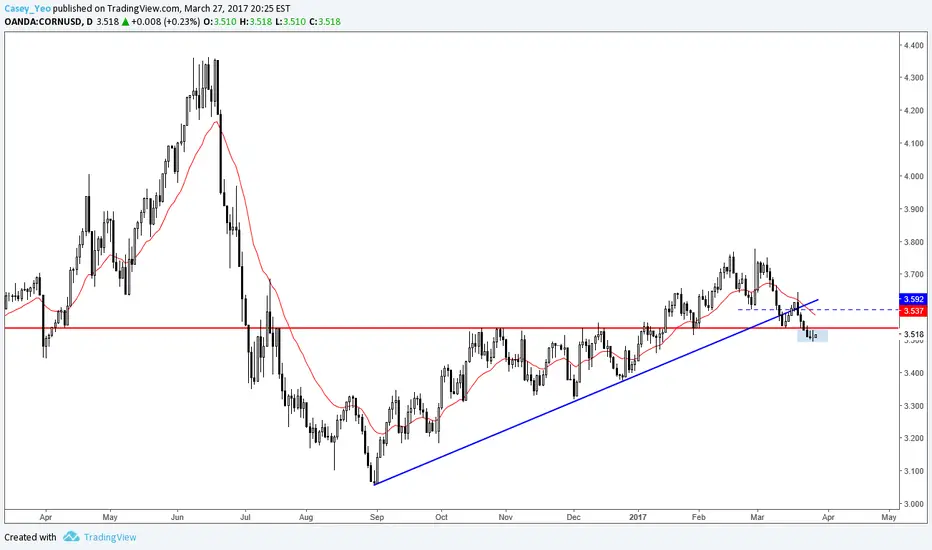
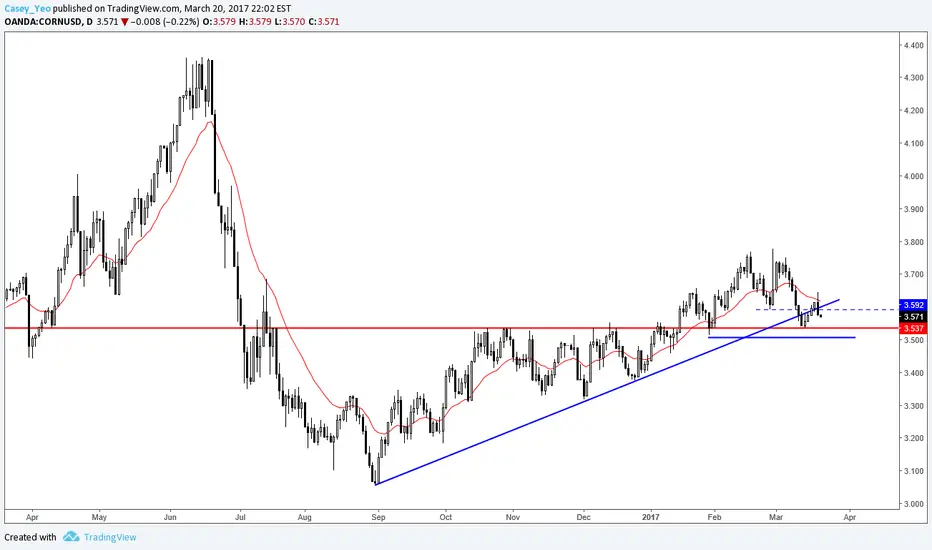
Corn setting a base for up trendThe monthly cornusd chart looks like it is setting up a base for a new uptrend to begin.
October '15 new resistance->support line at 3.502. Price has closed and held above this line for past 4 months.
+DI up and ADX is rising though still below 0
TRIX divergin with price since 2014 with 3 points of focus
Stoch coming off oversold and moving up
Weekly
3.644 last key resistance->support with price currently sitting on it.
Though below 20, +DI and ADX beginning to trend up. The TRIX near 0 but remains positive
Daily
In all 3 time frames, ADX and DMI are not that strong but positive. TRIX put in a sup->res line at 3.648. Price is currently spinning on this point and will be key to hold if price is to move higher from here.

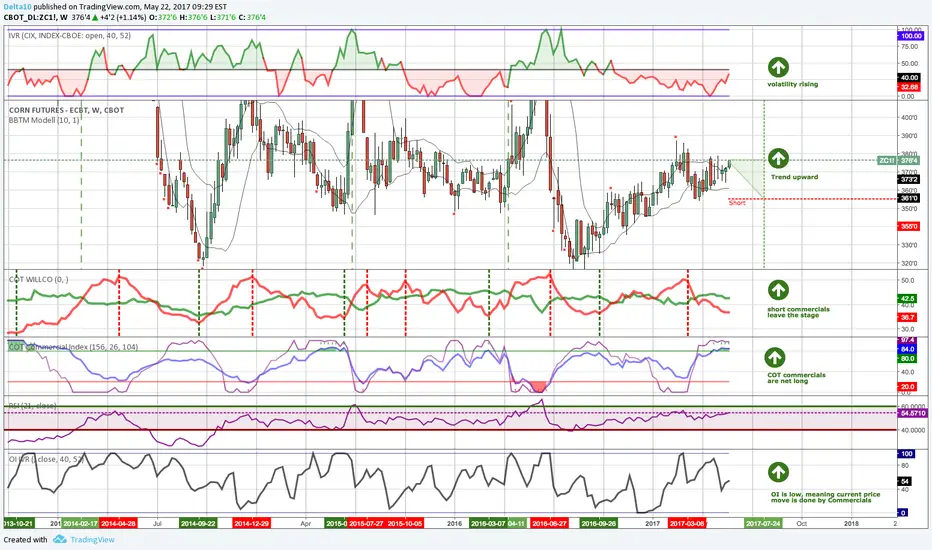
short PUT on CornAccording to the seasonal pattern (summer rally), Corn Future is on its move to higher ground also raising volatility along its move upward. This trend is supported by the commercials' net long position, which comes from the closing out of the short positions. OI is rather low, meaning that public is not the driving source behind the price movement.
Option Trade Idea:
short Put 355
duration 60 days (July 17th 2017)
Premium: 1 7/8 (x5000) = appr. 100$ per option
Delta: 11
Volatility: 22.2%
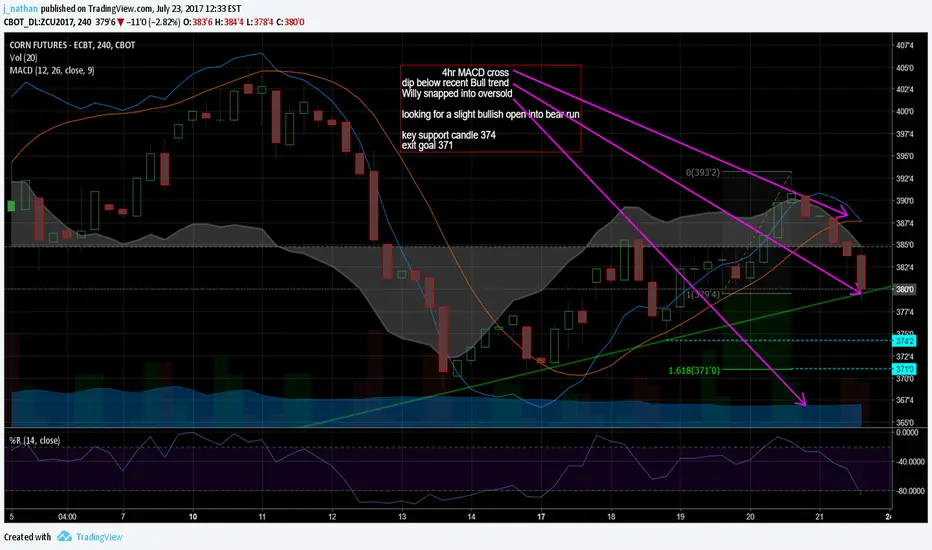
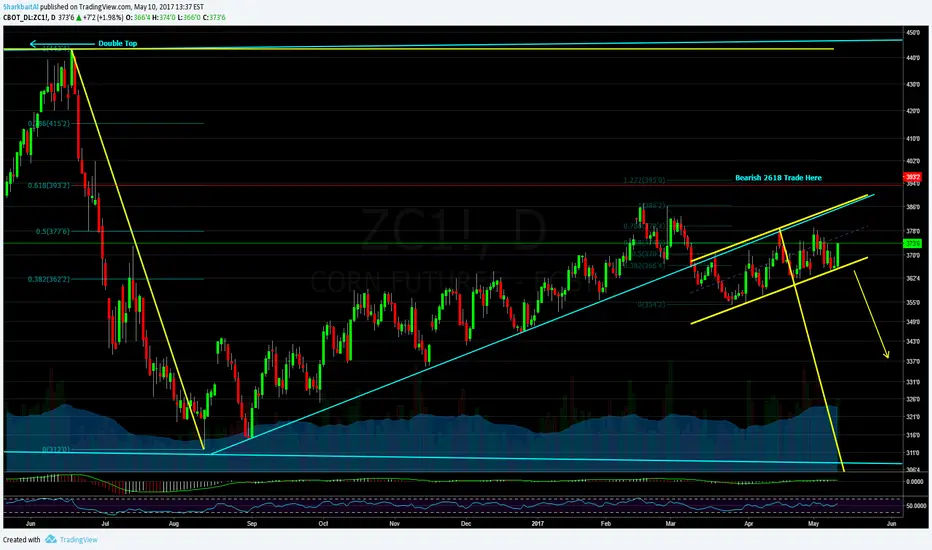
Corn: Bear Flag Under the TrendlineLooks like a flag to me.
My indicators do not yet align with the idea on this time frame...I will update using lower time frames below.
Also note the bearish 2618 set-up which completes @ 393.
If you have any comments or feedbacks on this idea or your own view on Corn, please share!
Corn Bearish CypherJuly Corn is falling from downtrend line last 4 days creating a bearish Cypher pattern. Target for today 364. After that a potential target of 356'2 to bottom out RSI.
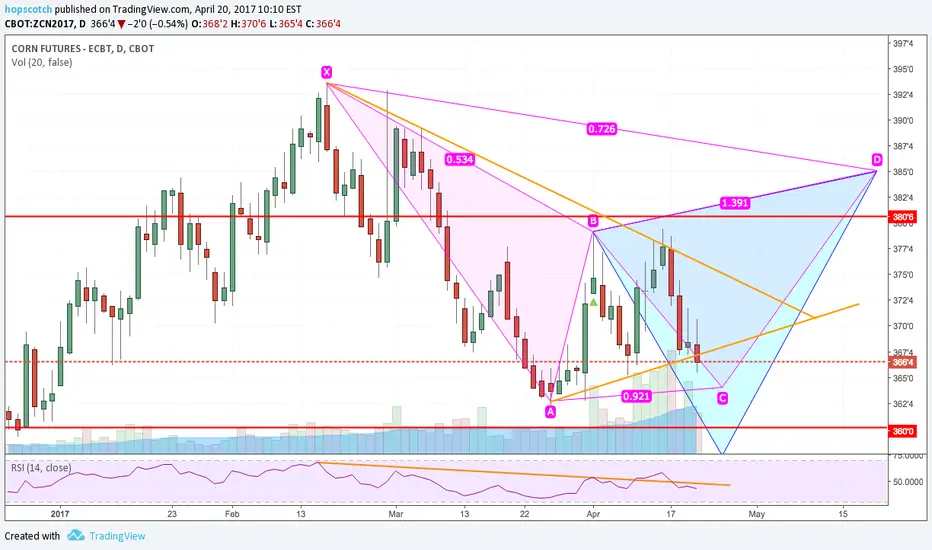
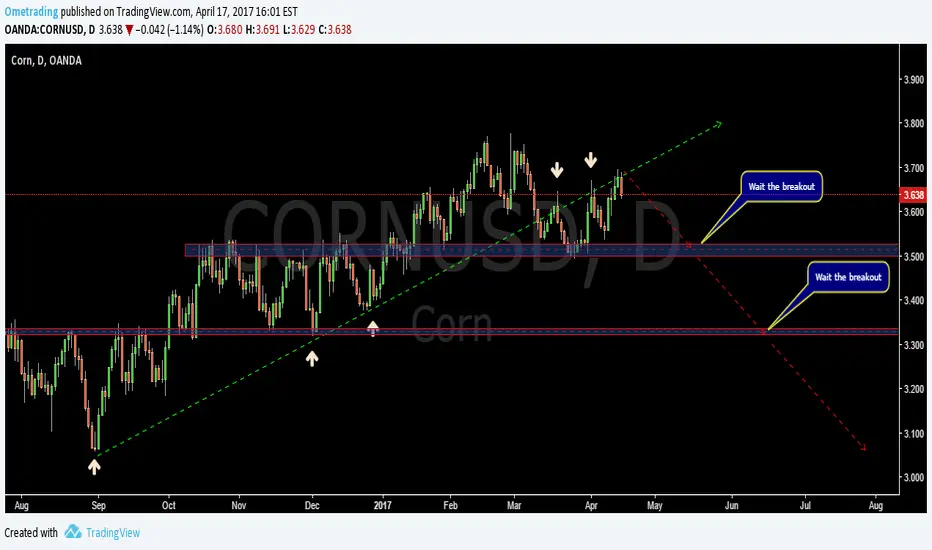
Breakout-CORNCORN price has broken bullish trend. Pullback has finished and breakout is confirmed. We can expecet some bearish movement till 3,5 level. If its broken, bearish movent can be projected till second support structure 3,3 aprox.
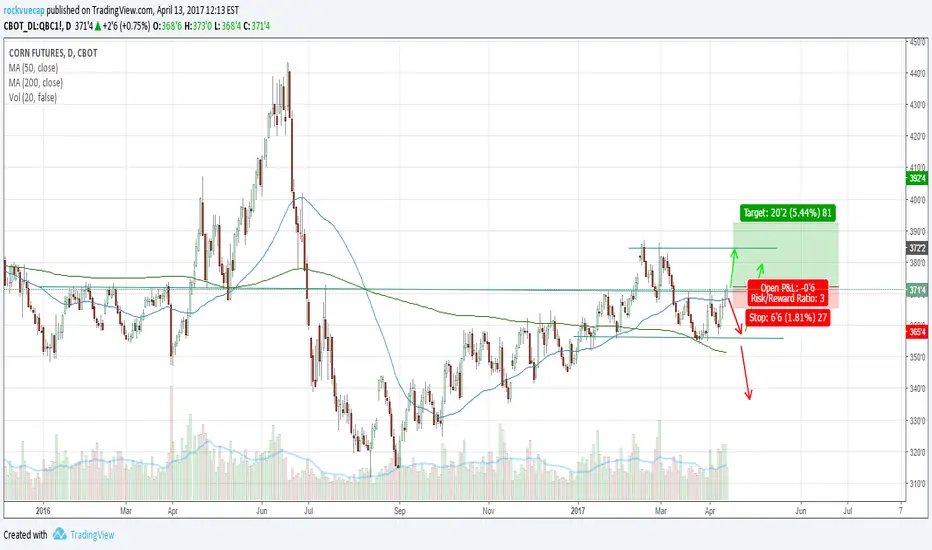
Corn Futures Breaking Year Long Resistance LevelI believe this is my first post about Corn Futures, so let's see how this goes! Daily charts so that corn futures are trading within a channel, with resistance being the 50 MA and the support line being the 200 MA and the price support level of 356. Corn Futures shot up today above both the 50 MA and the resistance portion of the channel in which they were trading.
That price resistance level of 370 goes back into the start of 2016 and has carried with force except for last April when Corn Futures shot past it and ballooned up to 440.
The reason I like using TA is that you can easily see the human nature of the markets. Being irrational beings, we influence markets without even thinking. Most of the TA that I do is based on the overlying assumption that it is a self fulfilling prophecy, where it matters only because other investors and traders think it matters. Regardless, there could be a play here.
Am I suggesting that Corn Futures will rise into the 400s again? No. I have no idea where corn futures will go. I'm trying to give myself the best probability of being on the right side of the trend.
The setup I would use to play this bullish trade would be to enter right above the 50 MA breakout. I would put my stop at 365.4, which is just below the 50 MA. To me, this makes sense because any move lower than that would discredit my bullish hypothesis.
With the stop loss at 365.4 I would begin to take profits at the 390 level. This gives me a risk reward ratio of 3:1.
All the best,
RC
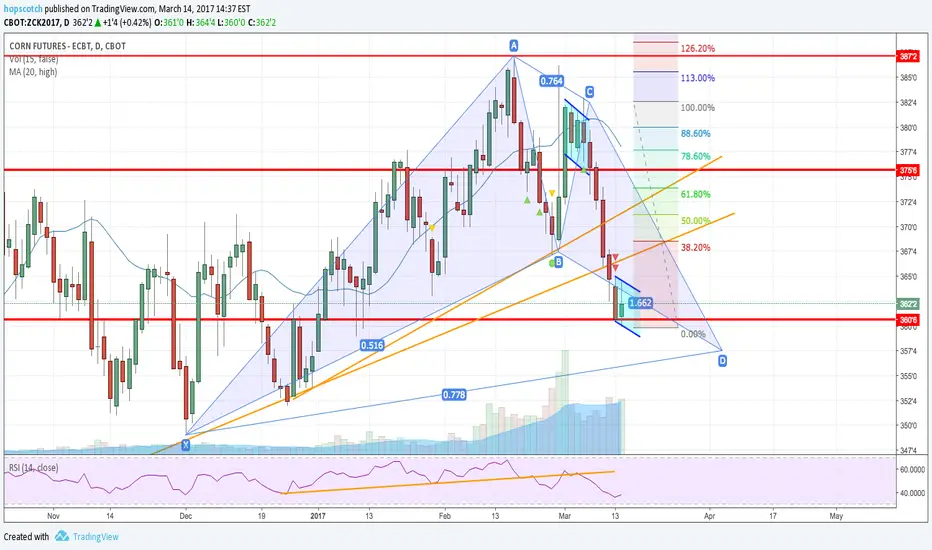
Corn Up on USDA ReportLower acreages on Corn have provide an upsurge. Next upside target for Corn is above the 50 day moving average at 380'6 to test resistance. Looking for completion of a bearish butterfly on spring rallies.

Corn forming CypherMay Corn is forming a Cypher pattern on another down day. Market bought it back somewhat, but we will probably see another down day to 357'4 area. RSI is still down, and Open Interest is starting to roll suggesting a turn. Could see mixed to further down selling until end of week.

Corn Bullish FlagMay Corn created a bullish flag today. Waiting for confirmation tonight and into tomorrow. Corn hasn't made complete 78.2 fall, but this may be as low as corn goes for the moment for a retrace. Flag has both candles pretty close to the same size which is a good sign. Also looking for start of corn in around mid of flag. Upside target 368'4