Corn - buy time My view - Corn looks to be setting up very nicely just a bit more dip would be great and im in
CORN
Bearish Corn on USDA reportMay Corn fell further today. Came to trend line. USDA report bearish. Looking for Corn to break trend in the next day or two. Projected Gartley to 357'4

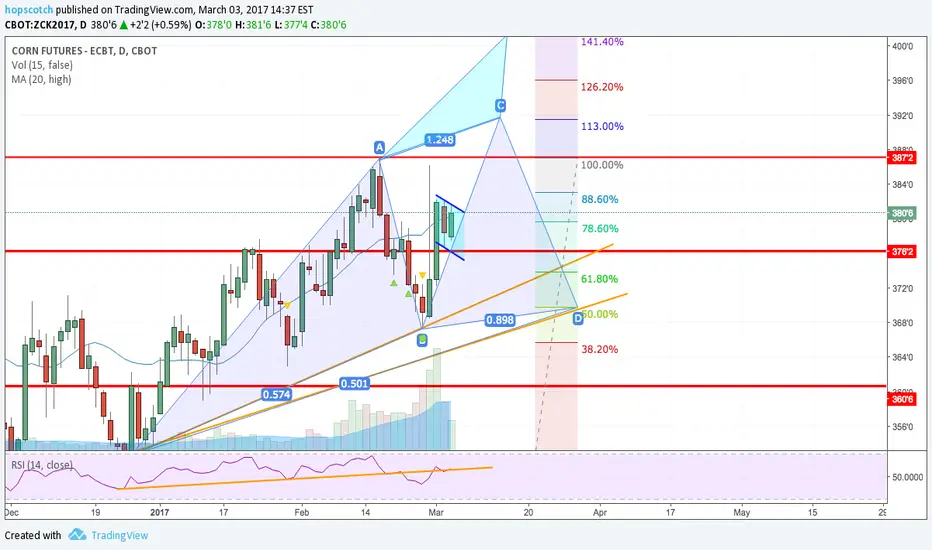
Corn Bullish FlagMay Corn produced a bullish flag today. Upside target 387'2 for triple top with possible continuation to 391'4 at Cypher C position and possible extension into 396 area. Support at 376'4
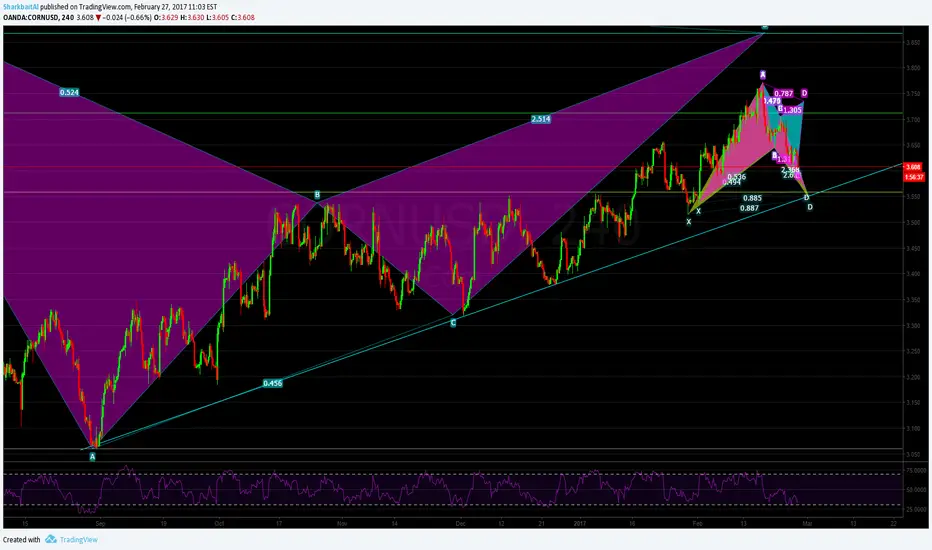
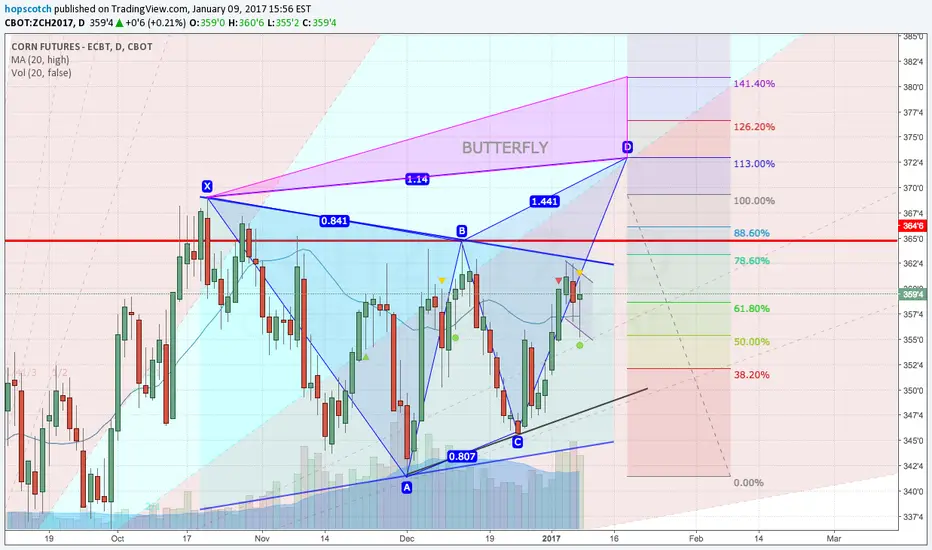
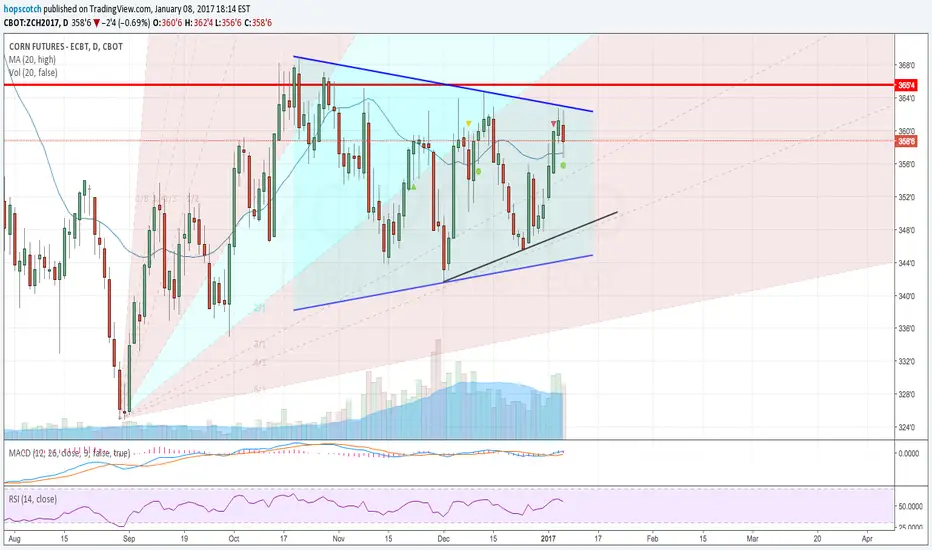
Buying Corn @ the Bat @ Trendline; Aiming for the Bearish BatI wanted to show the longer term view. Corn has been bullish but I have patiently been waiting to short at the large bearish bat/2618 trade set-up (linked below).
However if you zoom in you can see the potential buy set-up near the trendline based on 2 different bullish Bat patterns (yellow and pink). I will be watching price action near their completion points to choose which to take. I will move stops to B.E at TP1 of the pattern I choose and will likely choose to aim for the entry of the bearish Bat which would make a great long trade.
(Note: the bearish Cypher (blue) is only valid if the bat patterns do not complete!)
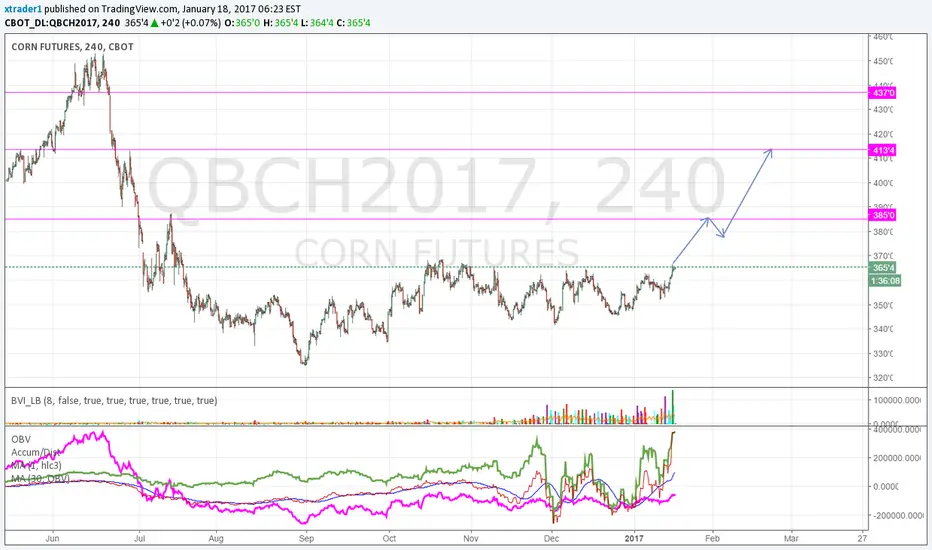
Update on Corn Futures: retrace, then next leg upThis is a follow up on this forecast:
Still bullish on Corn, after a surge up price retraced.
At this moment Corn is still in that retrace, but expect the next leg up soon.

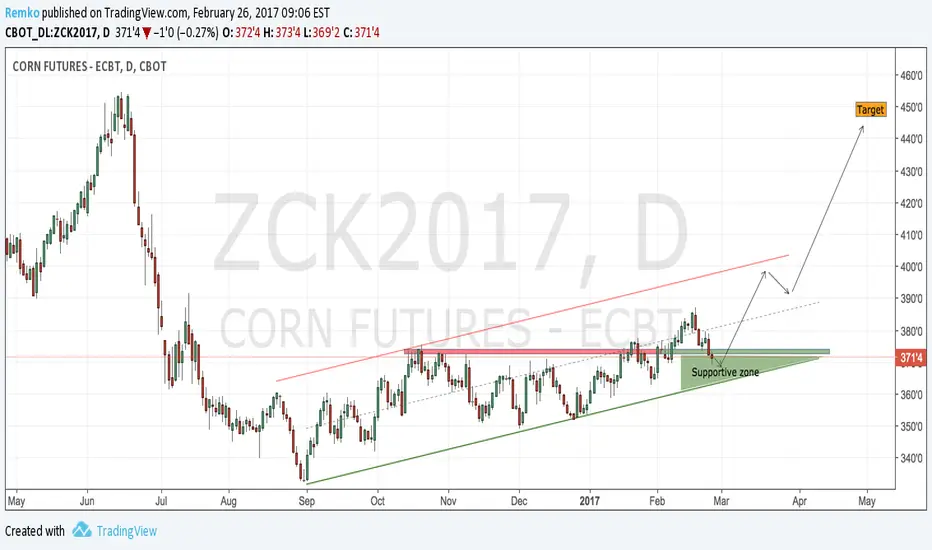
CBoT corn dailyThe daily MAY17 chart shows that price has been under influence of a solid horizontal resistance line at around the 375 level since October 2016. Price managed to break same resistance on February 7 from where price traded up to 385 until price made a reverse and started trading down towards same 375 level which now serves as support. During the last 2 sessions of last week price actually pierced through same supportive value. However, the green triangle that has been put into chart represents a strong supportive zone which comes from the horizontal trend line at around the 375 level and the ascending trend line which represents the lower boundary of the ascending price channel.
Friday’s candle in the shape of a so-called ‘Hammer’ suggests that the end of the decline of the past 6 sessions is now imminent and that price will find a bottom here. We will allow price one or two more down sessions towards the 363 level before we will consider an alternative short term outlook for this price.
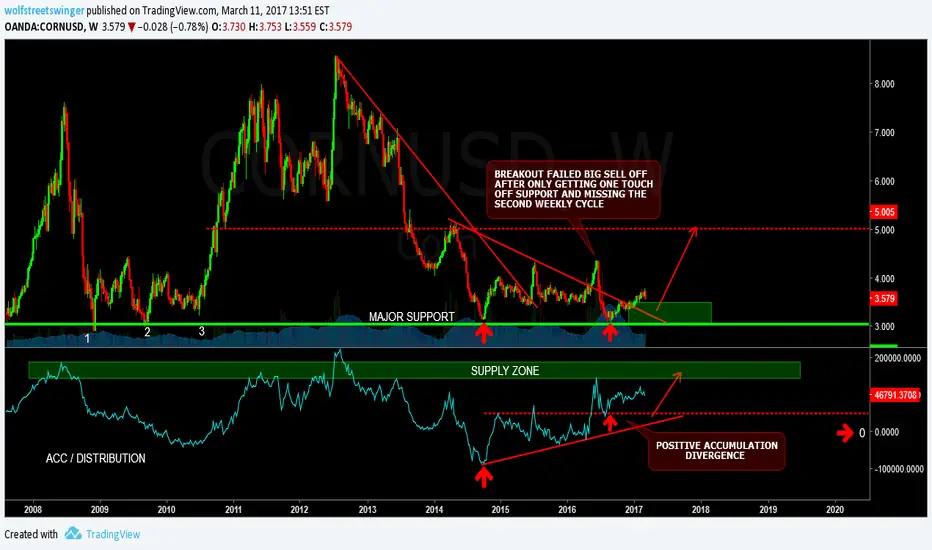
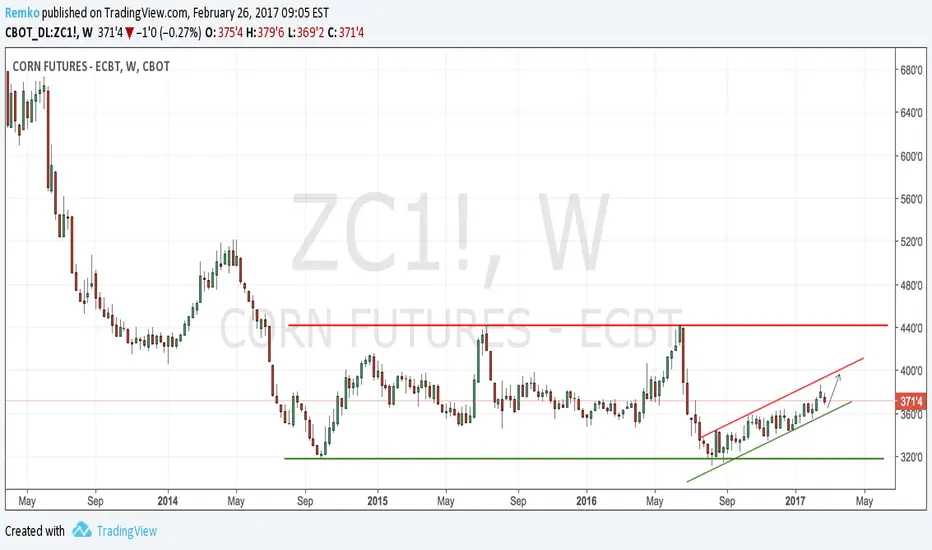
CBoT corn weeklyThe weekly continuation chart shows a very solid bottom at around 320 and an equally very solid top at around 440. Price has been trading sideways between these values since June 2014 and these values are relevant for us to keep in our minds.
From August 2016 on price gradually moved higher from its solid long term supportive level, gradually making higher highs and higher lows.
Within the 320/440 trading range there is a trending ascending channel that starts in August 2016 at 320 and gradually moves up. The ascending resistance of this trending price channel is at around 395 for the coming week and its ascending support is at 360 for the coming week. These supportive and resistance lines are to be kept in mind when looking at the price for the medium/long term. Until proven the contrary we have to assume that price will continue developing within this ascending price channel. Price could well make one more move down for the week to come but we keep our target at the upper boundaries of the ascending channel.
CornMay Corn fell off a bearish flag. Friday may bring mixed trading and possibly lower. USDA reports suggest a lot of corn still available along with South America huge crops. Corn may have a struggle going higher short term.
CORN: 2-week uptrend signal$CORN has a confirmed long term uptrend here, we can enter longs risking a drop to 19.01, and aim for a big rally this year. Fundamentals imply a potential advance due to climate, plus, it's a really sound technical trade.
Good luck,
Ivan Labrie.

Corn reversed courseMay Corn dropped last night and came back today. Corn acreage estimates down a little from last year. Possible come back for Corn from here to attempt a double top.

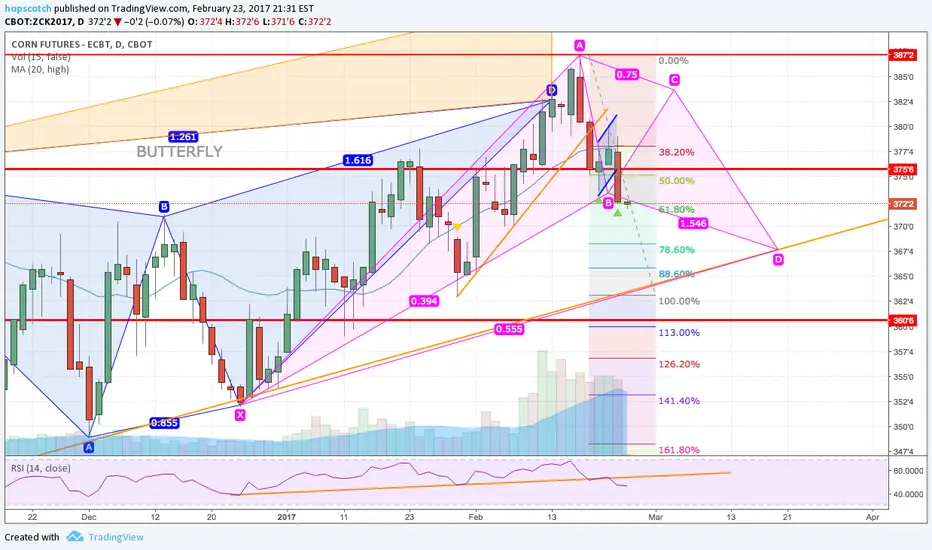
Corn Fall off of ButterflyCorn has fallen off of the Bearish Butterfly. It rose into the extension. Estimators put corn acreage at 90.48 million vs 2016’s 94 million. This should support an rise again on corn. New Butterfly projection fall to 61.8-78.6, then possible rise to a double top or beyond.

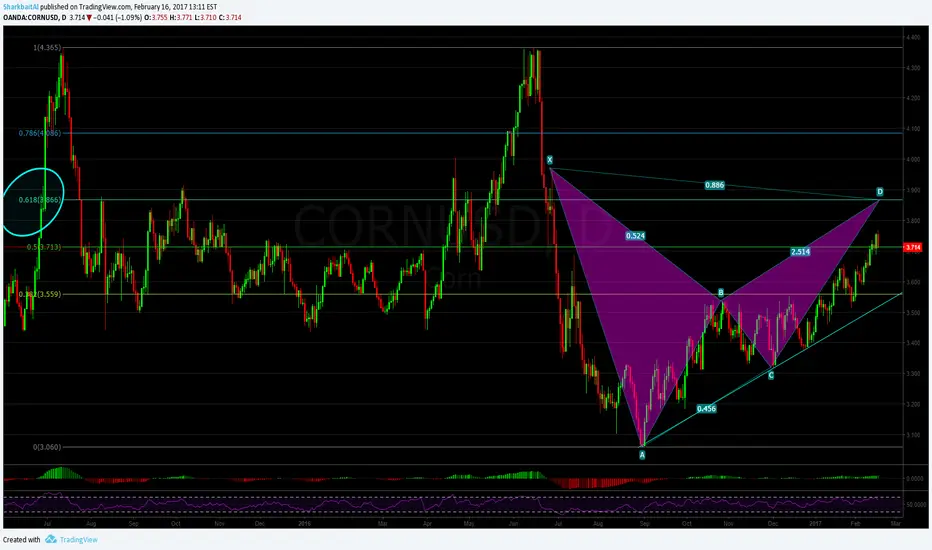
Corn Bearish 2618 and Bat Pattern ConfluenceCorn has been strong but I like the idea to short here! It appears indicators will agree with this as well. Let me know what you think.

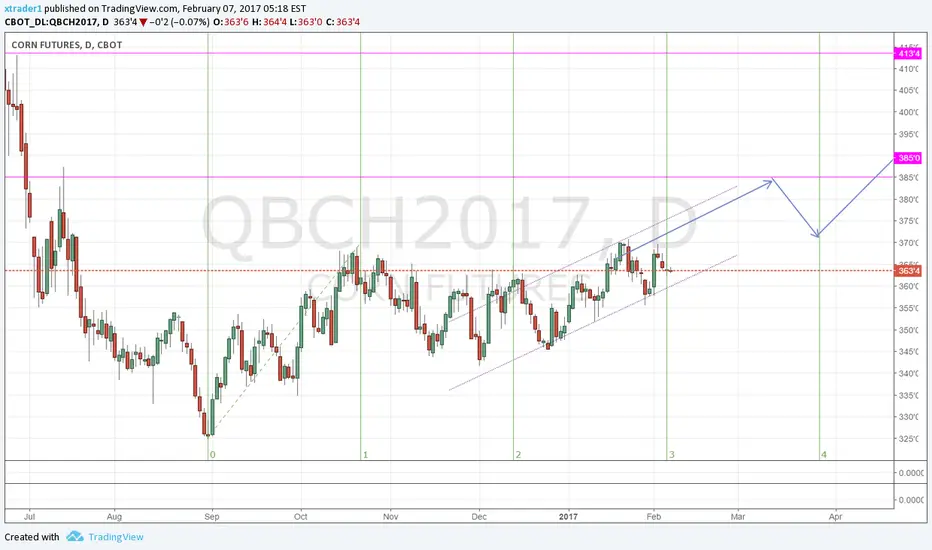
Forecast Corn Futures: Move up 385This is an update on a earlier forecast on corn futures.
The analysis remains the same: expect a move up to 385, then a retrace.
RICE IS A POTENTIAL HIGH REWARD BUY TRADETrendline broken, and market formed a textbook flag above the broken line.
For me a textbook buy signal is forming here.
If you like to take a little bit more risk like me, buy here at 975 and place your stop at 957.
Target would be the longterm trendline at 1060.
This would result in a nice 5:1 Risk:Reward trade.
If your looking for a more conservative approach wait for the flag to break and enter on the break.

Expect Corn to run up in the coming weeksExpect Corn (Futures) to run up between January and March 2017.
CORN | Weekly ChartIt's arguably a similar case to the former on wheat... Buying within the lowest decile in a decade, a very asymmetric return distribution, a potential break-out of the down trend.


CORNNice price action just under the resistance zone which has been tested multiple times.
Pressure might be building up here prior to a breakout.
March CornMarch Corn is creating a bullish flag today suggesting higher prices. Would be careful on this one as more chop would be in the offing for grains before Thursday's report. Next potential high is 366, 88.6% of the XA leg. If bulls can push it higher then the top of this market at 369. If the report on Thursday is bullish then the completion of the Butterfly at 372'4 and possible extension around 380 level.
March CornMarch Corn still sees horizontal movement with creep upwards. Thursday is the USDA report for all grains, but the 2016 crop is still impacting this market. If USDA report shows a lowering of future crops, this may help corn. Also Funds may buy this week so support levels around 354'2 off the 3/1 Gann Fan may hold. If prices fall further look for 349 4/1 Gann Fan as next support.
CORNAt interesting location at the moment.
If market consolidates around this zone, will look to buy on breakout.
If market just break out without consolidating further, will just wait for pullback after breakout.
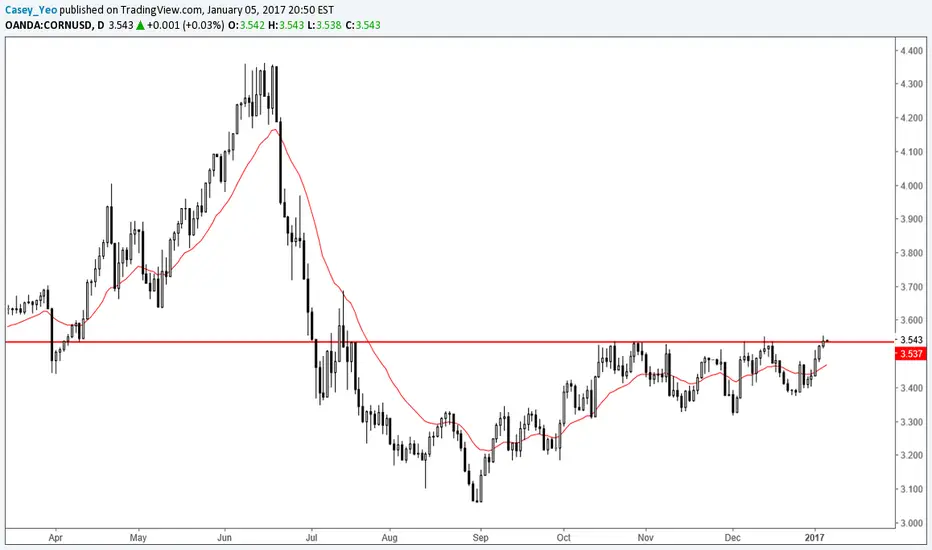
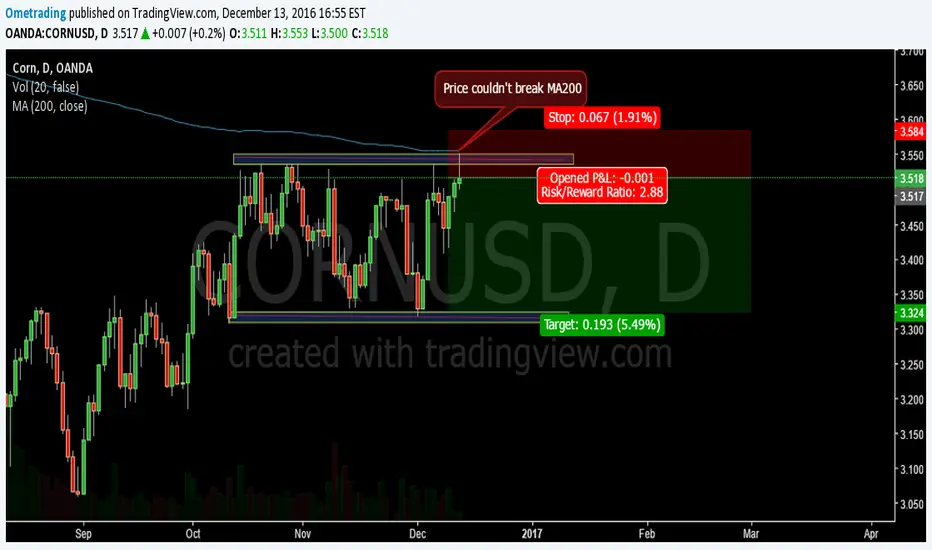
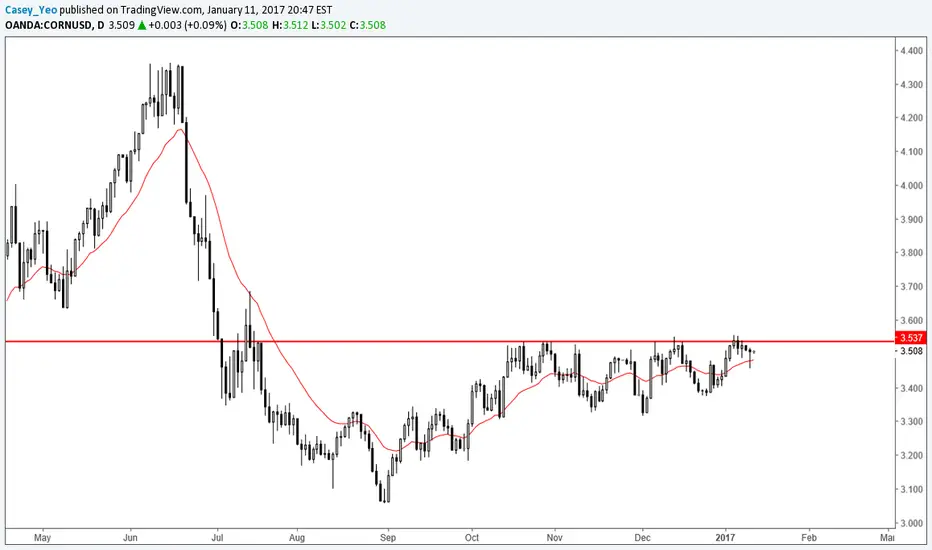
CORN can't support bullish pricePrice couldn't break MA200. It coincide with a clear resistance level. Short til the next support, and waiting a break to project the short till 3.10.