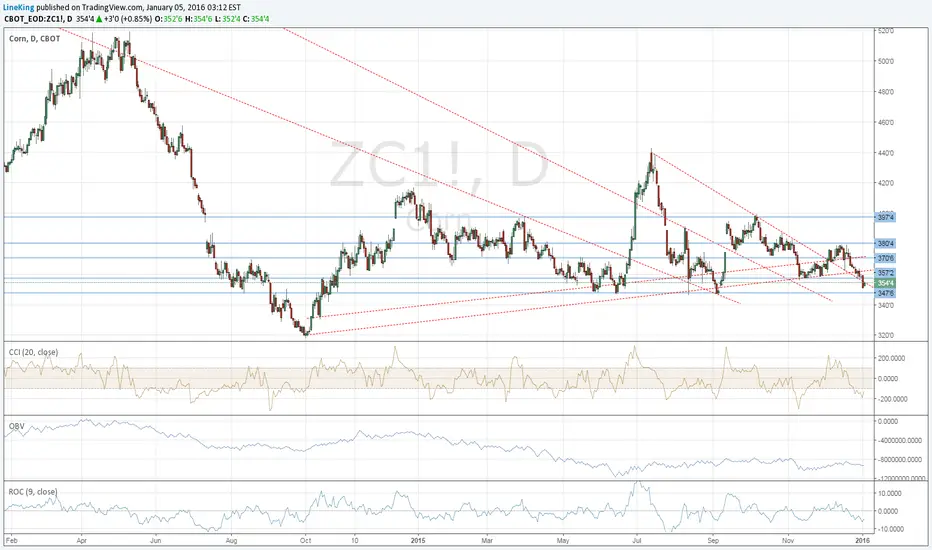
King Corn false breakoutNo bottom in site. Break of 347 confirms. Break back above current T/L at 370 suggests signs of reversal.
CORN
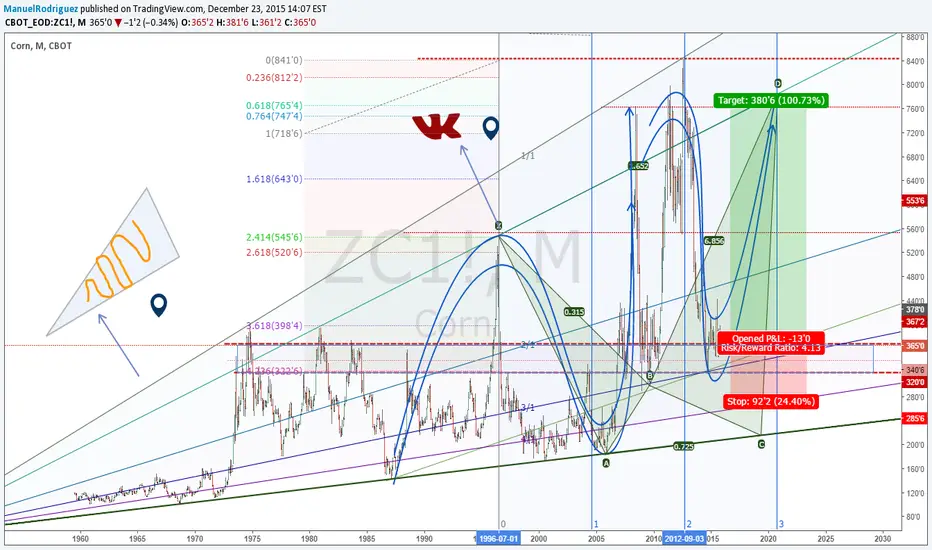
Corn Long Term IdeaCorn, shows them in his past aggressiveness very agitated and violent movements, and possibly in future also this is his behavior, reacion, added to it, it is clearly a cone shape, taking into whether the price, and giving its characteristic shape, plus you can see the possible formation of a huge formation type "W", which appears to have a huge reacion future.
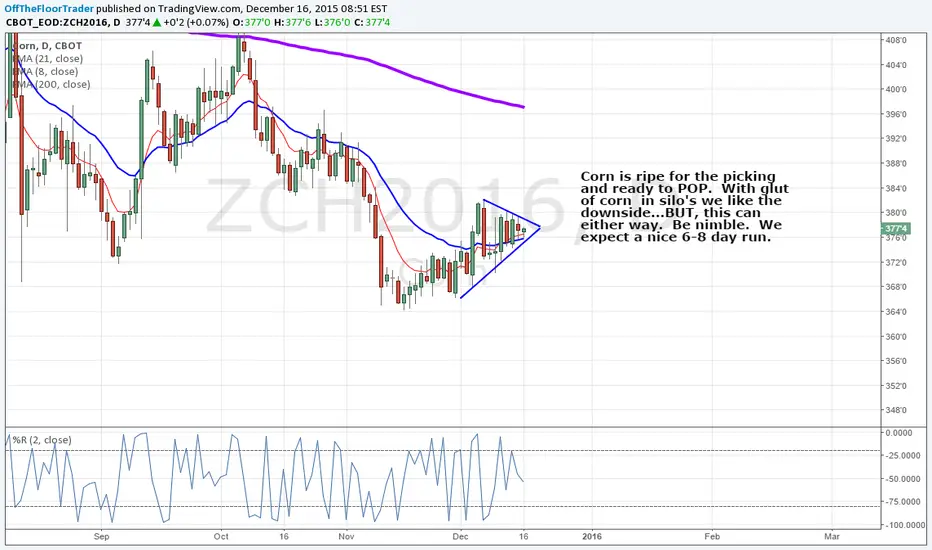
How about some "POP" Corn?Corn is ripe for the picking and ready to POP. With glut of corn in silo's we like the downside...BUT, this can either way. Be nimble. We expect a nice 6-8 day run.

Corn Weekly And Daily UpdateCorn seems to be in a corrective pattern in red wave 2 that can retrace back to fibo. level of 50-61'8 %. After the correction is completed, price may reach lower levels.
www.ew-forecast.com

Did we just hit the bottom? Corn has been diving over the last 3 years since it's peak in 2012.
Beside small correction move in 2014, it was pretty much a nose dive that cut corn value in more than half.
Since October 2014, Corn has been bouncing around the 22-23$ support zone, which is also the 127 extension for the first part of corn's decline (Aug 2012- Jan 2014).
The second time corn bounced from the 22$ it also broke out of a minor weekly downtrend line.
Last week, Corn spiked below 22$ and closed above it, creating a weekly false break and a weekly Outside Bar that could be a trigger for a bullish entry for those who seek to trade this bullish triple bottom setup. The bullish divergence we see in the RSI and the Stochastic being oversold can support this bullish scenario.
With stop loss below 21.5$ the initial target level will be the 50 SMA line near 25$ (assuming it'll break above the Fast SMA line - the first confirmation signal)
If the price will close above 25$, it could provide a longer term bullish signal for a deeper correction move in corn prices.

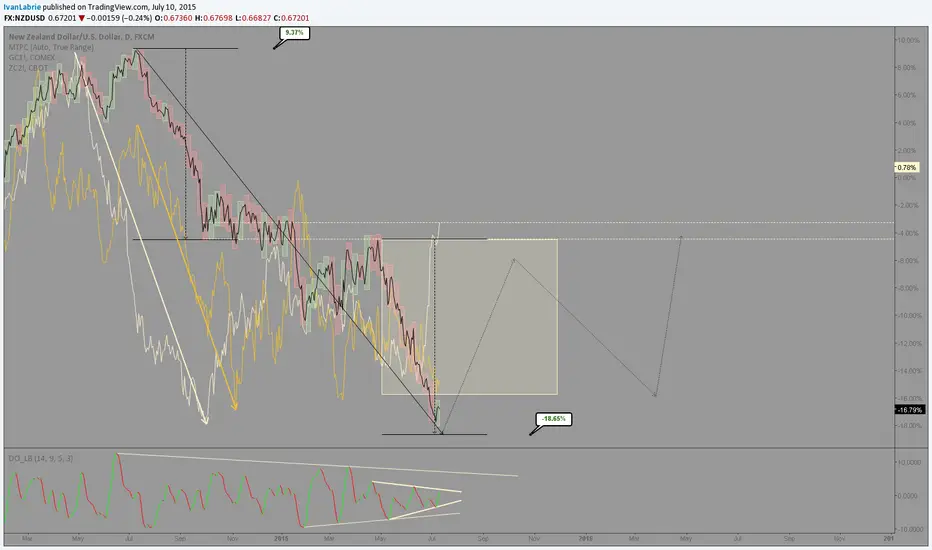
NZDUSD: Very close to a market bottomI placed an overlay of the corn and gold charts over the NZDUSD line chart with weekly range boxes.
Time at mode has given me a target in the weekly, which is very close to being achieved.
I suspect we will see the completion of a terminal falling wedge next week, offering a great buying opportunity in this pair.
I'll patiently wait for confirmation here, but I already suspect the bottom will come very soon.
Price might copy the corn rallies, which seem to be leading gold and crude oil, regarding dollar strength.
Should be an interesting long.
Have a nice weekend,
Ivan.
CORN UPDATE IV: Corn Turned UpCorn turned up in a sharp impulsive fashion, exactly from our highlighted levels. That said blue wave (C) is in action towards 442 -447 levels. Price remains bullish as long as level 345 holds.
CORN Update III: Corn Is Turning UpCorn is turning up, exactly from our highlighted levels. Now we are expecting price to move higher in weeks ahead.
www.ew-forecast.com

CORN Update II : Downward Move Still Corrective Corn is once again testing an important support region at 344 - 346, from where an impulsive bounce may still follow in days ahead.
www.ew-forecast.com

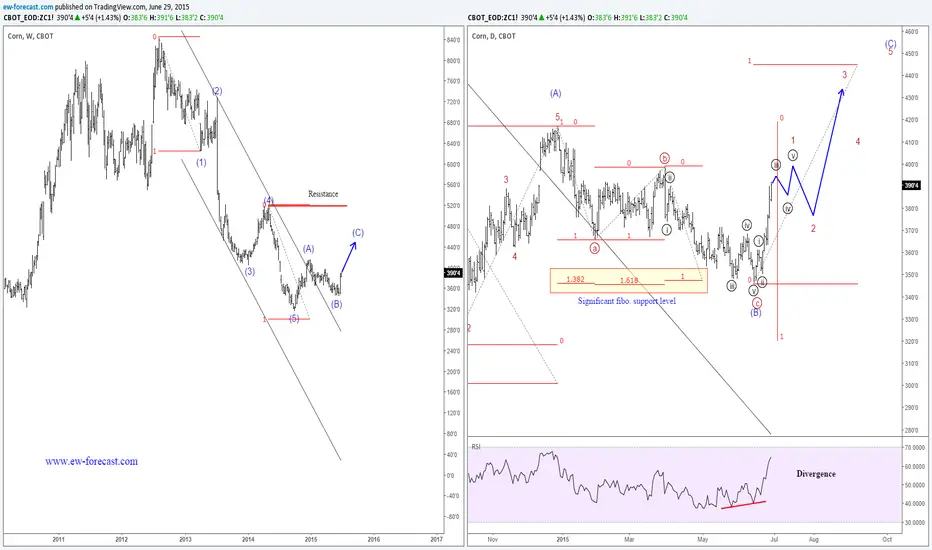
CORN Could Continue To Much Higher Levels CORN has been bearish for the last three years as we see on the Weekly chart, but that is likely over as A-B-C correction is currently unfolding. The first wave A has already made 5 waves up, which confirms a new bullish cycle. In wave B we can see a zig-zag pattern, that is near completion. We see some significant Fibonacci support levels around 345 on a Daily chart, from where a bounce could occur.

CORN DOWNTREND WILL CONTINUE, BUT IT WILL END IF WATER SHORTAGE Both corn and wheat downtrend will continue.
Since Dollar is very strong, agriculture is flourishing, oil is cheap, and is going to get cheaper, Corn and Wheat prices will go lower. There's no shortage of food, and it will continue to be like that in the next period.
Unless something bad happens this summer, in terms of weather, Prices will go lower.
The other possibility of this going higher is due to lack of water in some regions, like California:
www.zerohedge.com
www.zerohedge.com
Lack of water around the world could be possible due to more factors, but I will start with this:
www.zerohedge.com
www.zerohedge.com
www.zerohedge.com
www.zerohedge.com
www.zerohedge.com
Also, glaciers forming more in asia, it has to do with water retreating, possible global freezing, instead of global warming:
www.livescience.com
www.globalresearch.ca
www.globalclimatescam.com
www.thelongview.com.au
dailycaller.com
nextgrandminimum.wordpress.com
iceagenow.info
Also, there appears to be water barons buying all water:
www.bibliotecapleyades.net
www.blacklistednews.com
www.zerohedge.com
Also, why is global warming a pseudoscience:
www.bibliotecapleyades.net
So this means, short now commodities while you still can, and watch out for lower production in the coming years because of lack of water around the world that can trigger lack of food and so, rising prices in all commodities.
If on 1 month chart, highest high for corn is near 850, it can go in the future to 1600, 2000 or more, but that likely in 2 years or more, and that if farmers won't get water.
Short, short term, Long, long term.
Breaking the wedge indicates potential short target of 340, and longer target to 320.
Breaking above 50 day EMA at 370 indicates possible long, and getting out of the wedge and breaking 200 day EMA at 385 indicates longs to unknown potential.
This is ZCN2015 futures on corn chart, same as ZC1! idea.
(Made this idea again because on zcn2015 posting it in forum posts it with chart, unlike zc1!, which is posted with link.)
That is all.

CORN DOWNTREND WILL CONTINUE, BUT IT WILL END IF WATER SHORTAGEBoth corn and wheat downtrend will continue.
Since Dollar is very strong, agriculture is flourishing, oil is cheap, and is going to get cheaper, Corn and Wheat prices will go lower. There's no shortage of food, and it will continue to be like that in the next period.
Unless something bad happens this summer, in terms of weather, Prices will go lower.
The other possibility of this going higher is due to lack of water in some regions, like California:
www.zerohedge.com
www.zerohedge.com
Lack of water around the world could be possible due to more factors, but I will start with this:
www.zerohedge.com
www.zerohedge.com
www.zerohedge.com
www.zerohedge.com
www.zerohedge.com
Also, glaciers forming more in asia, it has to do with water retreating, possible global freezing, instead of global warming:
www.livescience.com
www.globalresearch.ca
www.globalclimatescam.com
www.thelongview.com.au
dailycaller.com
nextgrandminimum.wordpress.com
iceagenow.info
Also, there appears to be water barons buying all water:
www.bibliotecapleyades.net
www.blacklistednews.com
www.zerohedge.com
Also, why is global warming a pseudoscience:
www.bibliotecapleyades.net
So this means, short now commodities while you still can, and watch out for lower production in the coming years because of lack of water around the world that can trigger lack of food and so, rising prices in all commodities.
If on 1 month chart, highest high for corn is near 850, it can go in the future to 1600, 2000 or more, but that likely in 2 years or more, and that if farmers won't get water.
Short, short term, Long, long term.
Breaking the wedge indicates potential short target of 340, and longer target to 320.
Breaking above 50 day EMA at 370 indicates possible long, and getting out of the wedge and breaking 200 day EMA at 385 indicates longs to unknown potential.
That is all.
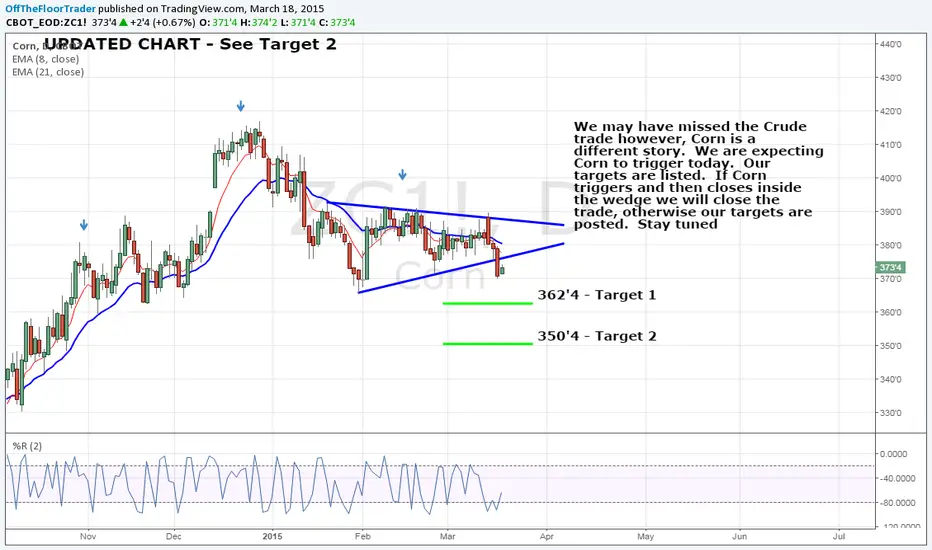
Corn is CooperatingWe may have missed the Crude trade however, Corn is a different story. We are expecting Corn to trigger today. Our targets are listed. If Corn triggers and then closes inside the wedge we will close the trade, otherwise our targets are posted. Stay tuned
Time to pick some CornCorn has broken and closed below it's wedge on a weeky time frame. We are looking for pullback triggers to get involved to the short side. Targets are identified and the stop will come from the trigger (on a 60 or 240 min chart)...NO TRIGGER, NO TRADE!

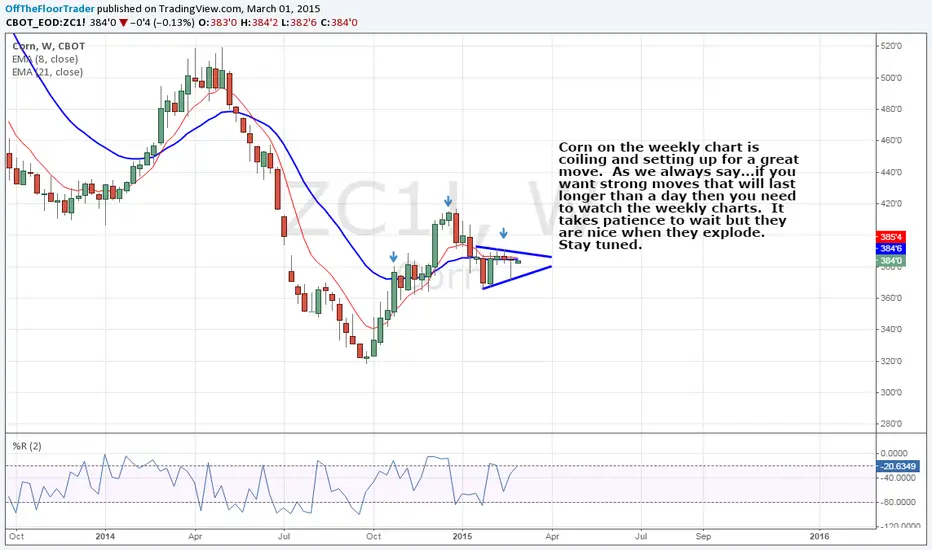
Weekly setupCorn on the weekly chart is coiling and setting up for a great move. As we always say ...if you want strong moves that will last longer than a day then you need to watch the weekly charts. It takes patience to wait but they are nice when they explode. Stay tuned.
The squeeze is comingAbove 998 and the squeeze will have shorts scrambling. A close above this area and we will be looking for triggers long.

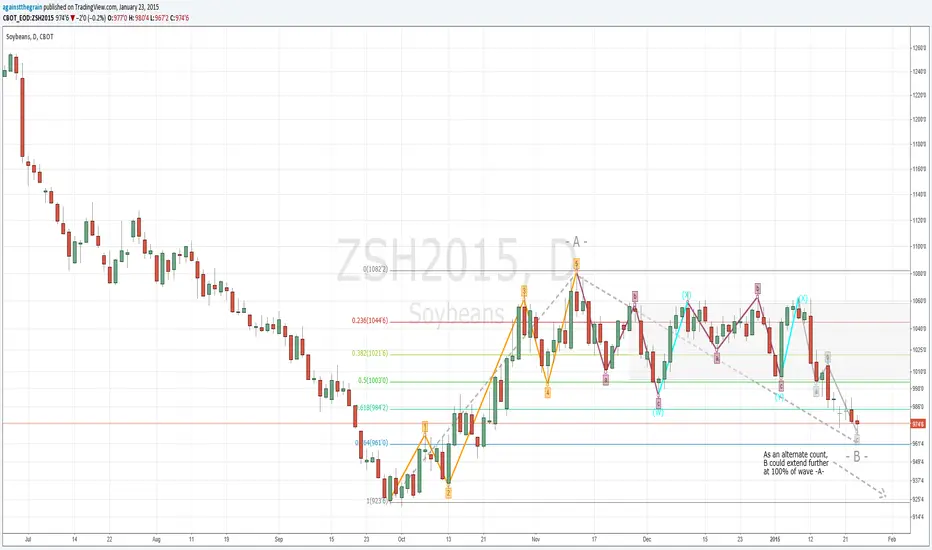
ZS upward "C" wave to come (???)Soybean has been a tough market for those traders seeking volatility as it has been on a “wait-and-see” mode for a couple of month now. I do not expect any major movement on the short/mid run; however, I do see a possibility to “widen” the current trading range.
The wave counting above suggests that a B wave would be completed (or nearly completed) and a possible upward C wave would be on the radar screen. For those (unlike me) seeking short-term opportunities it may be a good commodity to keep track on.
I am still holding my long position with stops on a range around 920, although I confess the weekly chart does not look that bullish. In fact, the MACD divergence is killing my sleep lately.
See my comments on ZC at:
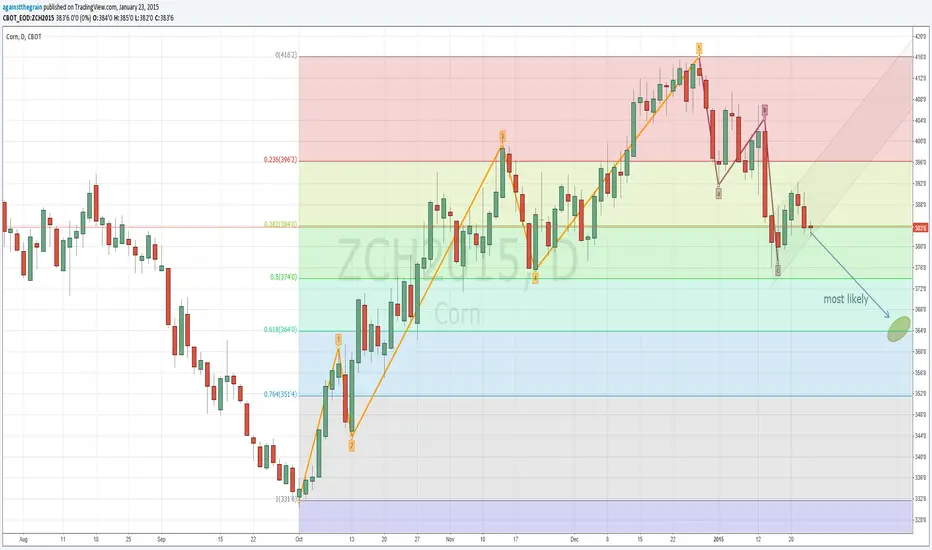
We may see a “Pop” in Corn (???)(Forgive the terrible joke, but I couldn’t hold myself).
The 50% retracement on Corn suggests that a minor correction would be over making possible an “a-b-c” counting thus getting ready to resume the upward trend. However, at this point in time, it would be wise to keep an alternate count in sight as this correction could easily (and most likely, in my opinion) extend to the 0.618 fibo. I say this, as most indicators are either bearish or neutral on the short/mid run. Ichimoku, for instance, is “cloudy”.
Unlike soybeans (that has been on sideways for days now), corn has provided some interesting ups and downs for day-traders. For the long-term however I am still bullish and will keep holding my long position as long as prices stay within the 4-350 trading range, although I strongly suggest a stop-loss at levels close to 330 for money management matters.
Just for the records, I am a position trader (i.e. no day-trading).
Correction near the 50% Fib and inside a support zoneAfter breaking down two uptrend lines, $CORN is back the 25.5$ zone (now support).
The levels between 25.5$ and 25$ is support zone to monitor that comes with the 50% Fibonacci level.
Yesterday's strong selling could mean that the price will continue to dive to test the bottom of the trading zone. In that case, if we will see a reversal near the 50% level, a stop loss below the 61.8 Fib could be the right thing to do for those who want to try to jump back on the minor, new uptrend.

$ZC_F $CORN reclaims support with tailwindCorn futures regained support today and have a tailwind. Out performing $ZS_F $SOYB #beans so far Q4 2014 and now Q1 2015. See attached charts.
Chow down on Corn Soybeans broke major support so we are looking at Corn to see if this pattern breaks with it. We will use smaller time frames for a trigger.

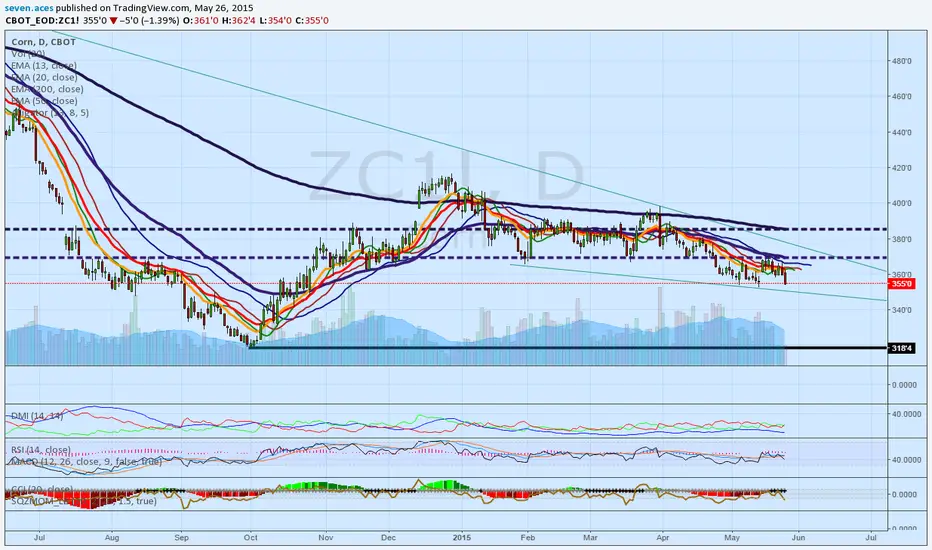
Corn (ZC) At Long-Term SupportZC has been sold off stronger than most commodities, and its weekly Stochastics is at an extreme low reading. Note how it together with weekly MACD are beginning to turn up. The daily chart including today's action illustrates this bottoming action more clearly, but I've profiled this weekly chart to point out how ZC is currently beneath a long term down channel support line, which I don't expect to persist for long with ZC trading at an important support zone. Although the weekly RSI appears to still turn down, keep in mind the lag introduced by weekly chart signals. Visit goo.gl for today's technical analysis on $NG_F, $ZC_F, $USDJPY, $VIX_F, $NQ_F, $NFLX, $TSLA, $ES_F, $USDX, $EURUSD, $EURCHF, $CT_F
Website: tradablepatterns.com
FB: facebook.com
Stocktwits: stocktwits.com
Twitter: twitter.com
Linkedin: www.linkedin.com
YouTube: www.youtube.com
Google+: google.com
Email: info@tradablepatterns.com
