BTCUSD idea what do thinkme and my students will slowly follow this analysis we dont expect much from the market as most major economy are facing a lock-down
inbox me let talk forex
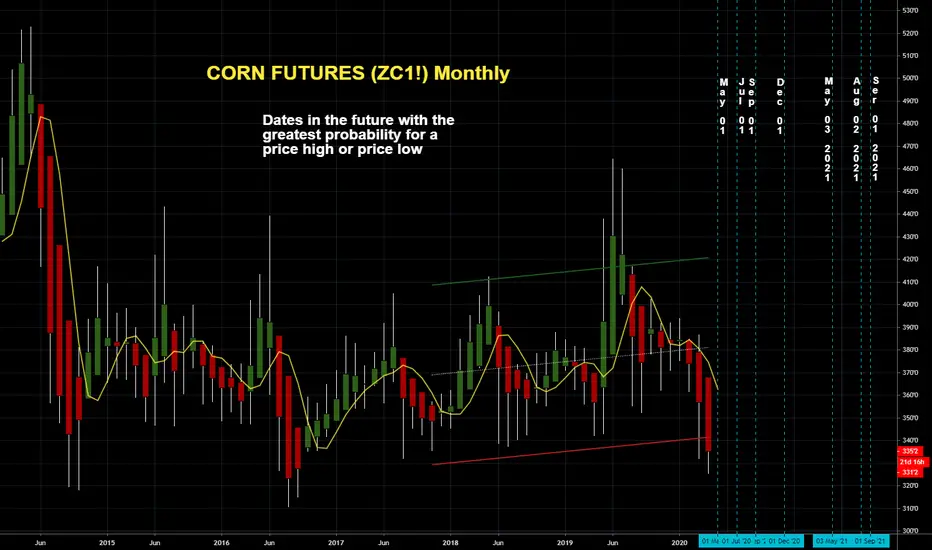
Cornanalysis

CORN FUTURES (ZC1!) MonthlyDates in the future with the greatest probability for a price high or price low.
The Djinn Predictive Indicators are simple mathematical equations. Once an equation is given to Siri the algorithm provides the future price swing date. Djinn Indicators work on all charts, for any asset category and in all time frames. Occasionally a Djinn Predictive Indicator will miss its prediction date by one candlestick. If multiple Djinn prediction dates are missed and are plowed through by same color Henikin Ashi candles the asset is being "reset". The "reset" is complete when Henikin Ashi candles are back in sync with Djinn price high or low prediction dates.
One way the Djinn Indicator is used to enter and exit trades:
For best results trade in the direction of the trend.
The Linear Regression channel is used to determine trend direction. The Linear Regression is set at 2 -2 30.
When a green Henikin Ashi candle intersects with the linear regression upper deviation line (green line) and both indicators intersect with a Djinn prediction date a sell is triggered.
When a red Henikin Ashi candle intersects with the linear regression lower deviation line (red line) and both indicators intersect with a Djinn prediction date a buy is triggered.
This trading strategy works on daily, weekly and Monthly Djinn Predictive charts.
This is not trading advice. Trade at your own risk.
I'm actually quite curious on inflection points and fib levels. We are talking mother nature here.. So i wonder how pandemics correlate with fib levels. It'd be cool if someone had access to other pandemic charts and if they could chart what the fib levels look like.

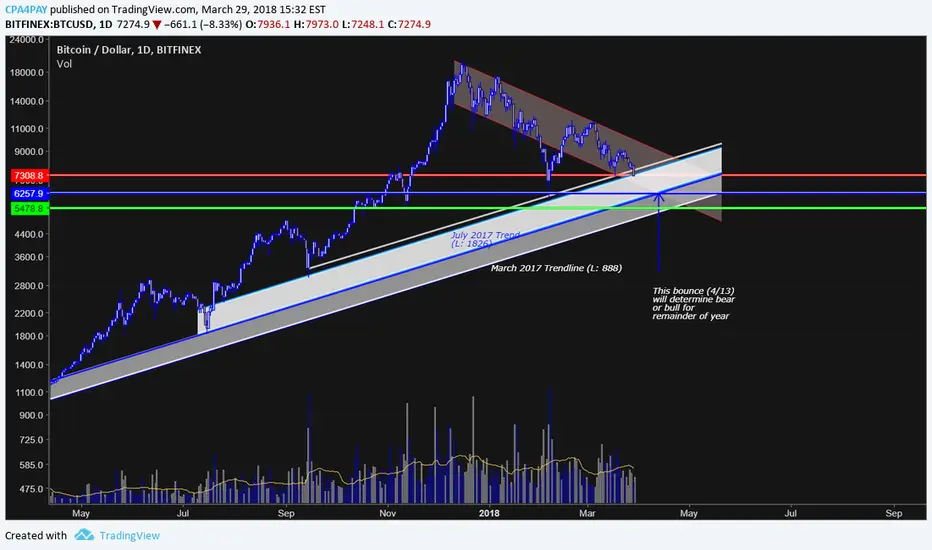
Tiempo de Partiro My horizontal support line and upper bound of the July Channel is being broken as I write this - not surprised and was expecting at least a wick below it. W
What I wasnt expecting is such low volume on this break. I think most of the community is somewhat surprised by the lack of volume, but maybe people are getting smarter. This means lower lows are to be expected - we're gonna break the 2/6 low.
I suspect we hit 6.2k on 4/13 (blue arrow), with a wick going into the 5.5 (green). If a wick breaks that trendline, then I think we will see more bear market down to 4k.