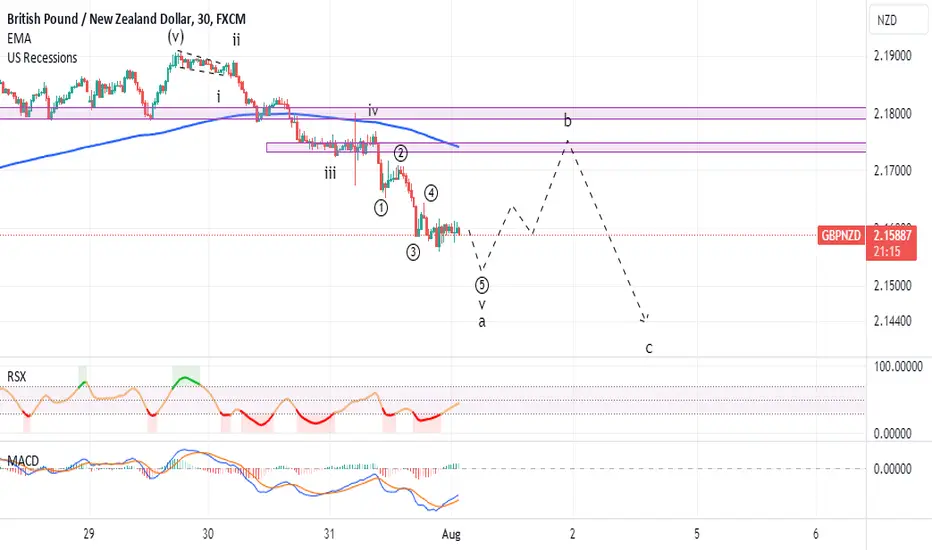
#GBPNZD more bearish move to comeThis is my prediction for GBPNZD for the next couple of days.
As you can see in the chart, the price seems to be completing a 5-wave bearish impulsive move, which could end by tomorrow.
Following this bearish move, we could assume a bullish corrective ABC formation, which could take us all the way back to the level indicated by the arrow.
From there, we could expect another impulsive bearish move, which could be either wave 3 or wave C.
We do not know this for sure at this point, so we should wait and analyze the price action once the time is relevant.
Let me know if you would like me to publish an analysis in a lower timeframe on this chart to take advantage of this rally.
Correction
Microsoft - We still have to be patient...NASDAQ:MSFT dropped after reporting earnings and can now create a short term correction!
Simplicity is key, also when it comes to trading the higher timeframes on stocks. All you need are three lines in order to fully understand the trading history and also future of Microsoft. If we get a retest of the triangle breakout level, which is perfectly lining up with the rising trendline, a bullish continuation will be quite expected. Just wait for confirmation first though!
Levels to watch: $350
Keep your long term vision,
Philip - BasicTrading

#CHFJPY elliot wave analysisAs can be seen, it looks like we are dealing with an ABC bullish corrective wave pattern, currently in wave 4 of wave C. There is a possibility of another short-term bullish move to complete wave C.
From there, we could look for selling opportunities in the direction of the higher timeframe trend.
Let me know if you would like me to publish an analysis in a lower timeframe on this chart to take advantage of this rally.

Long way to go from here
Current situation: SKILLING:US100 : NASDAQ:SMCI is currently at support level.
Potential scenario: If tomorrow's earnings do not meet expectations, the stock could drop to around $450 in a heartbeat.
Why?
1. The movement that started on 4.03.2024 appears to be an ABC correction, and the stock is currently in wave C of that correction.
2. In an ABC correction, the most common Fibonacci level for wave C is when
Wave C = Wave A = 1 = $446
3. Other indicators, such as MACD, are also indicating a downward trend as expected.
The WavesInvesting indicator is also pointing to the same level as the Fibonacci ratio for its lower channel line.
However, if the earnings turn out to be very good, we may see support at the current level.
Simple question for you: support or down the water slide we go?

Weekend Analysis Round Up- EUR/USD, AUD/JPY, DOGEHey Everyone!! Here is my Weekend Analysis Round Up for Market Open!!
1) EUR/USD - Head & Shoulders Pattern w/Potential Bearish Wedge as Continuation Confirmation!!
2) AUD/JPY - Possible Correction Wave based off new LOWER LOW!
3) Doge - Stuck in a Pennant?!

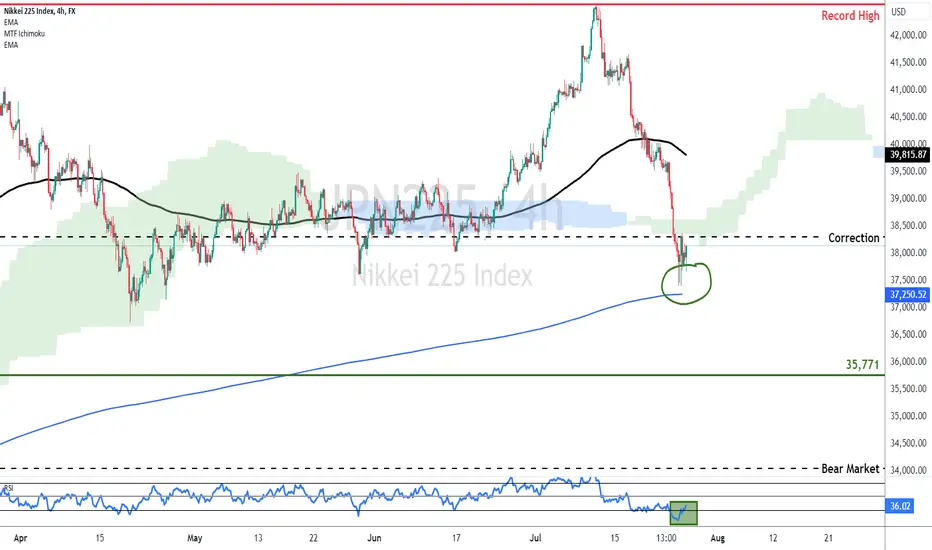
JPN225 Drops to Correction Levels Ahead of the BOJThe Japanese benchmark index is having another banner year, which culminated to July’s record peak. The central bank’s accommodative stance despite the policy pivot and the Yen’s protracted slump, were the key drivers. But even if slowly, the Bank of Japan is moving towards a less loose setting, after exiting negative rates regime in a historic decision in March. Policymakers have pointed to less bond buying ahead and there are mounting expectations that policymakers will hike again next week.
These prospects help the ailing Yen rebound (along with intervention speculation) and send the JPN225 to correction territory, with a more than 10% slide for the all-time highs. This threatens the pivotal 200Days EMA (blue line) and a breach would open the door to bigger losses towards and beyond 35,771.
However, there is ambivalence around the timing of the next rate increase, while officials have disappointed hawkish expectation in the past and have wrong-footed markets before. Furthermore, the Yen’s demise has made Japanese equities more appealing to foreign investors and ultra-loose monetary policies may have been key drivers of the rally in Japanese equities, but they are not the only culprits. Structural reforms, favorable policies by the government and strong corporate earnings are among the supportive factors.
Furthermore the drop is stretched from a technical perspective, as the RSI reached the most oversold in years. This can help JPN225 stage a comeback as it already defends the 200Days EMA. It may get the opportunity to reclaim the EMA200 (black line) at around the 40K mark. Successful effort would reinstate the bullish bias, but strong catalyst would be needed.
Stratos Markets Limited (www.fxcm.com):
CFDs are complex instruments and come with a high risk of losing money rapidly due to leverage. 62% of retail investor accounts lose money when trading CFDs with this provider . You should consider whether you understand how CFDs work and whether you can afford to take the high risk of losing your money.
Stratos Europe Ltd (trading as “FXCM” or “FXCM EU”), previously FXCM EU Ltd (www.fxcm.com):
CFDs are complex instruments and come with a high risk of losing money rapidly due to leverage. 59% of retail investor accounts lose money when trading CFDs with this provider . You should consider whether you understand how CFDs work and whether you can afford to take the high risk of losing your money.
Stratos Trading Pty. Limited (www.fxcm.com):
Trading FX/CFDs carries significant risks. FXCM AU (AFSL 309763). Please read the Financial Services Guide, Product Disclosure Statement, Target Market Determination and Terms of Business at www.fxcm.com
Stratos Global LLC (www.fxcm.com):
Losses can exceed deposits.
Any opinions, news, research, analyses, prices, other information, or links to third-party sites contained on this video are provided on an "as-is" basis, as general market commentary and do not constitute investment advice. The market commentary has not been prepared in accordance with legal requirements designed to promote the independence of investment research, and it is therefore not subject to any prohibition on dealing ahead of dissemination. Although this commentary is not produced by an independent source, FXCM takes all sufficient steps to eliminate or prevent any conflicts of interests arising out of the production and dissemination of this communication. The employees of FXCM commit to acting in the clients' best interests and represent their views without misleading, deceiving, or otherwise impairing the clients' ability to make informed investment decisions. For more information about the FXCM's internal organizational and administrative arrangements for the prevention of conflicts, please refer to the Firms' Managing Conflicts Policy. Please ensure that you read and understand our Full Disclaimer and Liability provision concerning the foregoing Information, which can be accessed via FXCM`s website:
Stratos Markets Limited clients please see: www.fxcm.com
Stratos Europe Ltd clients please see: www.fxcm.com
Stratos Trading Pty. Limited clients please see: www.fxcm.com
Stratos Global LLC clients please see: www.fxcm.com
Past Performance is not an indicator of future results.
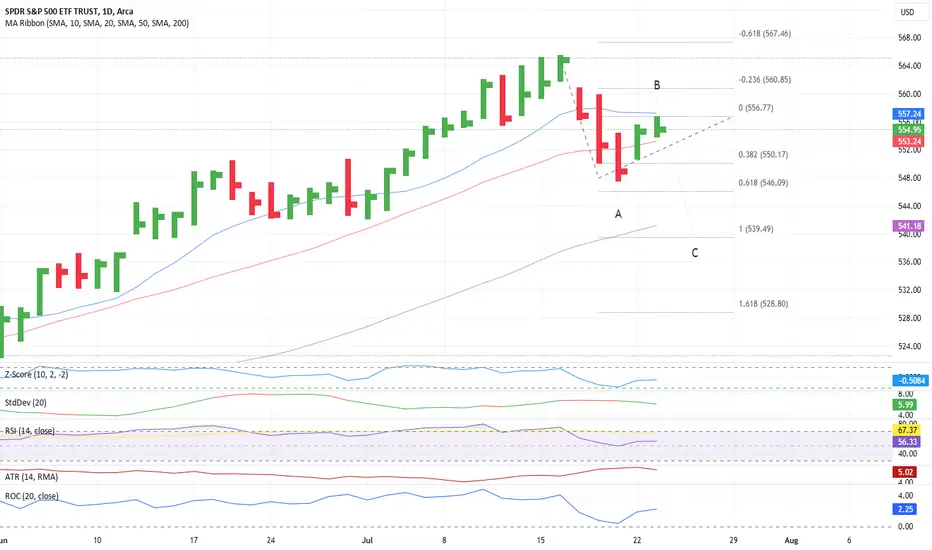
S&P500 - The beginning of the bear market?SP:SPX potentially created a top and is starting to head lower for the next months.
We have patterns, cycles and market structure and if everything is lining up nicely, there is a high chance you will be right. The S&P500 is currently retesting a major multi-year resistance trendling, is starting to shift bearish on the smaller timeframes and just rallied +50% without any noticeable correction. In a couple of months, we will trade at lower levels!
Levels to watch: $5.500, $4.500
Keep your long term vision,
Philip - BasicTrading

#Ethereum Update:Today was the first day ETH ETFs were traded.
The price of ETH is now correcting because this news is already known and has become just a formality.
What’s important about these ETFs are the volumes, which in the case of the #BTCETF approval initially put selling pressure on the market, followed by a larger upward movement.
I have two scenarios for this 1-day (1D) timeframe:
🟢 Green Scenario (Bullish): Possible recovery and increase in the coming days.
⚫ Black Scenario (Bearish): Short-term correction, but potentially very bullish in the medium term because a lot of liquidity has formed in that marked area and we also have an FVG (imbalance) on the W timeframe + resistance on that parallel channel.
Watch the market closely 3100-3300 and consider these scenarios in your trading strategies!

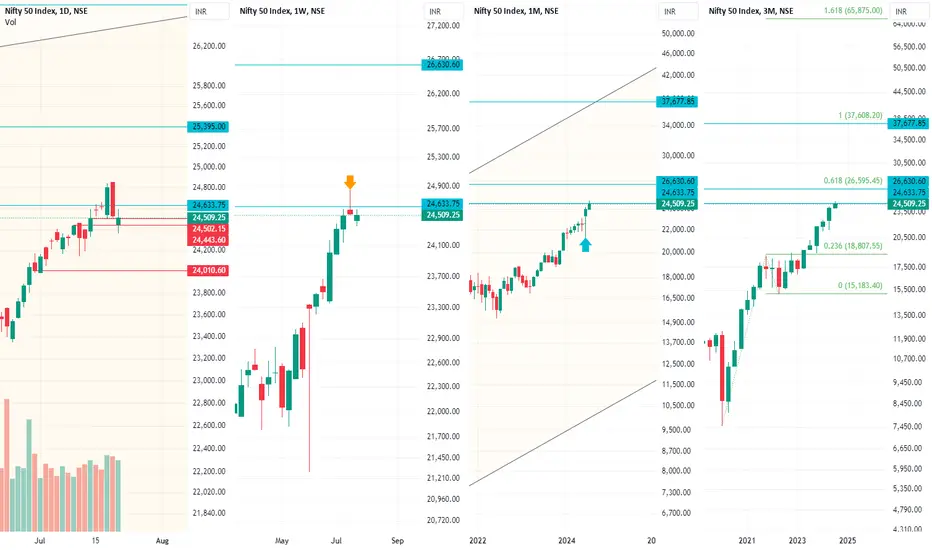
Nifty Analysis - The No-Nonsense "0" Indicator Strategy!!!While trading on Indices, most of us adopt 3 major strategies
Intraday / BTST Trades: Referring the Open Interest (OI) positions
Positional Short Term Expiry: Mostly using Chart patterns at 1 hr or 1 day coupled with Indicators like EMA 9, EMA 21, Bollinger Bands, MACD, RSI, RSI divergence etc...
Positional Long Term Expiry: Using Chart patterns at different timeframes 1 hr, 1 day, 1 week etc.. in the Nifty Index
Sometimes, a combination of the above 2 strategies are being used.
When we fail, we talk about mentality and most often accept the failures and look for next trade. Seldom, anyone does back-testing to identify the real problem
Let's review the cases above
1. Open Interest (OI) based trades = Blind Betting on a Horse which has Max bets
cdn.geekvibesnation.com
Without understanding the Strength, Stamina, Agility, Medical condition of a Horse, if we take bets on a horse where there is already maximum betting - the odds of winning may be higher for a Horse Race.
But such blind betting ends up in confirmed failures in stock market - if we base our positions referring to OI positions because AlgoTraders & Big players usually create a Bait showing an extremely high position on one side and the moment innocent retailers are lured in that direction, using power of money & power of Algo Speed, the OI positions are cancelled and changed to opposite direction
The movement is so fast that it neither hits our SL nor our preset Targets (even if it is in our favor by coincidence) - ending up in Steep losses
2. Reliance of Various Indicators = Getting attacked by Octopus
img.freepik.com
An index like Nifty 50 is NOT just a combination of 50 stocks, but these 50 stocks are handpicked from different Sectors and each Stock has different Weightage. A sudden News on Any particular Sector (or) A news about a particular Stock (or) Quarterly Results combined with the weightage of the Sector & Stock have a very Dynamic impact on the Nifty Index.
Unlike a linear price movement on a particular stock, Index movement cannot be accurately predicted by ANY of the indicators. Especially during special situations like Quarterly Results (or) during Election (or) during Budget - there would be sudden variations across different sectors each with their weightage will have varied impact on Nifty. Like an Octopus - which can attack us using all its 8 Tentacles with varied force and independent movement - any human based algorithm considering the price values only of the Index becomes useless
3. Using Chart patterns of Index = Judging the Book by Its Cover
miro.medium.com
Almost all Traders are so engulfed within the Index's spot prices and premiums that we almost forget that the Index movement is NOT based on its Cover but rather based on the underlying 50 stocks. What we are doing is nothing but Gambling against the cover - which does not handle sudden turns in any of the underlying stocks which coupled with their weightage has very varied impact and becomes unpredictable
Let's ignore ALL the Non-Sense above and try to read the Book (the underlying stocks) and derive trends basis Support and resistances of Index & stocks instead of using indicators
Comparison of Nifty Daily, Weekly, Monthly, Quarterly:
1. The June Quarter Candle ended with strong bullish indicating that Nifty would be Green in subsequent quarter (July-September)
2. But June Monthly candle ended in a Bearish Hammer pattern (Long wick and short candle) which is an indication of Temporary Bearish Reversal for July month
3. Last week's candle ended in a Shooting Star pattern indicating a Fall this week
4. July 22 (Monday - Today's) daily candle ended negatively below Friday close. Despite a strong rise in the 1st hour propelled solely by HDFC, both Nifty and HDFC could not sustain the bounce, and both got rejected by their respective resistances and fell down indicating further downside
The Above Index Analysis is perfectly in-line with our earlier analysis of RED July and GREEN September
Now for a more sharp analysis, let's analyze the Top 10 Nifty stocks by weightage
Top constituents by weightage
HDFC Bank Ltd. 11.95
Reliance Industries Ltd. 9.98
ICICI Bank Ltd. 7.95
Infosys Ltd. 5.33
Larsen & Toubro Ltd. 3.91
Tata Consultancy Services Ltd. 3.73
ITC Ltd. 3.70
Bharti Airtel Ltd. 3.64
Axis Bank Ltd. 3.39
State Bank of India 3.07
1. HDFC
Despite a 3% rise in HDFC - which single-handedly lifted Nifty higher in the 1st couple of hours, HDFC Bank faced its resistance at 1645 and fell - pulling Nifty down. Given HDFC has highest weightage and with no major news expected for HDFC or Private Banks as part of the Budget, the movement is expected to go sideways between Resistance and immediate support thus Dragging / Denying a major upside for Nifty
2. Reliance
Reliance industries on daily, had formed a Double Top Breakdown - resulting a Crash of -3.5% in a single day. The price took support from previous Rounding Bottom Break out zone at 3001. this is attributed to a lack-lusture quarterly performance. The price will take some breathing and consolidate around CMP for some more days which will again arrest Nifty on downside given its weightage
3. ICICI Bank
Monthly chart on ICICI clearly shows price testing a Long Term Parallel Channel top as resistance. This is about to fall further in the absence of any boost to Private Banking Sector. This is the 3rd heavy weight component of Nifty - all trying to hold Nifty on downside
4. Infy
Despite posting strong Q1 results, Infy could not blast due to multiple resistances along the way (Parallel Channel + Rounding Bottom Resistance) etc...Unless 1850 is broken out decisively, Infy will not aid in lifting Nifty higher
5. L&T
After a sharp rally of nearly 6x from 650 to 3860, L&T is up against a Multi-year Trendline (Parallel Channel) resistance and on weekly, the price has formed a Double Top pattern which is neither activated nor negated. Until the price decisively blasts above 3860 and also break the smaller channel on upside, there is no hope for now for Nifty to go up
6. TCS
TCS by itself is struggling for nearly 4 years to break its previous ATH. Price is now on the verge of Cup and Handle Breakout on weekly, but 4290 has poised as a formidable resistance so far
7. ITC
ITC on weekly has completed a Double Bottom breakout and achieved the target as well. After reaching the target, price is now starting to face resistance as this has evolved into a larger Inverted Head and Shoulder pattern. It is still Bullish in longer term, but now the price fall has triggered the beginning of Right Shoulder which is expected to reverse between 425 and 418. The trajectory of the fall to 425 where there is a multiple combination of support + trendline + right shoulder level - though bullish, will consume time atleast until Sep denying an upside for Nifty in the short term
Similarly the charts of SBI - , Axis bank - and Airtel - all indicate formidable resistances ahead - putting blockers for the Nifty March....
The above strategy appears more accurate as it directly handles each of the different sector charts along with their weightage and there doesn't seem to be any confusion among any of the top 10 constituents of Nifty - all indicating downside in near term
This strategy does not Rely on 3rd Party Indicators which are inaccurate. Please share your views on this detailed Research and Analysis
Disclaimer:
Stocks-n-Trends is NOT registered with SEBI. We do not provide Buy / Sell recommendations - rather we provide detailed analysis of how to review a chart, explain multi-timeframe views purely for Educational Purposes. We strongly suggest our followers to "Learn to Ride the Tide" and consult your Financial Advisors before taking any positions.
If you like our detailed analysis, please do rate us with your Likes, Boost and share your comments
-Team Stocks-n-Trends
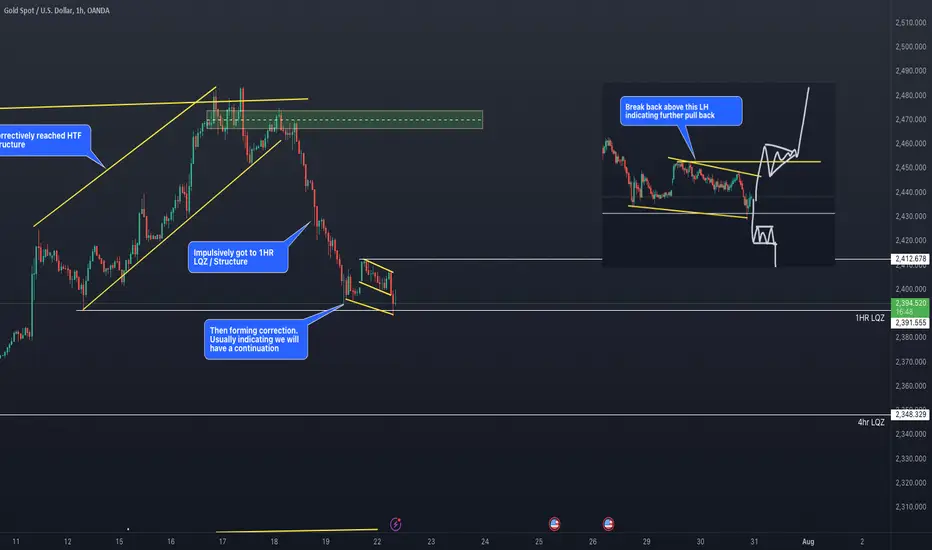
Unlocking XAUUSD Secrets: Prepare for Gold's Next Big Move!Technical Breakdown of XAUUSD
Correctively Reached HTF Structure:
The price has reached a higher time frame (HTF) structure through a corrective movement. This structure serves as a significant resistance level observed on higher time frames.
Impulsively Got Here:
Following the corrective phase, the price made an impulsive move upward, indicating strong buying momentum at that point.
Forming Correction:
After the impulsive move, the price is forming a correction pattern, typically signaling a potential continuation of the previous trend. This pattern is evident as a descending channel or flag formation.
Support and Resistance Levels:
Resistance at 2,412.678: A significant resistance level that the price tested but did not break through decisively.
Support at 1HR LQZ (2,391.555): A key support level on the 1-hour chart where the price found temporary stability.
Support at 4HR LQZ (2,348.039): A more substantial support level on the 4-hour chart, providing a strong base for potential reversals.
Descending Channel Formation:
The price is currently trading within a descending channel. This pattern often suggests a continuation of the prevailing trend upon a breakout.
Key Level Highlight:
Break Back Above Lower High (LH): The chart notes that a break back above the identified lower high (LH) would indicate a further pullback. This level is crucial as it may signal a change in short-term momentum.
Potential Scenarios:
Bullish Scenario:
Breakout Above Descending Channel and LH Level:
If the price breaks out above the descending channel and the LH level, it may indicate a further
pullback and continuation of the upward trend.
The price is likely to test the resistance zone near 2,412.678 and could move higher if it breaks through this zone.
Bearish Scenario:
Failure to Break Above LH Level:
If the price fails to break above the LH level and descends further, it may indicate a continuation of the bearish trend.
The price could test the 1HR LQZ support level first and potentially move down to the 4HR LQZ support level if bearish momentum continues.
Consolidation and Patterns:
The chart suggests that the price is currently consolidating within a tight range, indicating indecision. This could lead to a significant move upon breakout from this consolidation pattern.
Conclusion:
Monitoring the breakout direction from the current descending channel and the reaction to the LH level will provide valuable insights for potential trading opportunities. Key levels to watch include the 2,412.678 resistance zone and the 1HR and 4HR LQZ support levels. A breakout above the descending channel would favor a bullish scenario, while a failure to break above the LH level could suggest continued bearish pressure.
Weekly Outlook - EUR/USD, AUD/JPYHey everyone!
Here's my ongoing analysis on a couple pairs:
EUR/USD
-Potential Reversal Pattern
AUD/JPY
-End of an Impulse, Beginning of the Fall?!
*As price develops, individual trade ideas will be published!
-Thanks and Stay Tuned!

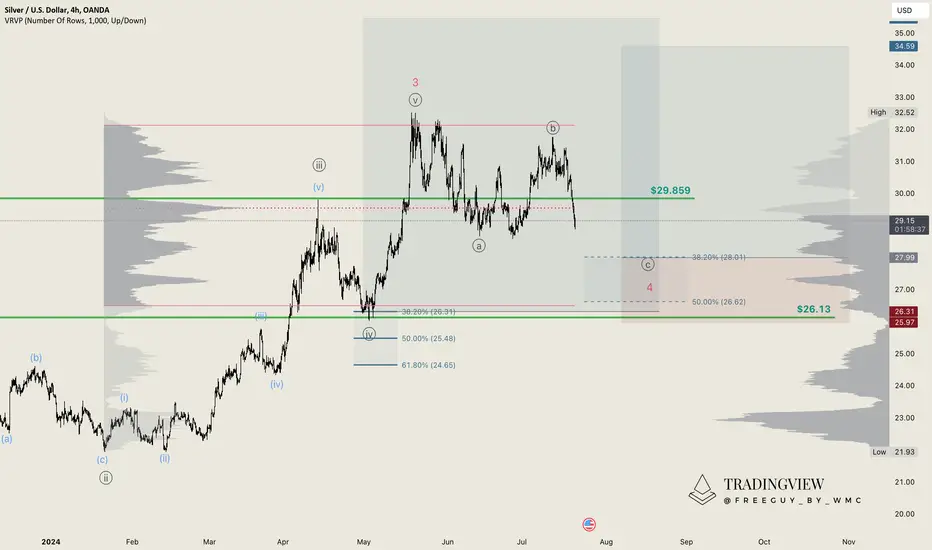
Silver (XAGUSD): Anticipating a Wave 4 CorrectionSince our entry at $26.31, silver has experienced a significant rally, reaching up to $32.50. We anticipate a correction downward to form a Wave 4.
The recent rise to $32.50 indicates a strong upward movement, but now a correction is expected. We expect silver to correct downward into the 38.2% to 50% retracement zone before continuing its upward trend.
Our strategy involves maintaining our current stop-loss level without adjustment while allowing the market to correct. We have already secured some profits, reducing our risk. We are targeting the 38.2% to 50% Fibonacci retracement zone for potential re-entry, which will likely provide a strong support area for the next upward movement.
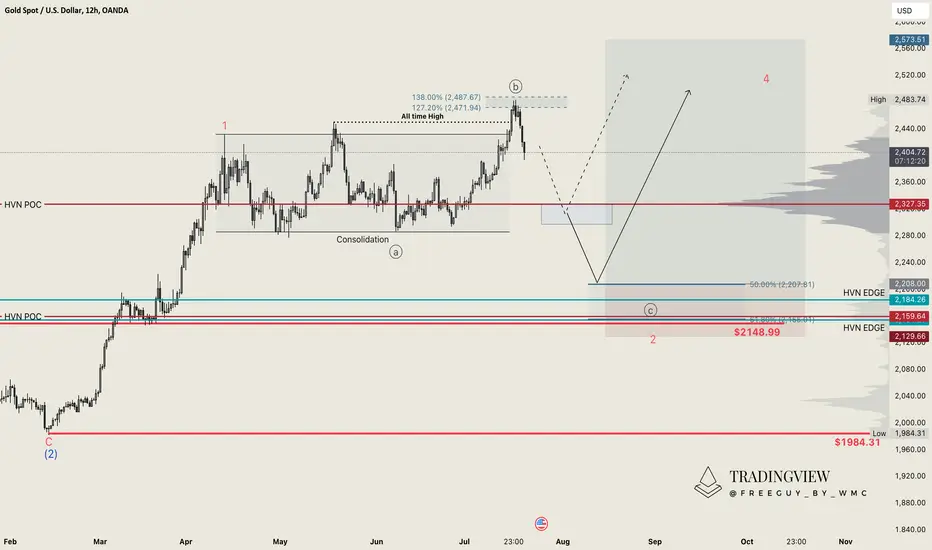
Gold (XAUUSD): New All-Time High - Double Top or Further Surge?Gold has reached a new all-time high, creating either a double top or peaking at a maximum of $2,487. The price turned within a very narrow range between $2,472 and $2,487, which was remarkably precise.
The precise turnaround within the small range indicates significant resistance at this level. Our primary scenario anticipates a pullback towards $2,200 before the trend resumes upward. This level is crucial for confirming a long-term bullish trend. Alternatively, if the price does not pull back and instead rejects at the Point-of-Control, we may see a continued upward movement.
Should the price break above $2,487, we will cancel our long limit order as the bearish pullback scenario would be invalidated.
Bayer (BAYN): End of a long 9-year correctionBayer (BAYN): XETR:BAYN
Upon request from one of our members, we're taking a closer look at Bayer AG. We believe that we are still in an overarching Wave II. This wave finds its last true support at the 88.2% retracement level at €24.51. Falling significantly below this level would likely lead us to see a 100% retracement down to €8.48, which would be severe for a company like Bayer, considering its all-time high was at €144. Observing the chart on a 2-day basis, we note that the Wave 5 extension falls into the zone between 50% and 61.8%, which also includes the 88.2% level. This truly is the last turning point Bayer might have.

Airbnb (ABNB): Time to Short!I love Airbnb for vacations but this chart really isn't looking so good...
It is the only stock we are currently looking to short. Airbnb has consistently shown lower prices since its inception, despite a recent period of higher highs since hitting a low of $82. We remain confident in the continued downward trend.
The movements from point A to B and B to C align well with Fibonacci extension and retracement levels. The retracement for Wave (2) is particularly notable at the 61.8% level. We believe we are currently within Wave (3).
We want to time the short entry based on anticipated Elliott wave counts. We anticipate a further decline in the short term, followed by a potential rise in the coming weeks. We plan to place our short position during this anticipated rise in Wave 2. We will continue to monitor the price action closely and provide a detailed update with exact entry and exit points once we are ready to place the short position.

Johnson & Johnson (JNJ) - Approaching the Reversal ZoneIn April, we anticipated a pullback for JNJ, and since then, the stock has dropped approximately 7%, aligning with our expectations. The current trend suggests further downward movement, reinforcing our previous analysis.
We are focusing on the support zone ranging from $134 to $116, with a potential lower bound at $109, the Corona-Low. The ongoing pullback could represent the completion of Wave (4) within this target zone, aligning with multiple levels.
We are going to be monitoring this for signs of a reversal within this zone. This zone will be crucial to confirm the next possible upward movement.

Bitcoin Is Trading At The Support As Stocks PullsbackHey traders
I this video I will take look at NVIDIA which I think it can be moving into a correction and can possibly be headed down for deeper prices. So if today major stocks indicies will have second red day in a row, then possibly next week there can be more risk-off. In such case I think its better to wait on any long ideas on cryptos (short-term), and wait on much better timing for potential long entires, which can be maybe after summer, or during elections when normal markets tend to be in bull run. Additionally, any rate cut later this year can be alos supportive for stocks and other assets.
When I look at bitcoin, I think that 50k is very good potential support; if it gets there.
Have a nice weekend.
Grega

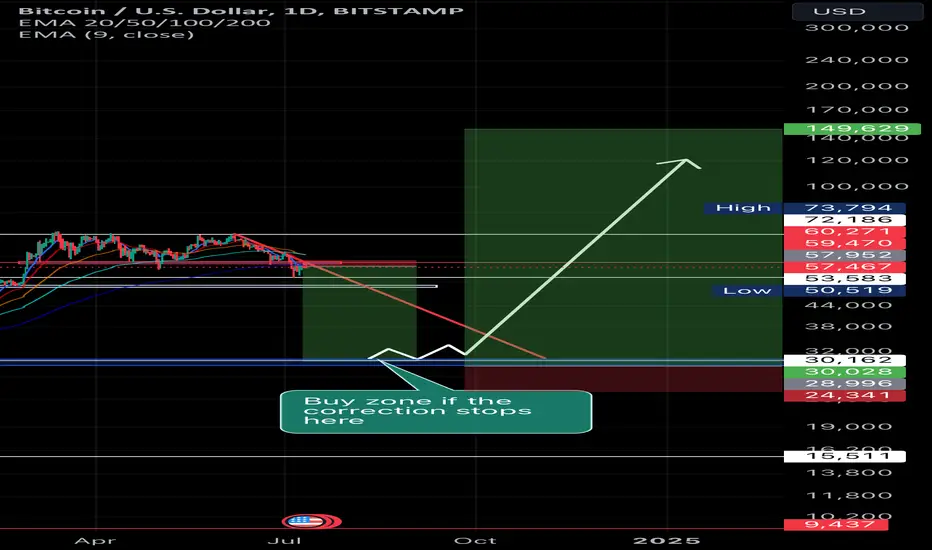
More drops to come; lowerr than 50K. Buy zone around 30K zomeNot going to say much but we all could be wrong or right .. correction isnt over and the sell confirmed for more drops and more correction.
Feeling will drop back down to low 50K again; perhaps it can lower than that; i found the support around in the low 30K area.. so might expect the correction to finish in the 30K zone before skyrocket to the new ATH.
The correction should be finish ill say around end of july into the beginning of august or mid-july and will bulls take off from there and should expect to hit 120K before november or into October.
Im not financial advisor; just the correction isnt finish yet so get reedy for more drops. What are your thoughts?
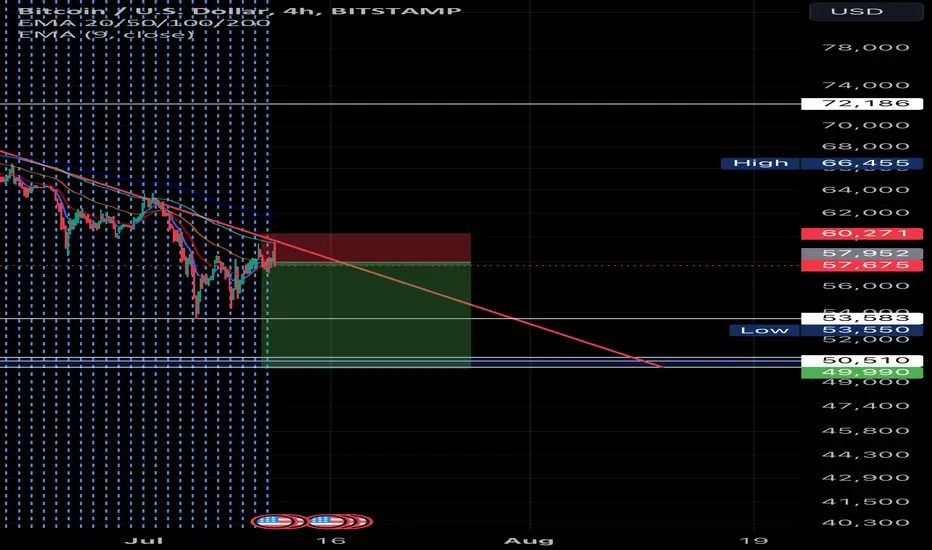
Officially still in the bearmarketIt nuked down to 53K range but feeling its not over it ; it will still go below 57K.
This is pretty mid-short sell.
Do have a 50K feeling will hit even dip below 50K can happen
Im keeping it short as possible cuz i don't see any sign of buyers and bullish quite yet until the correction is finish.
Ill say the prediction won't be finish until we hit 50K even or somewhere around 40K area and i heard rumors that the bulls will get back until reach about 30k-35k
Im not a financial advisor so please don't ask if we hit a good trade; if its a stay away then don't trade and use your own analysis instead. Safe trading yall
GU CORRECTION??GBPUSD In the saturation range of buyers is getting out buyers from market and the price is collecting stop losses to attract forces for a correction towards the lower levels .

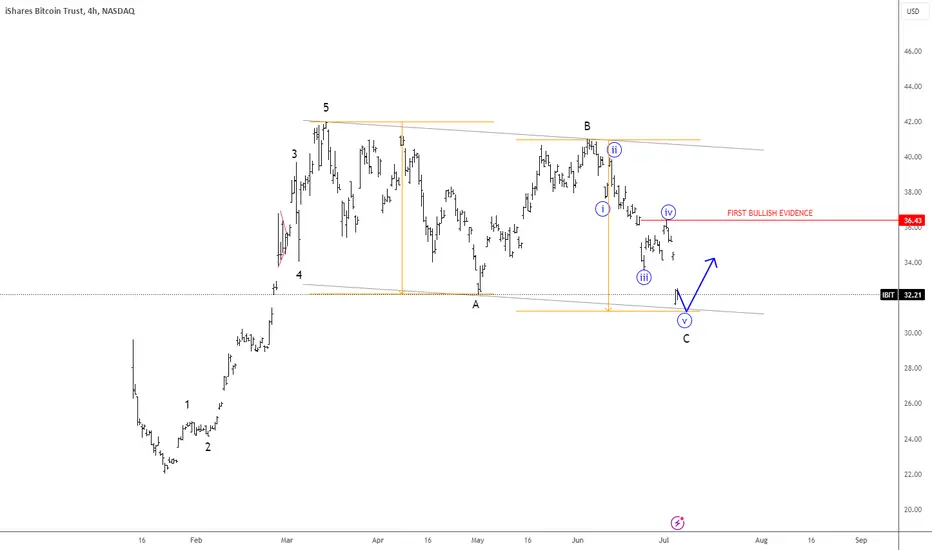
BlackRock Bitcoin ETF Could Be Finishing A CorrectionBlackRock Bitcoin ETF with ticker – IBIT looks like a nice and clean A-B-C correction that is right now sitting at interesting support area for A=C, but to confirm support in place and bulls back in the game, we need to see sharp or impulsive recovery back above 36.43 level.
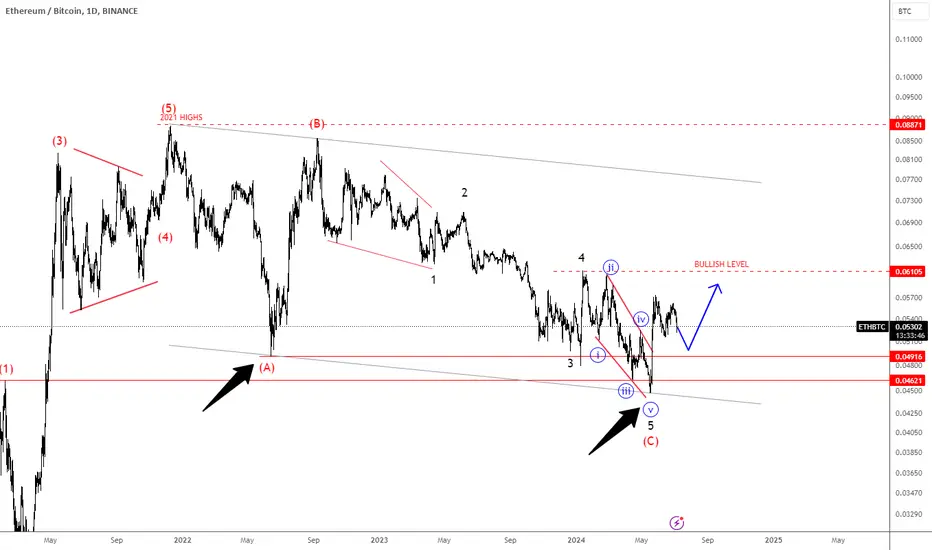
Is ETHBTC Pair Turning Bullish?ETHBTC pair can be turning bullish, as we see strong rebound after a completed corrective decline by Elliott wave theory.
We talked about ETHBTC pair back on May 14th, where we mentioned and highlighted the completion of an (A)-(B)-(C) corrective setback with the wedge pattern within wave 5 of (C).
As you can see today on July 05, ETHBTC pair bounced from projected 0.045 support area, which can be signal that it’s turning back to bullish mode, especially if breaks back above 0.061 region.
Regarding dominance in the Crypto market, ETHBTC chart can be one of the reasons that ALTcoin dominance may kick in soon, so new ALTseason could be around the corner.