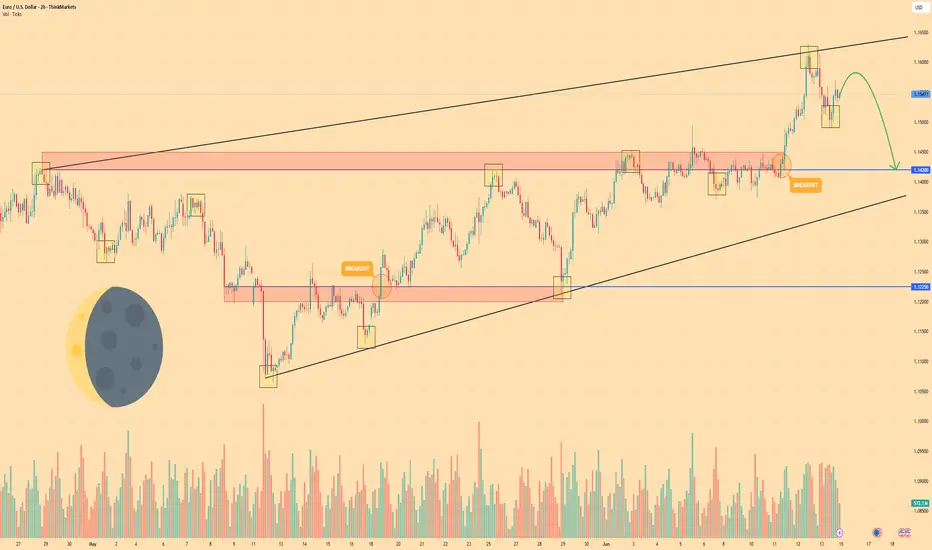
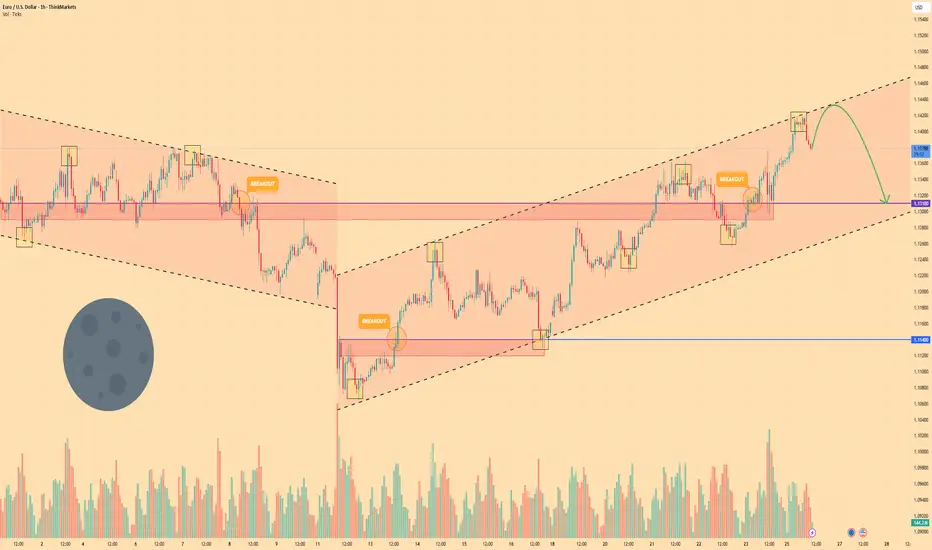
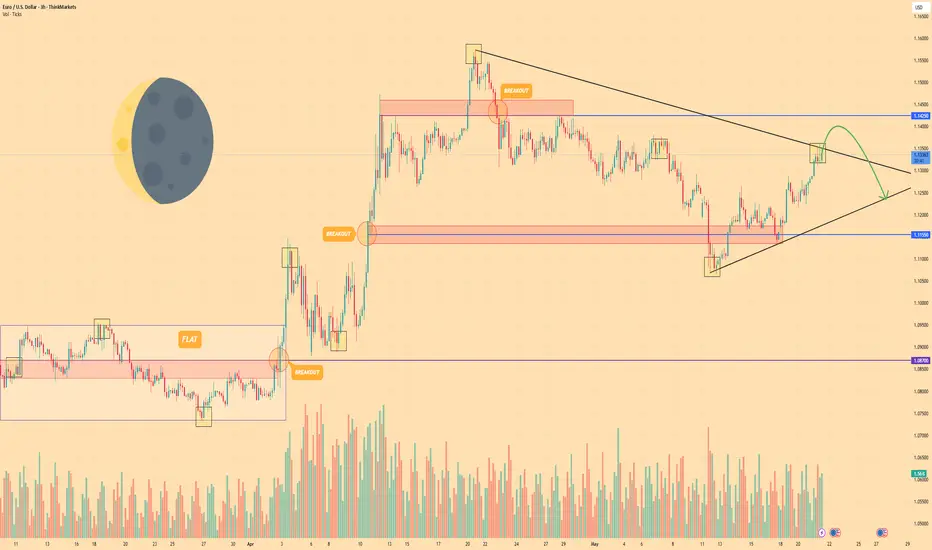
EURO - Pirce can make movement up and then drop to $1.1420Hi guys, this is my overview for EURUSD, feel free to check it and write your feedback in comments👊
After entering the wedge, Euro began to slow down, creating a tightening structure between support and resistance.
Price corrected toward the support line of the wedge, where it briefly paused and bounced with weak momentum.
The bounce triggered a breakout above local resistance, but buyers failed to hold the price at higher levels.
Soon after, the market reversed from the wedge’s upper boundary and began forming a bearish rejection pattern.
Now price trades just below the recent highs, showing fading demand and early signs of short-term reversal.
I expect Euro to move lower and reach the $1.1420 support level — my current target in this scenario.
If this post is useful to you, you can support me with like/boost and advice in comments❤️
Disclaimer: As part of ThinkMarkets’ Influencer Program, I am sponsored to share and publish their charts in my analysis.
Correction
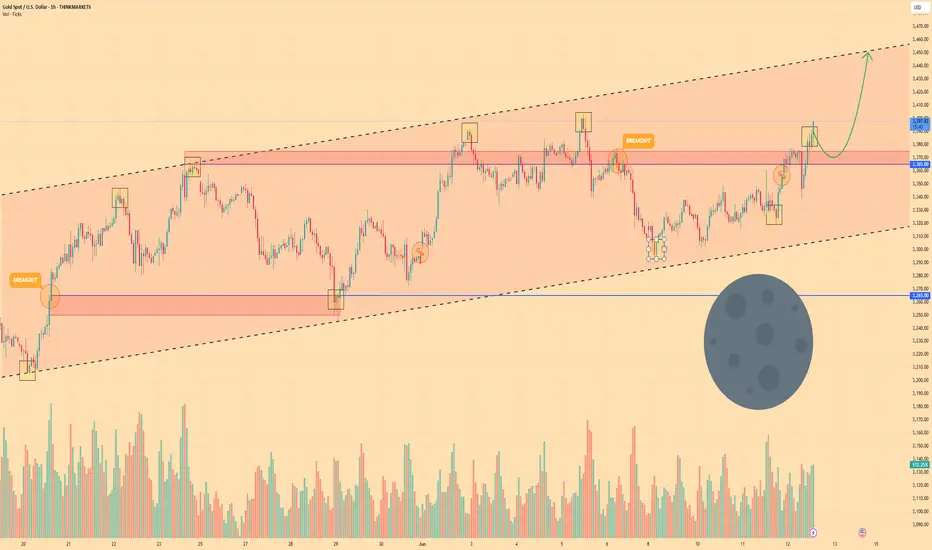
GOLD - Price can correct to support level and then bounce upHi guys, this is my overview for XAUUSD, feel free to check it and write your feedback in comments👊
Gold entered a Rising Channel structure, demonstrating stable growth with higher highs and higher lows.
After testing and breaking through the $3265 support level, the price pulled back slightly and then resumed its upward momentum.
This move confirmed buyer strength and renewed interest in the mid-channel zone.
Recently, Gold successfully retested the $3365–$3375 support area, turning it into a local springboard.
Now price is gaining traction above this zone and appears to be preparing for a continuation of the current trend.
I expect it to rise toward the $3450 target — the upper resistance of the channel.
If this post is useful to you, you can support me with like/boost and advice in comments❤️
Disclaimer: As part of ThinkMarkets’ Influencer Program, I am sponsored to share and publish their charts in my analysis.
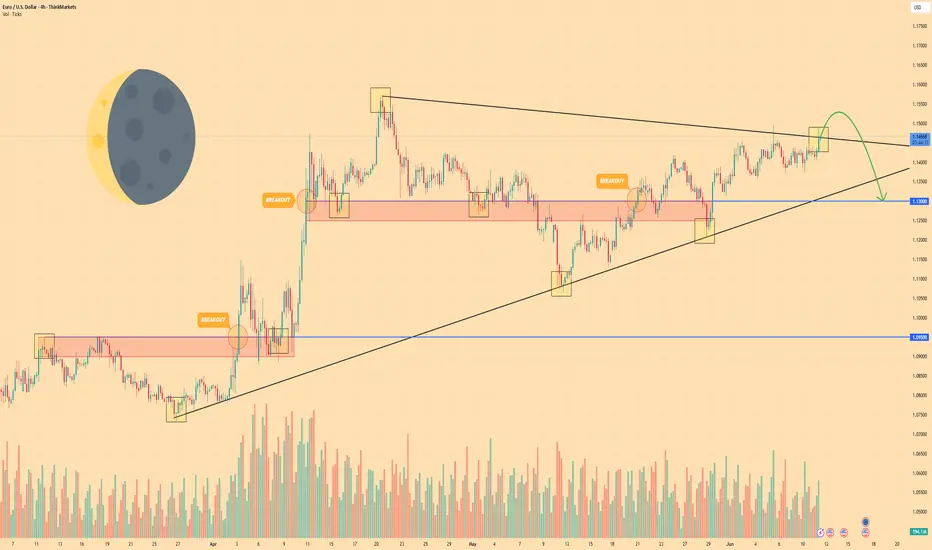
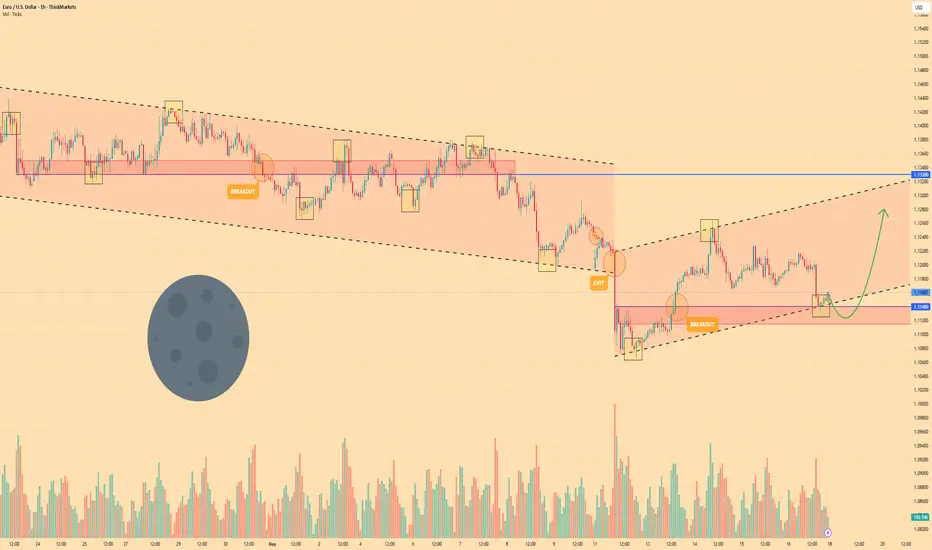
EURO - Price will exit from pennant and then make correctionHi guys, this is my overview for EURUSD, feel free to check it and write your feedback in comments👊
Some days ago price reached $1.0950 level and then made a correction movement, after which started to grow in a pennant.
Price made an upward impulse from support line of pennant and broke $1.0950 level, after which made a retest.
Then price continued to move up and reached $1.1300 level, and soon broke it too, and then made a correction movement.
After this, price rose to resistance line of pennant and then started to decline and soon broke $1.1300 level again.
But later it boucned from support line and backed up, and even now it trades very close to resistance line.
In my mind, Euro can rise a little, thereby exiting from pennant and then make a correction to $1.1300 level.
If this post is useful to you, you can support me with like/boost and advice in comments❤️
Disclaimer: As part of ThinkMarkets’ Influencer Program, I am sponsored to share and publish their charts in my analysis.
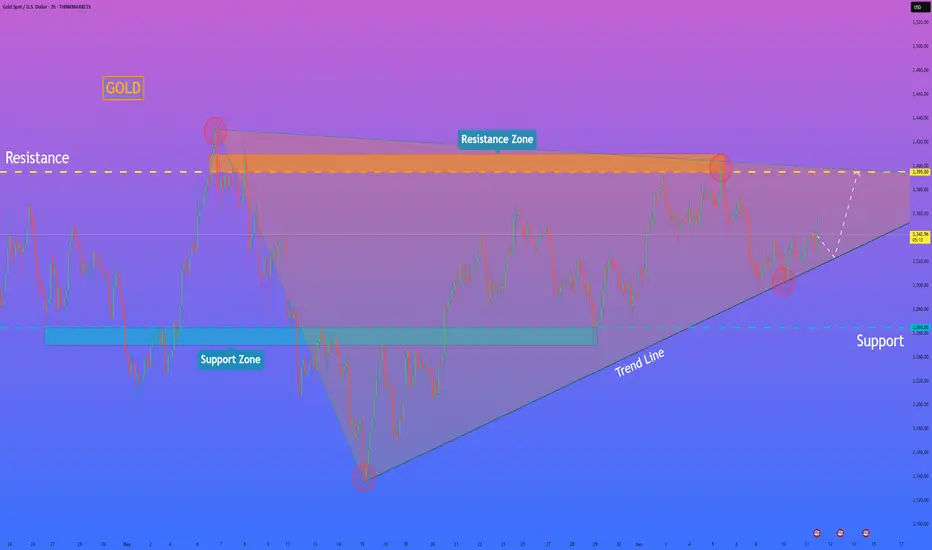
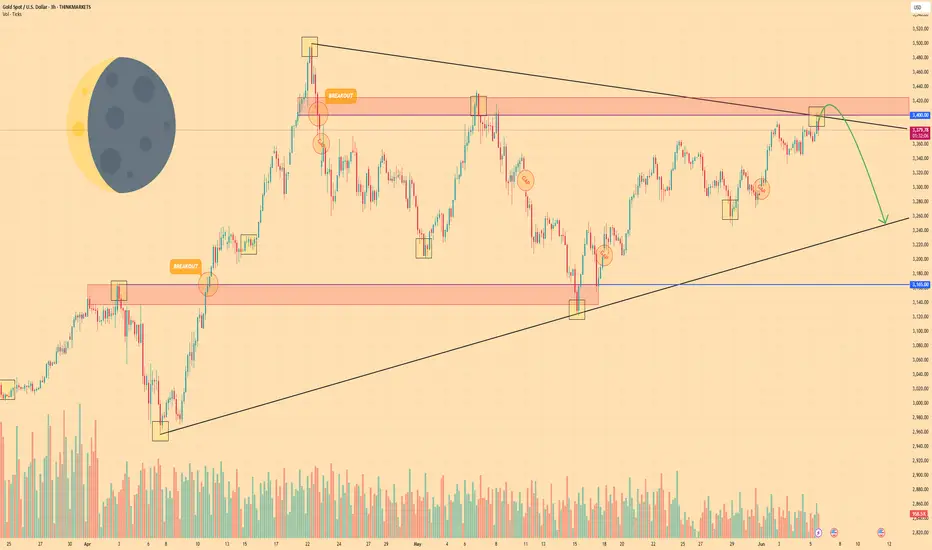
HelenP. I Gold may bounce from trend line to resistance levelHi folks today I'm prepared for you Gold analytics. After observing this chart, I see that the price tried to grow to the resistance level first, but failed and dropped to the support level, which coincided with the buyer support zone. After this correction movement, XAU rebounded up and then dropped below the support level, breaking it. But soon, price turned around and made impulse up, breaking the 3265 level, after which it continued to move up to the resistance level. When Gold reached this level, it entered to resistance zone, where it turned around at once and made a strong movement down to the trend line, breaking two levels. Also then it started to trades inside a triangle, and soon turned around from the trend line and made a strong impulse up. Price broke the 3265 support level one more time, rose a little more, and then made a correction. After this, price continued to move up and soon reached the 3395 resistance level, after which it turned around and fell to the trend line, which is the support line of the triangle as well. Recently, it started to grow, so I expect that XAUUS will correct to the trend line and then continue to move up to the resistance level. That's why the 3395 resistance level is my current goal. If you like my analytics you may support me with your like/comment ❤️
Disclaimer: As part of ThinkMarkets’ Influencer Program, I am sponsored to share and publish their charts in my analysis.
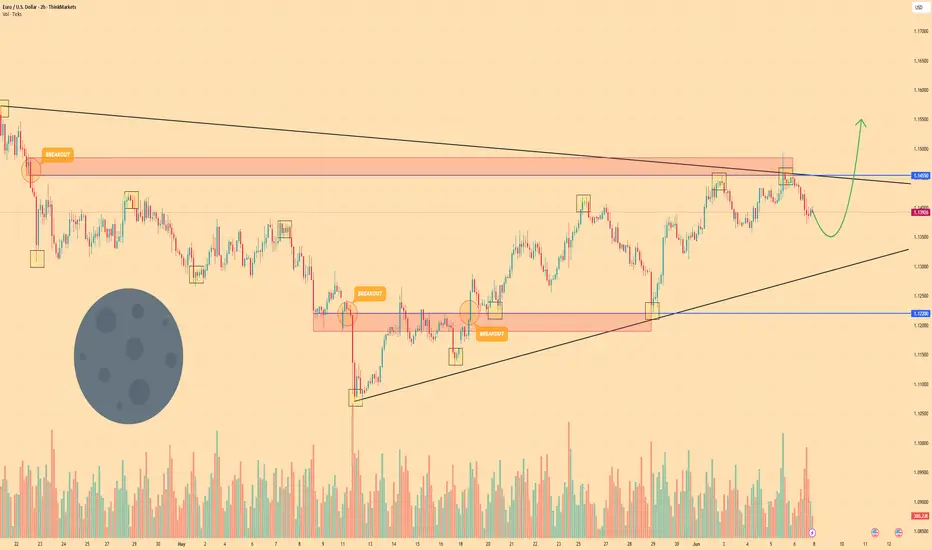
EURO - Price will strart to grow and exit from wedge patternHi guys, this is my overview for EURUSD, feel free to check it and write your feedback in comments👊
Price entered to wedge pattern and at once dropped below $1.1455 level, breaking it and then some time traded below.
It continued to decline and in a short time reached $1.1220 level and broke it, after which fell to support line.
Then price started to grow and soon broke $1.1220 level one more time, after which made a retest and continued to grow.
Euro rose to $1.1420 points and then corrected to support level, after which turned around and rose to resistance level.
Recently price reached resistance level, but then it bounced and started to decline, and now it continues to fall.
I think that Euro can decline a little more and then bounce up to $1.1550, exiting from wedge.
If this post is useful to you, you can support me with like/boost and advice in comments❤️
Disclaimer: As part of ThinkMarkets’ Influencer Program, I am sponsored to share and publish their charts in my analysis.
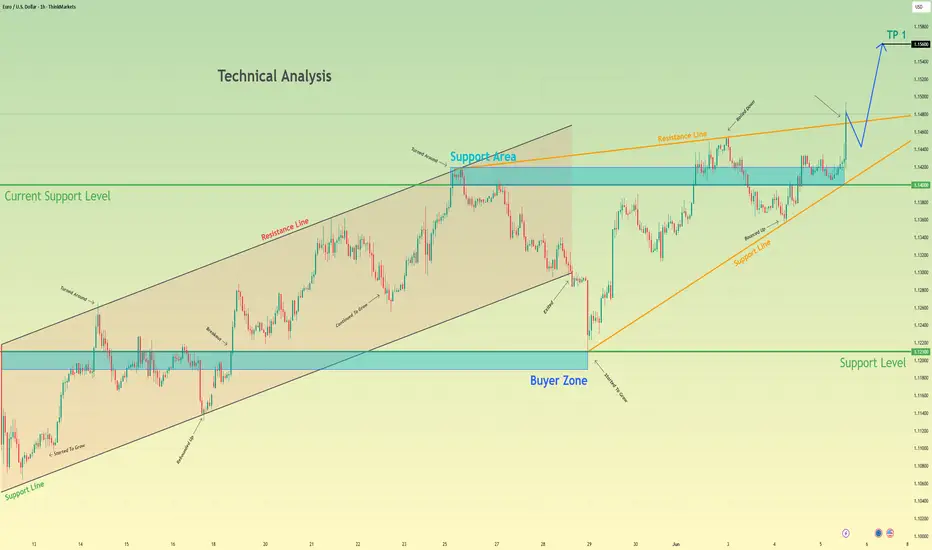
Euro will correct a little and then continue to move up nextHello traders, I want share with you my opinion about Euro. Observing this chart, we can see how the price entered to upward channel, where it at once dropped from the resistance line to the support line and then started to grow. In a short time price rose to the 1.1210 level, broke it, and even rose a little more, but soon turned around and declined to the support line of the channel. Then the Euro made an upward impulse, and then broke the 1.1210 level one more time and continued to grow inside the channel. Later price reached the resistance line of the channel and then corrected, after which, in a short time rose to the support area, breaking the 1.1400 level. But soon the price turned around and dropped to the 1.1210 level, thereby exiting from channel. Next, Euro continued to grow inside the wedge, where it rose to the current support level and soon broke it. After this, the price rose to the resistance line of the wedge and then corrected, after which it made an upward impulse. Price exited from the wedge, and now I think that the Euro can make a correction, after the rise, and then continue to grow next. That's why I set my TP at 1.1560 points. Please share this idea with your friends and click Boost 🚀
Disclaimer: As part of ThinkMarkets’ Influencer Program, I am sponsored to share and publish their charts in my analysis.
GOLD - Price can drop to support line of triangle patternHi guys, this is my overview for XAUUSD, feel free to check it and write your feedback in comments👊
In this chart price formed a triangle pattern, where it first declined to support line and then made an impulse up.
After this, Gold broke $3165 level and, after a small correction reached and broke $3400 level too.
Then it rose to resistance line of triangle and dropped below $3400 level, breaking it one more time.
Price tried to back up, but failed and dropped more to support line of triangle, after which started to grow.
In a short time price rose to resistance line of triangle, which coincided with resistance level and area.
Now, I think that Gold can drop from resistance area to $3250 point of support line of triangle.
If this post is useful to you, you can support me with like/boost and advice in comments❤️
Disclaimer: As part of ThinkMarkets’ Influencer Program, I am sponsored to share and publish their charts in my analysis.
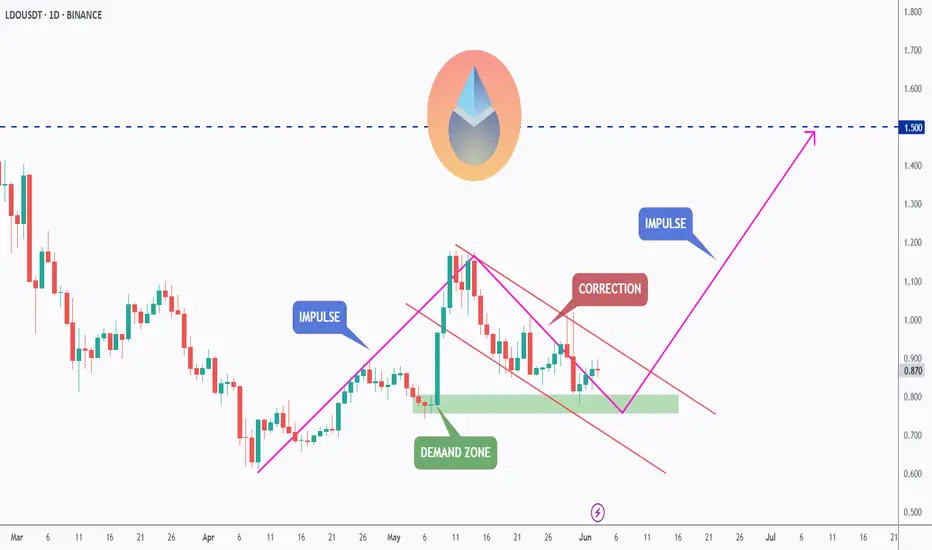
LDO - Next Impulse Starting Soon!Hello TradingView Family / Fellow Traders. This is Richard, also known as theSignalyst.
After breaking above the $0.8 major high, LDO has shifted from bearish to bullish from a long-term perspective. 📈
This week, it has been undergoing a correction phase within a falling channel marked in red. 🔻
For the bulls to take over and kick off the next impulsive wave toward the $1.5 mark, a breakout above the upper red trendline is needed. 🚀
📚 Always follow your trading plan regarding entry, risk management, and trade management.
Good luck!
All Strategies Are Good; If Managed Properly!
~Rich
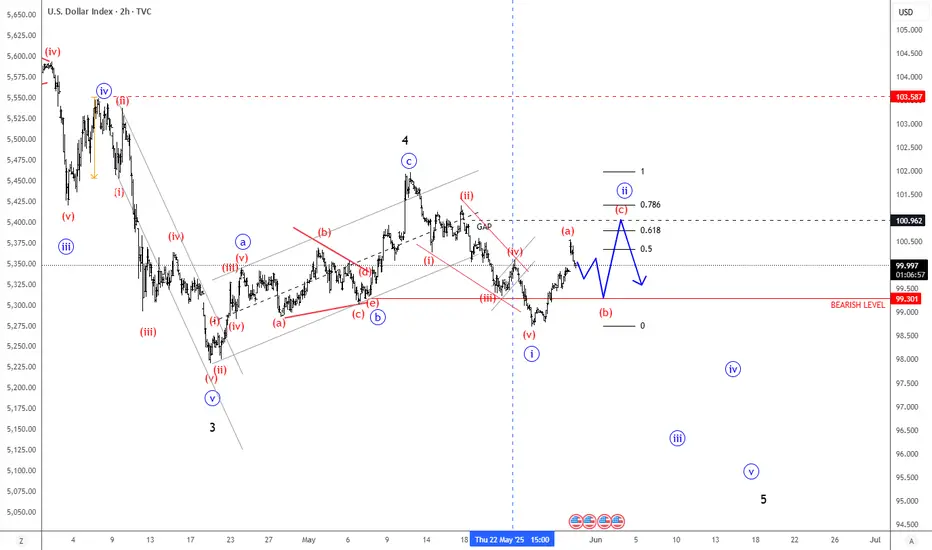
USDollar Is Making An Intraday Pullback Within DowntrendGood morning traders! Stocks keep pushing higher along with yields, so it looks like 10Y US Notes could still see lower support levels, and that’s why USdollar is in a bigger intraday correction. What we want to say is that while the 10Y US Notes are still searching for support, the DXY can stay in recovery mode or at least sideways. In the meantime, stocks can easily see even higher levels after NVIDIA surpassed earnings.
Looking at the intraday USDollar Index – DXY chart, we see a leading diagonal formation, so we are tracking now an intraday abc correction before a bearish continuation, thus keep an eye on GAP from May 18 around 101 level that can be filled and may act as a resistance before a bearish continuation.
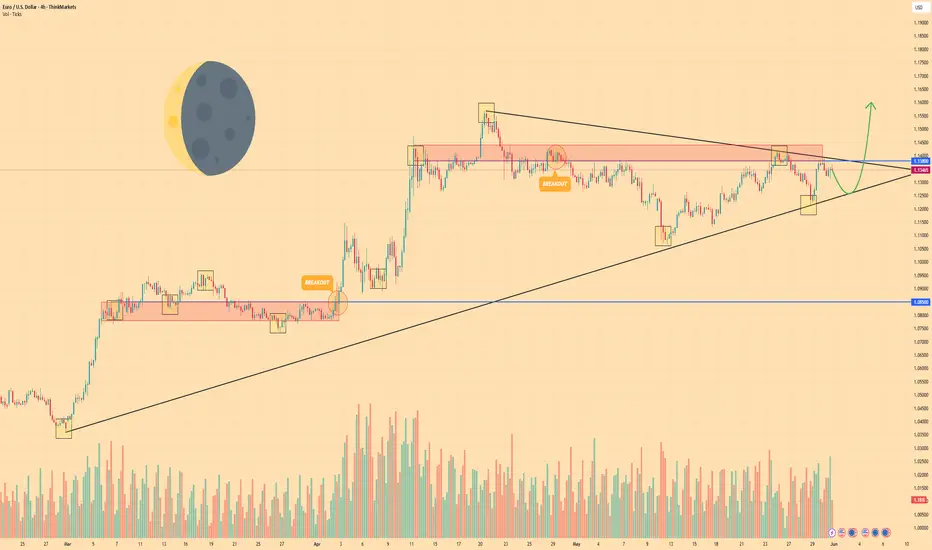
EURO - Price can boucne up of pennant, breaking resistance levelHi guys, this is my overview for EURUSD, feel free to check it and write your feedback in comments👊
Some time ago, price entered to pennant pattern, where it at once bounced up from support line and reached $1.0850 level.
Next, it broke this level and continued to grow to resistance level, and when Euro reached it, price broke it.
But, after price reached resistance line of pennant, it started to decline and soon broke $1.1380 level one more time.
Price fell to support line of pennant and then turned around and, in a short time rose to resistance area.
After this, price fell to support line of pennant, but recently started to grow and now trades near resistance level.
I believe Euro can correct slightly and then launch upward toward $1.1600, breaking resistance level.
If this post is useful to you, you can support me with like/boost and advice in comments❤️
Disclaimer: As part of ThinkMarkets’ Influencer Program, I am sponsored to share and publish their charts in my analysis.
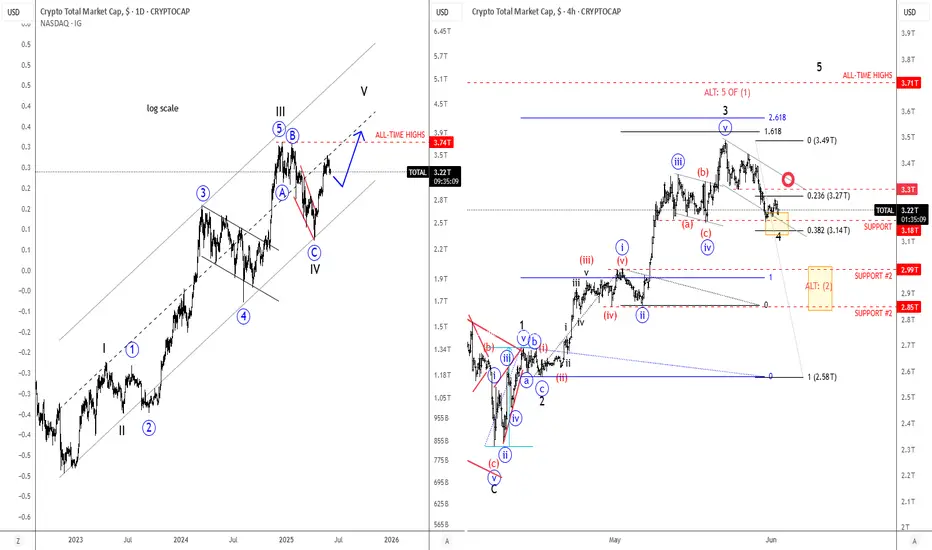
Crypto Market Slows Down For A Correction Within UptrendCrypto market nicely slowed down as expected and Crypto TOTAL market cap chart can now be finishing a projected wave 4 correction right at the former wave "iv" swing low and channel support line, which is ideal textbook technical picture that can now send the Crypto market higher for wave 5, especially if bounces back above 3.3T area and channel resistance line.
However, even if it's going to face deeper and more complex correction within higher degre wave (2) down to 3.0T - 2.8T area, sooner or later we can expect a bullish continuation, as Crypto TOTAL market cap chart is not at the all-time highs yet.
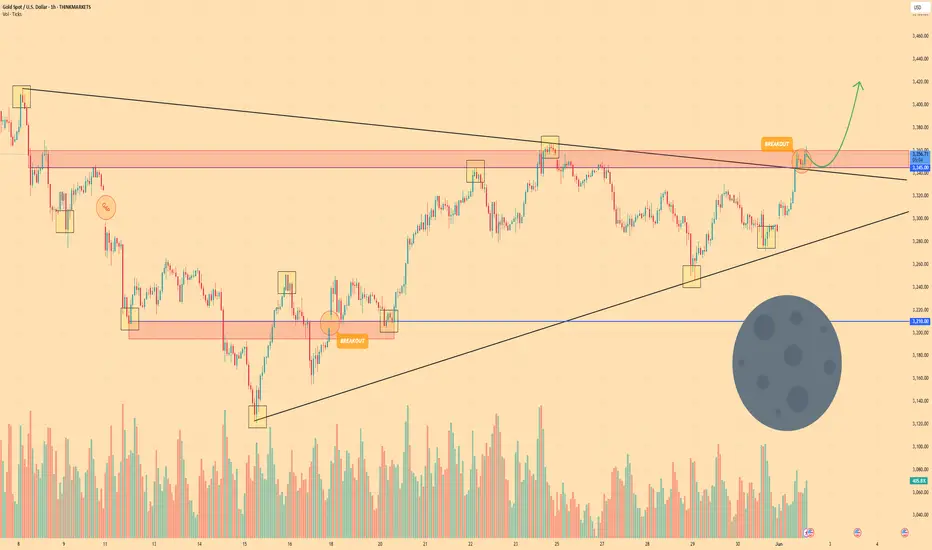
GOLD - Price can bounce up from support level to $3420Hi guys, this is my overview for XAUUSD, feel free to check it and write your feedback in comments👊
Recently, price entered to triangle, where it rebounded from resistance line and dropped to support line.
Also, price broke $3345 with $3210 levels, after which it turned around and rose to $3210 level, broke it.
Then Gold made retest, and then continued to grow to $3345 level, and even rose to resistance line of triangle.
And then started to decline to support line of triangle, after which it turned around and made an impulse up.
Price exited from triangle and broke $3345 level, which coincided with resistance area, and now trades inside.
I think that Gold can correct to support level and then continue to grow to $3420 points.
If this post is useful to you, you can support me with like/boost and advice in comments❤️
Disclaimer: As part of ThinkMarkets’ Influencer Program, I am sponsored to share and publish their charts in my analysis.
Bitcoin Short-Term, Aims Below $100,000 (Alert!)Good morning my fellow Cryptocurrency trader, overall, the market looks great.
The market looks great but never forget that nothing is set in stone, market conditions can always change.
Let's consider Bitcoin for once on the short-term timeframe.
The long-term timeframes are good to spot the bigger cycle; the smaller timeframes are good to know what will happen next.
— Bitcoin 4H TF (Short-term)
Bitcoin hit a new all-time high and was followed by a strong bearish volume session. The action went on to move below a strong resistance zone, the ath range.
Now Bitcoin is trading below "local resistance" and this opens up a bearish bias short-term. When it moves back above $110,000, we can say the bulls are back in. When it trades below $106,000, we can say bearish confirmed.
Here we can see Bitcoin bearish while aiming lower.
If it continues dropping, 100K won't be the end. Either it recovers now, or else we will see a test of the low 90Ks.
Leave a comment if you agree.
Follow if you disagree.
Thank you for reading.
Namaste.

EURO - Price can rise a little and then start to declineHi guys, this is my overview for EURUSD, feel free to check it and write your feedback in comments👊
Some time ago, price entered a falling channel, where it broke through $1.1310 level at once, but soon broke it again.
Price traded near this level for some time, after which it reached resistance line and continued to decline.
Then price broke $1.1310 level and dropped to $1.1065 level, after which it turned around and started to grow within the channel.
In the rising channel, Euro broke $1.1140 level and continued to grow, but later made a correction to this level.
After this, price continued to grow and later broke $1.1310 level, then rose to the resistance line of the channel.
I expect that Euro will rise to resistance line and then start to decline to the $1.1310 support level.
If this post is useful to you, you can support me with like/boost and advice in comments❤️
Disclaimer: As part of ThinkMarkets’ Influencer Program, I am sponsored to share and publish their charts in my analysis.
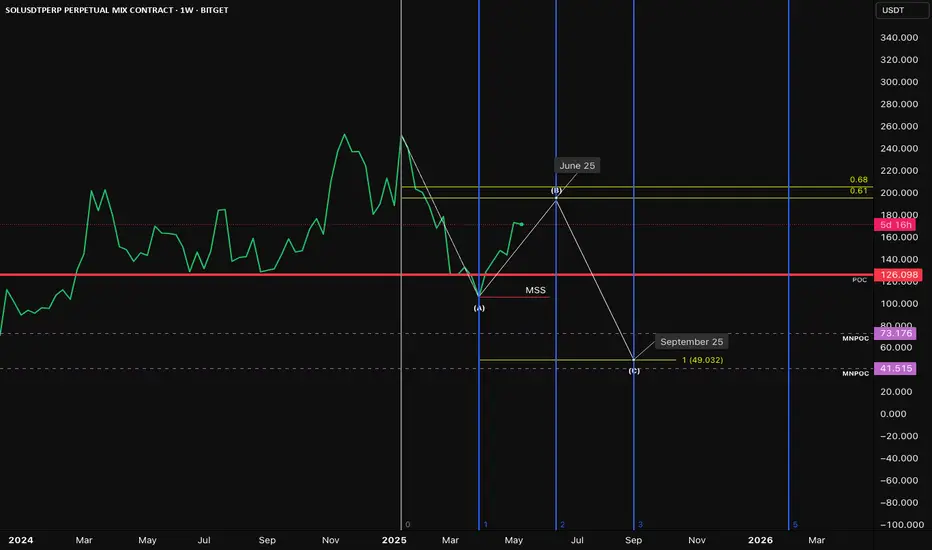
Just a Thought: What If the Big Bull Run Starts Next February?Chart: SOLUSDT Perpetual (1W)
Let’s play devil’s advocate for a second…
📉 What if:
The most recent pullback from Solana’s all-time high wasn’t just a dip to find support, but a high timeframe market structure break (MSS)?
We wicked right into the Point of Control (POC) at $126, a critical level going back to Solana’s inception. Many saw that as a liquidity sweep, which it is, but what if that break was confirmation of a shift in the macro structure?
Since then, we’ve seen a corrective rally, and as of now, price is approaching the golden pocket (0.618–0.65) around the $200 region coupled with time Fib confluence around June 25.
⚪ The ABC Hypothesis:
There’s a clean potential for an (A)-(B)-(C) correction. If the market can’t push through the $200 resistance in June, we could see a dragged out move down into the 1:1 extension, which interestingly aligns with key monthly naked POCs (MNPOCs) at $73 and $41, and specifically the 1:1 at $49 (highlighted on the chart for September 25).
That would create a textbook ABC correction, where:
• A = drop from ATH to MSS
• B = golden pocket retracement
• C = 1:1 extension, sweeping long-term liquidity
📅 What if the real bull run doesn’t start until Feb 2026?
Everyone’s calling for the big breakout this year… but what if we need one last washout to fully reset? That timing aligns eerily well with early Q1 2026, after a final leg down.
Chart Legend:
• ✅ Green line = current price
• 🔴 POC = Point of Control (macro volume node)
• ⚪ White lines = ABC structure
• 🔵 Blue verticals = time-based Fibonacci
• 🟡 Golden Pocket = 0.618–0.65 retracement
• 🟣 MNPOC Levels = untested monthly points of control
Just a theory. Not advice. DYOR.
What do you think? Could the real reset be coming?
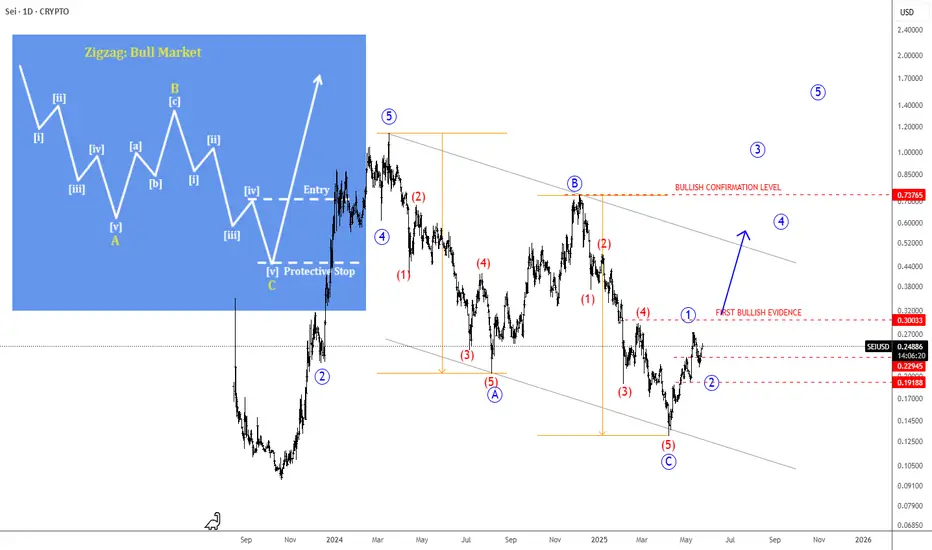
SEI Turns Bullish After A Zig-Zag CorrectionSEI Turns Bullish After A Zig-Zag Correction, as we see it sharply bouncing from projected support that can send the price higher by Elliott wave theory.
SEI with ticker SEIUSD is waking up exactly from the channel support line and equality measurement of waves A=C, which is perfect textbook support for subwave (5) of an impulse into wave C of an ABC zig-zag correction. It's actually nicely and impulsively rising for wave 1, so after current wave 2 pullback, be aware of a bullish continuation within wave 3 of a five-wave bullish cycle, especially if breaks above 0.30 first bullish evidence level.
Sei (SEI) is a high-performance Layer 1 blockchain designed specifically for decentralized finance (DeFi) and decentralized exchanges (DEXs). Launched in August 2023 by Sei Labs, it features innovations like Twin-Turbo Consensus for fast block finality, Optimistic Parallelization for high throughput, and SeiDB for efficient transaction handling. It supports EVM compatibility, enabling seamless deployment of Ethereum-based apps. The SEI token is used for transaction fees, staking, governance, and liquidity.
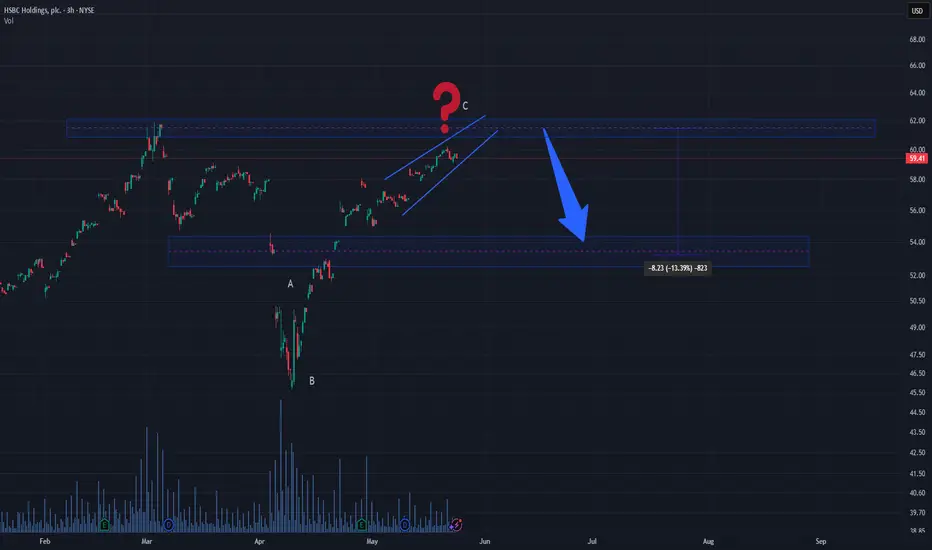
HSBC (HSBC) – $54 Risk Zone if ABC Correction Is Triggered HSBCHSBC is currently trading within a rising wedge, but a potential short-term drop of approximately 5% could trigger a full ABC correction pattern. This scenario is not confirmed yet, as the chart remains structurally bullish.
However, should the price reverse and break below the rising channel, it would likely mark the start of wave C, completing an A-B-C corrective sequence. This development could lead the price toward the $54 support zone, which aligns with a previous demand area.
While there is no immediate breakdown or weakness, traders should remain alert. A simple -5% drop might be all it takes to activate the next phase of correction.
Pattern: Potential ABC correction
Trigger: 5% decline from current levels
Target: $54
Bias: Neutral – watch for reaction if price softens
EURO - Price may make a movement up and then dropHi guys, this is my overview for EURUSD, feel free to check it and write your feedback in comments👊
A few days ago price traded between $1.0870 level inside a flat, where it after fell to bottom part and made an upward impulse.
Price exited from flat, breaking $1.0870 level too, and then made a correction, after which continued to grow.
Later, Euro reached $1.1425 level, breaking recently $1.1155 level recently, and soon price broke $1.1425 level too.
Next, price started to traded inside pennant, where it dropped from resistance line to support line, breaking $1.1425 level again.
Euro fell to support line, after which started to grow and in a short time, rose to resistance line.
Now, I think that Euro may make a movement up and then start to decline to $1.1235 support line of pennant.
If this post is useful to you, you can support me with like/boost and advice in comments❤️
Disclaimer: As part of ThinkMarkets’ Influencer Program, I am sponsored to share and publish their charts in my analysis.
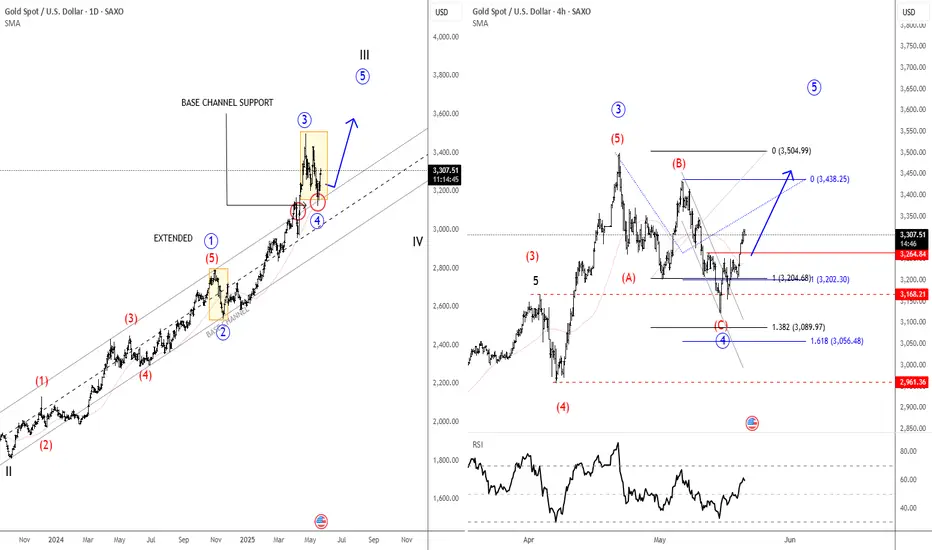
Gold Completes A Correction Within Bullish TrendGold made another sharp leg to the upside in first half of April, even showed some accelerating price action away from the 3,000 level. This suggests it might have been part of wave three when looking at the Daily and 4-hour time frame, so there can be more upside within a much more extended impulse structure. Possibly already now after blue wave four consolidation shows first signs of a bottom near 3120. Notice that pullback from recent high is in three legs, while price recovered out of wave (C) channel, so looks like new recovery is in the cards.
EURO - Price can make small correction and then bounce upHi guys, this is my overview for EURO, feel free to check it and write your feedback in comments👊
Recently, price entered to falling channel, where it at once fell to $1.1330 level and then not long time traded near this level.
Next, price rose to resistance line of channel, and some time traded near, after which dropped.
Price broke $1.1330 level and started to traded below this level, and later it continued to decline in channel.
Later, Euro made a gap and then exited from channel, after which turned around and started to grow in a rising channel.
In this channel, price broke $1.1140 level and continued to move up until it reached resistance line.
Then price corrected, and now I expect that Euro can bounce up from support area to $1.1280 inside channel.
If this post is useful to you, you can support me with like/boost and advice in comments❤️
Disclaimer: As part of ThinkMarkets’ Influencer Program, I am sponsored to share and publish their charts in my analysis.
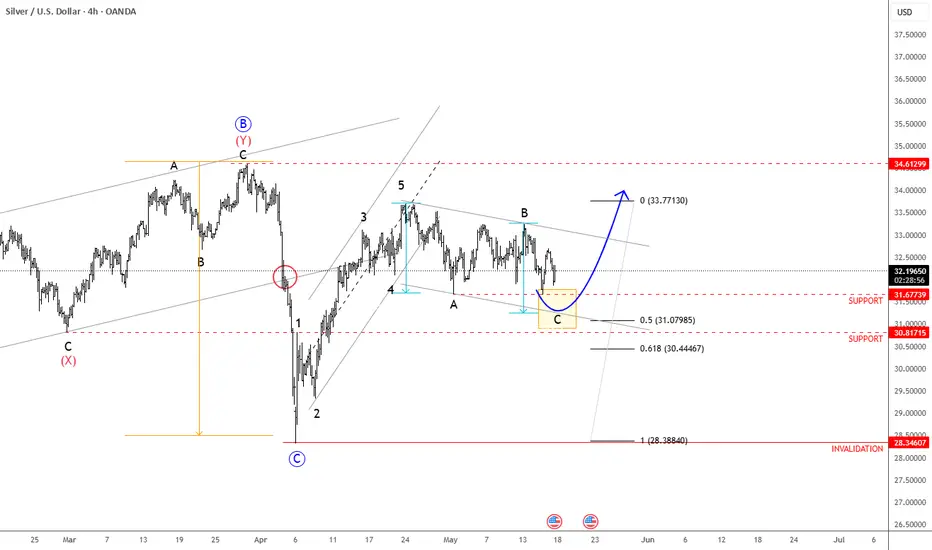
Silver Finds Its Footing—Are the Bulls Back? (Elliott Waves)Silver rebounded quite aggressively in April, following Trump’s decision to impose a 90-day tariff pause. At the time, there was still a lot of uncertainty, so many investors turned to metals as a safe haven—particularly during periods of trade tensions.
More importantly, we can see silver forming five waves up from the 28.34 low. In Elliott Wave terms, when we see a strong directional move that can be counted in five waves, it often represents the beginning of a new trend. That means the current pause is likely just a correction, and more upside should follow.
The 31.00–31.50 area is a very interesting support zone for silver—an area from which we could see a rebound, possibly after a completed A-B-C setback from the 33.70 region.
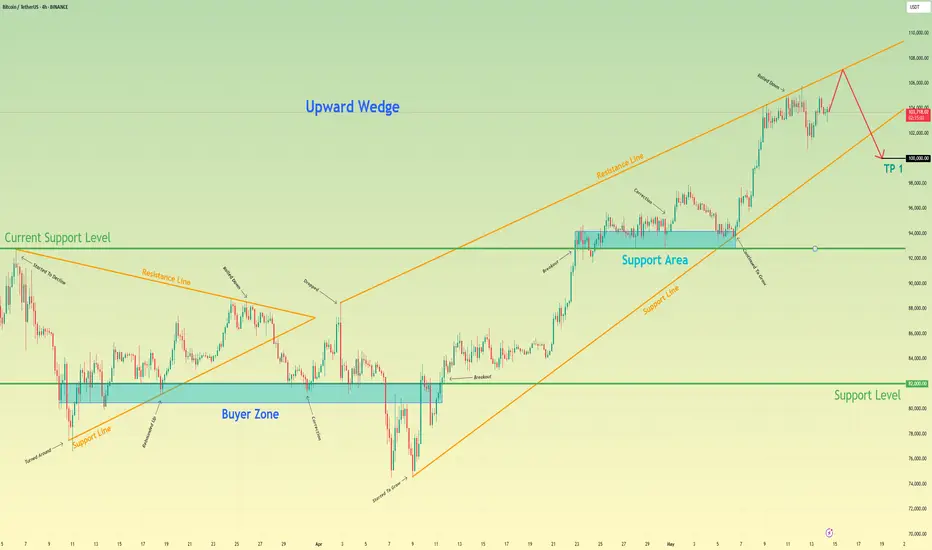
Bitcoin can drop from wedge to 100K pointsHello traders, I want share with you my opinion about Bitcoin. After consolidating for an extended period within a triangle pattern, the price eventually broke out with strong bullish momentum. The move was supported by a solid rebound from the buyer zone and a clean breakout above the 92800 - 94200 support area. This breakout initiated a steep climb, forming a new upward wedge structure, defined by narrowing trend lines and rising local highs. Currently, the price is trading near the resistance boundary of the wedge, around the 104000 - 105000 zone. This zone has already triggered one rejection and is showing signs of weakening bullish strength. Given the rising wedge geometry and the fading impulse strength, the risk of a correction is increasing. The current structure typically leads to a pullback, especially after such a steep rise. I expect that BTC may rise to the resistance line of the wedge and then drop below the support line, thereby exiting from this pattern. That's why I set my TP 1 at the 100K points. Please share this idea with your friends and click Boost 🚀
HelenP. I Gold can decline to trend line and then start to growHi folks today I'm prepared for you Gold analytics. If we look at the chart, we can see how the price after several failed attempts holds in a support zone. The structure of this correction has formed beneath the previously broken trend line, and the price is now approaching it from above. What’s important is that buyers previously stepped in around this level, forming a bounce that allowed the market to reach toward the resistance zone near 3350. This area still remains unbroken, making it a magnet for future bullish targets. Currently, price action shows signs of local weakness, but the broader context favors a potential rebound. The confluence between the horizontal support zone and the descending trend line adds extra technical weight to this level. If price can stabilize here, I expect a retest of 3205, and a potential breakout above it could open the way toward my goal at 3260. This scenario assumes continued respect of the trend line as dynamic support. A clean bounce from it would signal renewed bullish interest, especially if backed by momentum on lower timeframes. If you like my analytics you may support me with your like/comment ❤️
