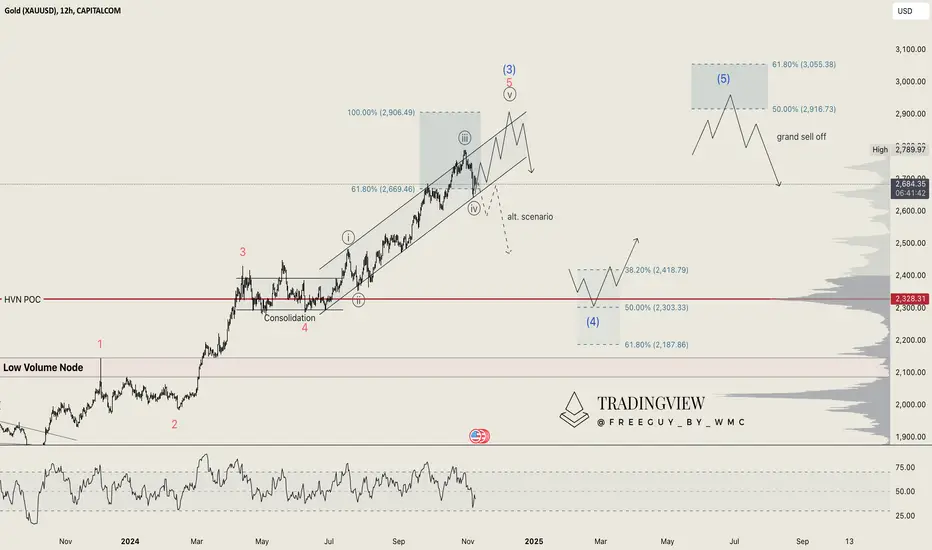
Gold (XAUUSD): Is a Long-Term Cycle Ending Soon?We came across a long-term view of TVC:GOLD on the monthly chart, and it’s hard to ignore what it suggests. Since 1980, Gold has shown clear Elliott Wave structures, with Wave III respecting key Fibonacci extension levels. Now, we appear to be concluding Wave V, which could mark the end of a multi-decade cycle.
While the RSI on the monthly timeframe is overbought, it’s not definitive on its own. However, when paired with the chart structure, it raises concerns. We expect a potential max price for Gold at $3,000, a significant psychological level. If this marks the end of Wave V, Gold could retrace to a range of $1,400-$1,700 as part of a major correction.
An alternate scenario is that we’re still concluding Wave III, with more upside left. Either way, we anticipate a short-term push above the current trend channel, targeting $2,910-$3,000, before a correction for Wave (4). Alternatively, breaking the trend channel prematurely could trigger the start of this correction sooner than expected.
Our short-term target is $2,420-$2,150 before resuming a push to $2,900-$3,000. Alerts are set, and we’ll provide updates or potential setups as this unfolds.
Correction
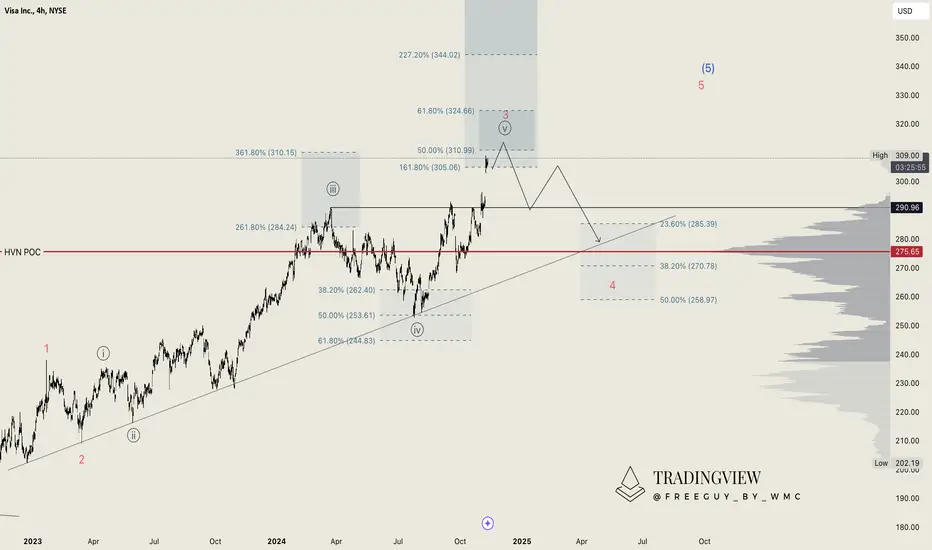
Visa (V): Pullback Incoming After New All-Time HighsVisa ( NYSE:V ) has reached our anticipated wave 3 target, a significant milestone for this stock that has consistently delivered strong performance. Recently, regulators in the EU have begun probing Visa and MasterCard’s fees, assessing their impact on businesses. While this could pose some risks, Visa’s overall trajectory remains promising.
The stock has been setting new all-time highs consistently, but with the potential completion of wave ((v)) and wave 3, we are now looking for a pullback. This correction could offer a great opportunity to open new long positions. Our target range for the pullback is between $280 and $260, though the exact level remains uncertain. Before this, there could still be further upside, with a potential minor retracement between $311 and $325 that would support a bearish short-term outlook.
We are monitoring this closely and have alerts set to act when the time is right. Visa remains a long-term performer, but patience will be key to capitalizing on its next move.
IS XAUUSD CORRECTION OVERIn my recent analysises I warned that a significant correction is xauusd correction in xauusd prices was inveitable.
True to this predication the election of Donald Trump triggered a sharp 1000 minus pips dropin xauusd value However yesterday the market rebounded strongly recovering 700 pips from that intial decline.
The big question now is wether this correction has run its course in my view we may have reached a bottom and xauusd could be poised to resume its overall uptrend.
im currently looking for buying oppurtunities on dips.
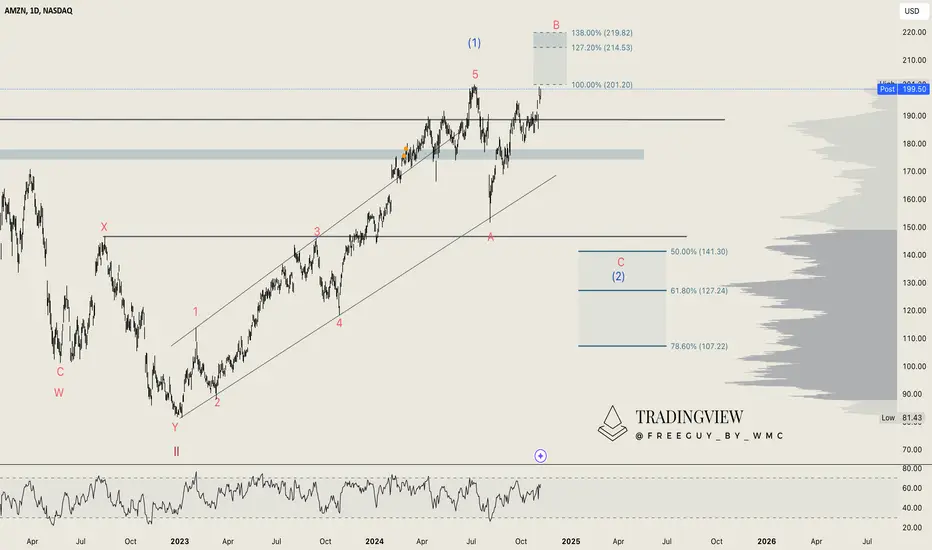
Amazon (AMZN): Approaching critical resistance!Amazon continues its impressive rise, moving out of our initial sharp Wave (2) scenario. Despite the bullish momentum fueled by last Thursday’s earnings report, we remain cautious and are still leaning towards a potential larger pullback. The company showed strong performance in key segments, with CEO Andy Jassy’s strategic focus on expenditure and cost-cutting delivering an 11% revenue increase to $158.9 billion, surpassing analysts’ expectations.
Now, Amazon has reached our second key turnaround zone, between $201 and $220. A move higher would invalidate our bearish outlook, but until then, we are preparing for a potential pullback and targeting lower entry points to capitalize on future upward swings. The stock has recently posted a nearly perfect equal high, alongside a bearish divergence, which could signal an upcoming correction.
The looming U.S. elections could inject significant volatility into Amazon’s price action, with potential wicks forming in either direction. While a move up to $220 would still be considered valid within this structure, we are closely monitoring these levels. As always, we will update you once the bearish scenario is confirmed or invalidated.
Airbnb (ABNB): Bearish Setup or a Bullish Surprise?After finding support at $113, Airbnb NASDAQ:ABNB is experiencing a rapid rise, efficiently collecting all the imbalances left behind from the previous drop. As we approach Airbnb’s earnings report this Thursday, the company is expected to post a year-over-year decline in earnings, despite higher revenues for the quarter ending September 2024. The sustainability of any immediate price changes and future expectations will largely depend on management’s discussion during the earnings call.
While we don’t base our strategy solely on the earnings outcome, it’s crucial to note that a favorable outlook from management could give the stock a short-term boost. Still, despite the potential for this optimism, our analysis remains bearish on NASDAQ:ABNB for the foreseeable future.
Technically, the 61.8% Fibonacci level aligns perfectly with the point of control from the past three years, offering a strong setup. If this level is reached, it would also complete the filling of any remaining price imbalances. This makes for a compelling hedge against our other swing-long positions.
We aren’t setting a limit order just yet. We prefer to observe the market’s reaction to the earnings report before making a move. This could mean placing the limit order the following day, depending on how NASDAQ:ABNB behaves during and after the earnings call. For now, we remain patient and prepared.

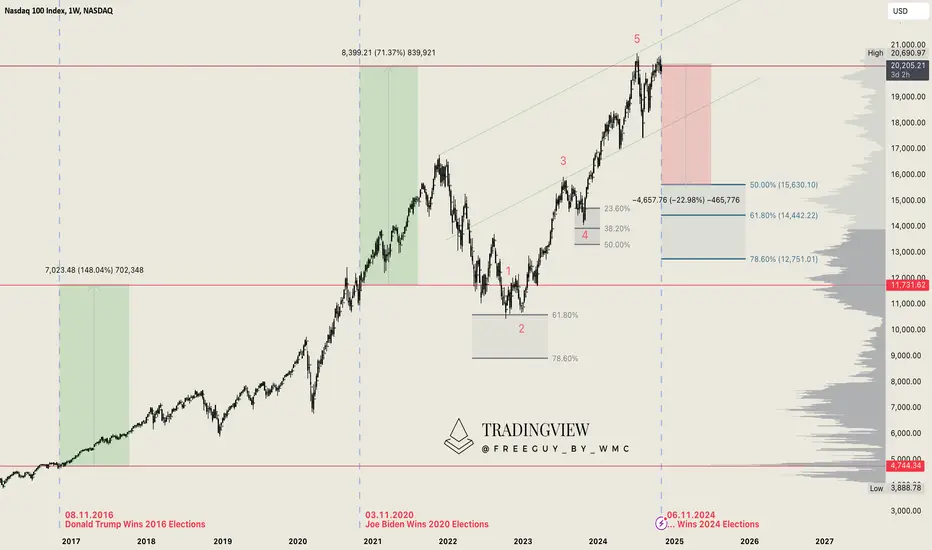
Nasdaq (NDX): US Election Hype vs RealityThe US Elections are just around the corner – a global event that everyone is eagerly anticipating. But the big question remains: Will the election results really have a massive impact on the financial markets? Or, at the end of the day, does it even matter who wins – Kamala Harris or Donald Trump? 🤔
We shared our view months ago: It doesn’t matter who takes the presidency. We firmly believe that a major market correction is inevitable, regardless of the election outcome. The timing? Impossible to predict. But one thing is clear: the warning signs are everywhere. From rising unemployment and skyrocketing debt to relentless inflation, the economic data paints a bleak picture, reinforcing our thesis.
Looking at the weekly NASDAQ:NDX chart, a drop of over 20% could definitely happen. This isn’t something to ignore. But even in the middle of this chaos, there is a golden opportunity: A significant downturn could present a rare chance to accumulate high-quality assets at very cheap prices. This could be the moment to build a perfect portfolio, positioning yourself for long-term gains when the market rebounds.
So, how should you approach this?
See the upcoming volatility as an opportunity, not a threat. Secure your open positions, stay adaptable, keep an eye on the markets, and buy strong assets undervalued.
And most importantly:
Sit back and enjoy the show that both the markets and the political landscape are about to deliver! 🍿
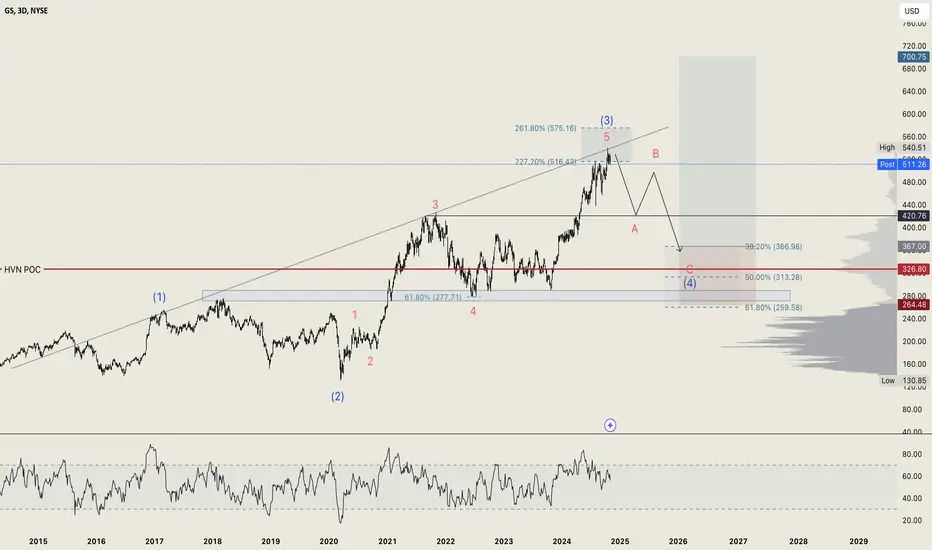
Goldman Sachs (GS): Ready for a Big Correction?As we projected four months ago, Goldman Sachs ( NYSE:GS ) has reached our anticipated upside range between $516 and $575, touching $540 specifically. We've reinforced our analysis with a trend line dating back to 2016, which has been tested and validated three times. Combining this trend line, the Elliott wave count, and key Fibonacci levels, our outlook now points towards a significant pullback from current levels. Given that we're likely dealing with a larger Elliott wave cycle, we anticipate a substantial correction of around 28%.
While a 28% decline sounds extreme, it's not unprecedented for $GS. The drop from the top of wave 3 to the bottom of wave 4 was 35%, and the decline from wave (1) to (2) was almost 50%. Even smaller corrections within these larger waves illustrate that major pullbacks are essential for long-term growth, especially as institutional investors take profits. With Goldman Sachs having gained 87% year-to-date—a remarkable rise in this sector—a correction is likely as big players start locking in their gains.
We aren't sure yet how this correction will unfold, but we anticipate a sharper, quicker drop compared to the more prolonged wave (2) correction. A potential support level for wave A could be around $420. Meanwhile, wave C and the overarching wave (4) are expected to land between $366 and $264.
We are not setting a limit order at the moment but have alerts in place for both scenarios: whether we call the exact top here or see NYSE:GS push higher before pulling back. Either way, we'll be ready and will update you as the situation evolves.
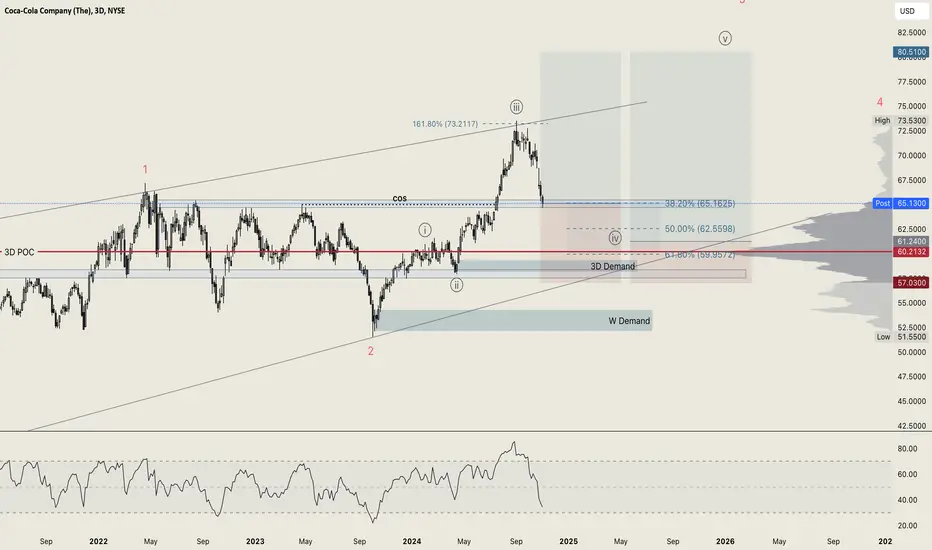
Coca-Cola (KO): Pullback Opportunity as Limit Order FillsOur first limit order for Coca-Cola was filled last Friday as the stock retraced over 11% from its peak at the upper trendline. Despite Coca-Cola's management expressing confidence in their recent performance, investors remain cautious. Zoran Bogdanovic, CEO of Coca-Cola HBC AG, stated, “I am pleased that our Q3 results build on the strength of our first half... However, we remain mindful of macroeconomic and geopolitical challenges.”
This pullback appears to be a natural and necessary correction. Coca-Cola is typically a slow-moving, stable stock, and its surprising 43% rise over the past year warranted a healthy correction. The RSI is inching closer to the oversold zone, and a hidden bullish divergence is forming, lending support to our long-term bullish outlook.
We’re prepared for a deeper retracement and have a second limit order set in the middle of the golden pocket (50-61.8% Fibonacci retracement), just above the Point of Control (POC). Given Coca-Cola’s reputation as a stable “safe haven” stock rather than a volatile investment, we’re maintaining a patient and calculated approach.
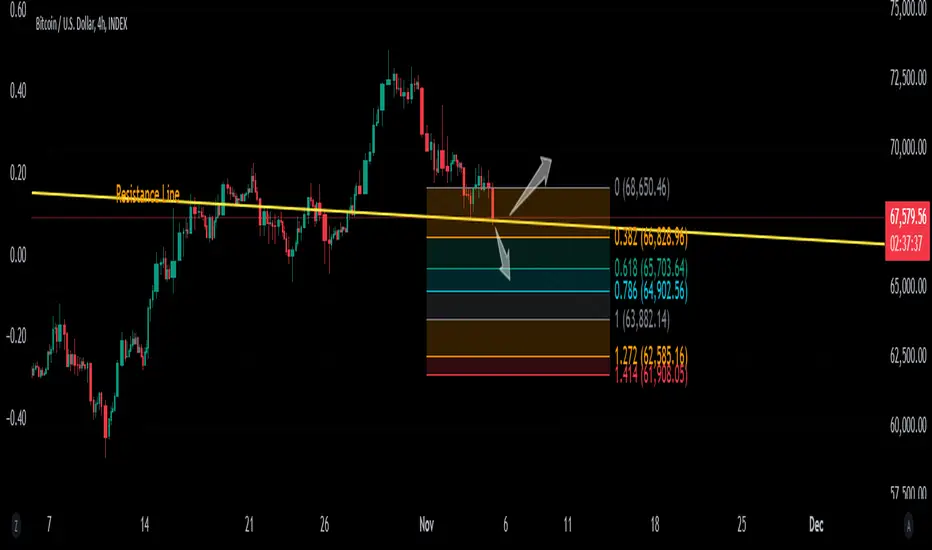
BTC: Awaiting European Market To Dump If Possible.It have been a stagnancy waiting for it to correct its valuation. Let's see how European will react to it.
Nasdaq 100 (QQQ) due for a correction ?US M2 Money stock / Nasdaq 100 (QQQ)
has reached its March's 2000 low.
Bullish divergence on both the RSI and MACD.
The Nasdaq 100 seems due for a correction which
would imply a rebound on this ratio of M2/QQQ

Apple(AAPL): Down 7% – Is This the Opportunity We’ve Waited For?Apple’s stock has experienced a 7% decline over the past 10 days. What’s behind this drop? The fall came despite Apple slightly beating analysts’ expectations for the September quarter, driven mainly by a rebound in iPhone sales. During the fourth-quarter earnings call, CEO Tim Cook discussed positive developments in China but declined to speculate on economic stimulus impacts, noting stable year-over-year performance, partially aided by favorable foreign exchange rates.
From a technical analysis perspective, everything is lining up perfectly. Our limit order remains unchanged. The formation of an exact double top points to the possibility of a flat pattern, which typically leads to a double bottom. This anticipated double bottom would align with the volume profile’s range high, offering additional support to key Fibonacci levels.
Our stop-loss placement is secure, positioned below the support zone and the Point of Control (POC). We’ve set a time horizon for the wave ((ii)) to complete, and we believe this setup could result in a promising swing long position heading into Q1 or Q2 of 2025. If the chart develops as we hope, there may even be an opportunity to open a short position to hedge our long exposure. Until then, we’re prepared for another potential 12% drop, waiting patiently to execute our plan.

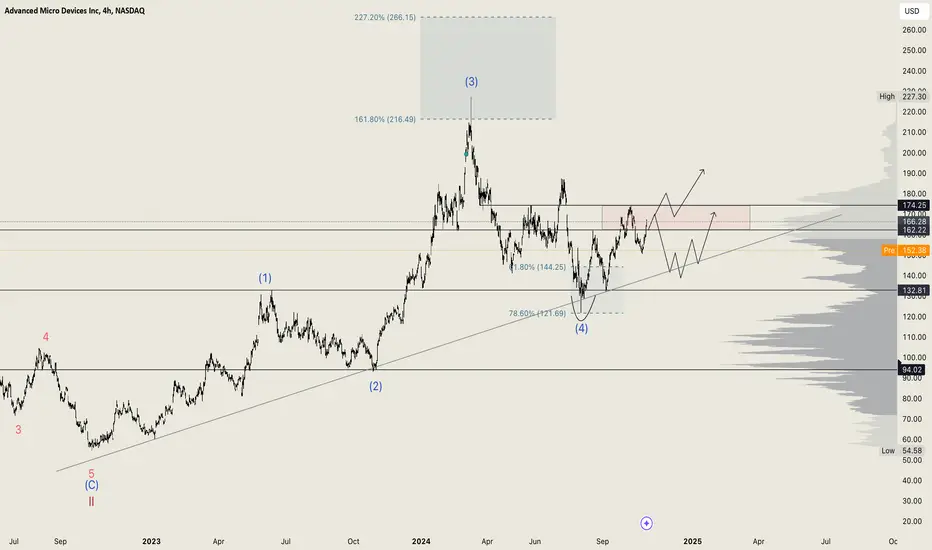
AMD (AMD): Trendline test coming - crucial for bullish case!Following the completion of wave 3, NASDAQ:AMD has also completed wave 4 with a near-perfect correction at the 78.6% Fibonacci retracement level. The rapid V-shaped recovery after the drop validates our count and points to continued bullish momentum as long as key support levels hold.
AMD’s earnings report on Tuesday aligned with forecasts but projected slightly weaker revenue than expected for the upcoming quarter. This led to a 6% decline in after-hours trading, raising concerns about potential deceleration in AMD’s overall business, even as the company remains a key player in the AI chip sector alongside its competitor, Nvidia.
From a technical perspective, NASDAQ:AMD now faces a crucial test. The stock must break through the resistance zone between $162 and $174 to confirm further upside potential. Failing to do so could result in a pullback to the trendline, a level that has been respected several times since early 2023. As long as the stock remains above the $120 level, we maintain our bullish outlook. However, losing this level would confirm a bearish trend shift.
We expect continued volatility, particularly post-earnings, and will monitor for a potential move higher or consolidation around these resistance levels. We are optimistic about AMD’s prospects but await further developments at this critical juncture.
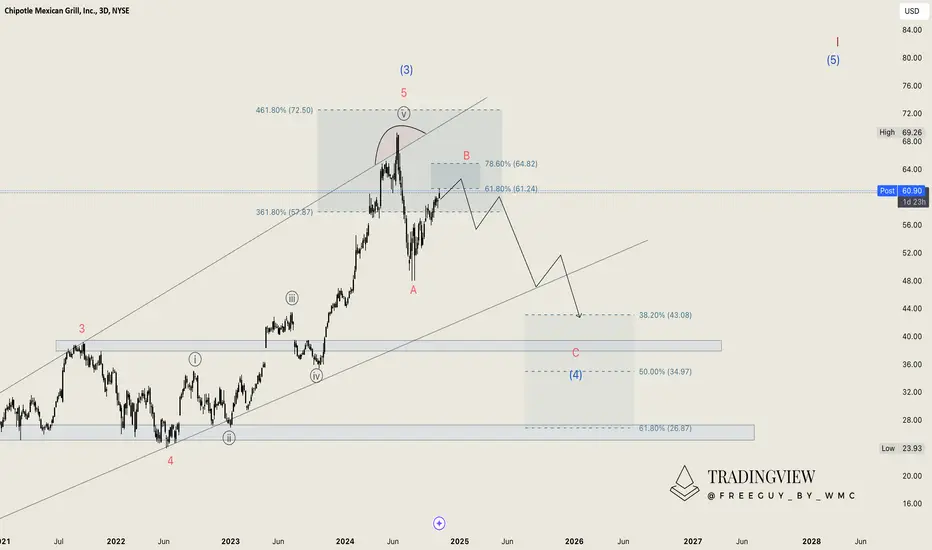
Chipotle (CMG): Awaiting strong correction in bearish waveAfter the recent 50-1 stock split, we revisited Chipotle's chart, refining our analysis for a clearer picture. With the adjusted setup, we’re more confident in our outlook for a potential bearish correction. Our initial turn-around zone was spot-on when factoring in the split, and we remain committed to our analysis.
Today, NYSE:CMG reached the targeted Wave B area at the 61.8%-78.6% Fibonacci level. Immediate reactions are often rare, but we believe a reversal could materialize soon. We’re eyeing the range between $43-$26, near the trendline, as a potential target zone for the next phase in this corrective wave pattern.
In the second quarter, Chipotle posted an 18.2% year-over-year revenue growth, boosted by an 11.1% rise in comparable restaurant sales and over 8% transaction growth. The earnings report tomorrow will likely attract more investor attention, but our approach focuses on technical entries at key levels rather than earnings reactions.
We have alerts set and are prepared to buy when the scenario aligns. Until then, patience and disciplined timing will guide our approach.
Ford (F): Eyeing Earnings for Potential Resistance FlipFord is set to release its earnings report in a few hours, and analysts generally anticipate that results will meet or slightly exceed consensus expectations. Currently, Ford is trading around a significant resistance level, and a breakout above this level could mark an important shift, opening the door for further gains. Our outlook remains bullish, with expectations that Ford will fill the large gap visible on the chart in the coming months.
Recent analyst targets align with our view, with ratings from Barclays, Goldman Sachs, and Morgan Stanley averaging around $13 for Ford stock. This target range corresponds well with our technical analysis, reinforcing our approach to Ford.
However, we’re holding off on any immediate action until after the earnings report to avoid an unpredictable reaction. We’ll be monitoring the market’s response closely, avoiding impulsive moves, as the true direction often becomes clearer after the initial post-earnings volatility.
Until then, patience remains crucial—trade the plan, stay disciplined, and seize the opportunity when it aligns with our setup.

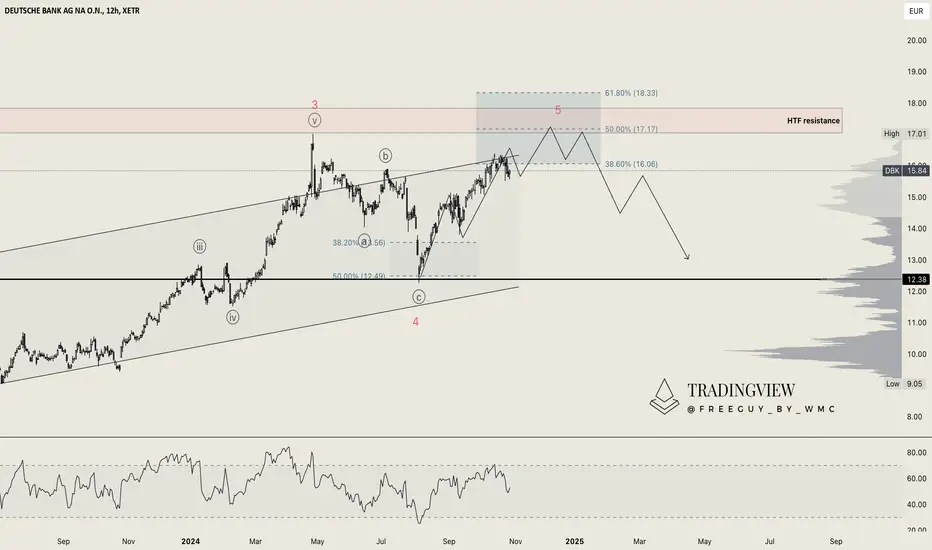
Deutsche Bank (DBK): Earnings beat but loan losses double We missed the optimal entry for Deutsche Bank (DBK), but the analysis was accurate overall. The earnings report showed some resilience with a revenue increase of 5.2% year-over-year, reaching €7.50 billion, slightly above analyst expectations of €7.30 billion. The stock reacted with a modest dip, but nothing significant. However, Deutsche Bank reported a notable rise in loan losses, which doubled to €494 million in Q3 2024 compared to €245 million a year ago, aligning closely with the €482 million forecasted by analysts.
From a technical standpoint, our primary count still appears valid, though it’s a bit on the lower side. This could indicate that wave 3 might not be the longest wave in this count, which is atypical but possible as long as it’s not the shortest.
We’re targeting a potential endpoint for wave 5 within the HTF resistance zone, aligning with the 50-61.8% Fibonacci extension level, where we could look for a long position if the setup confirms. We will continue to monitor DBK closely as this potential target level nears and adjust accordingly.
Gold's next probable direction & a safe zone for a Buy entry
I am also starting to see some downturn in Gold and Silver prices, mostly from momentum indicators which simply can't sustain the bullish momentum session after session.
But I don't think its a big correction, only 4% down from the current Gold price, this is a Fib level of support for price but this Fib level also coincides (ties-in) with recent market structure support.
Down below I will give some details of a Gold short I took today in Asia Friday and about 1 hour ago. Interestingly, the Gold price started to slightly sell off Lol, as if I am the only Gold-trader today in the Asia region.

Silver (XAGUSD): Anticipating a correction after new local highsTwo out of our three Silver positions remain active, with Silver reaching a remarkable high near $35. Today, we decided to fully close our second position, locking in substantial gains. The first position, initiated at $26.30, will remain open with a stop loss placed slightly below $26, aligning with the high-timeframe support and wave 1 level.
Given current analysis, a correction in Silver may be on the horizon after reaching the minimum target for wave 3. With increased Treasury yields and some profit-taking, Silver could face resistance in climbing further, especially considering the upward trend in yields.
While we cannot predict the exact speed of this potential downturn, if it unfolds as expected, we’ll look to re-enter with Silver certificates around the $30 to $28.30 range. The ideal correction would see a pullback toward the volume range high and a subsequent bounce within the 61.8%-78.6% Fibonacci zone, which we’ll confirm once wave ((a)) is established. Stay patient and focused, as volatility is expected to rise with the upcoming presidential elections.

GBPJPY Is Nearing Strong Resistance ZoneGBPJPY has been in a strong bullish phase, but five-wave bullish cycle within wave (5) up from 2022 swing lows can be completed after recent strong reversal down back below channel support lines. In fact, drop from the high is impulsive on a smaller time frame, so it’s wave A that stabilized near 178 support area as expected. As such, current rise is corrective, ideally B wave that can be still in progress as a bigger correction before a continuation lower for wave C. Ideal resistance is at that channel line, from the outside, around 198 – 200 area.
GBPJPY is looking for a higher resistance within wave C of (B) in the 4-hour chart, as it can be now breaking out of subwave »iv« triangle into subwave »v« of C, so keep an eye on next strong 198 – 200 resistance zone, from where bears for a higher degree wave (C) may show up.

Just in caseI'm accumulating this, I feel a hard corrections is coming. If it drops I'll buy more. I need some hedge on my portfolio.

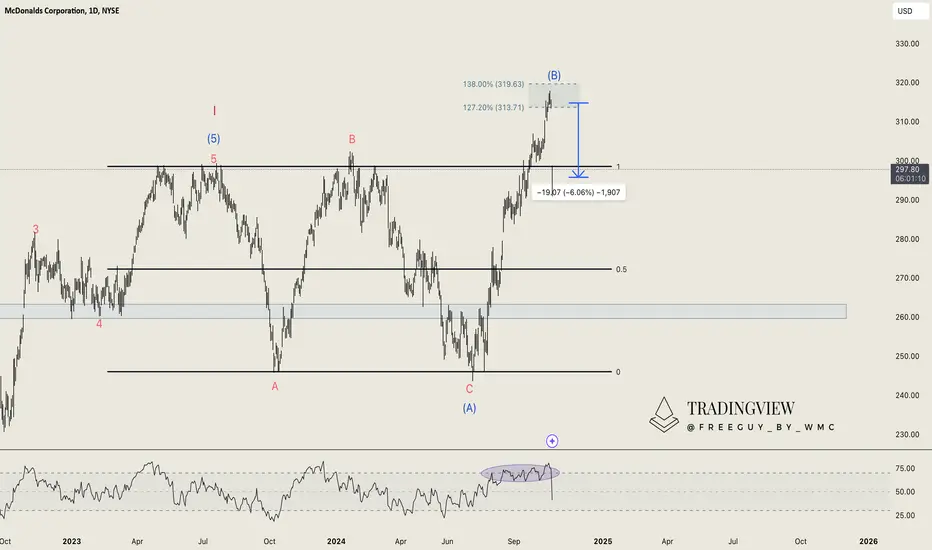
McDonald's (MCD): New setback after quarter pounder incidentOne month ago, we predicted McDonald’s would push into the 127.2%-138% range at max, and now the stock is reacting precisely as we expected. Pre-market trading shows a 6% drop following the news from Tuesday.
The Centers for Disease Control and Prevention (CDC) has reported one fatality and ten hospitalizations linked to McDonald's Quarter Pounder burgers, resulting in the fast-food chain pulling the item from several menus. This incident has brought McDonald's stock back into its previous range, signaling that this wave (B) should mark the local top for now.
If we are correct, we expect to see a 5-wave structure downward from here. While there could be a brief relief pump, we anticipate the stock falling below the wave (A) level of $243. We are patiently monitoring the situation, and if a favorable short setup presents itself, we will share the entry details. For now, we are watching how the news unfolds and waiting on the sidelines.
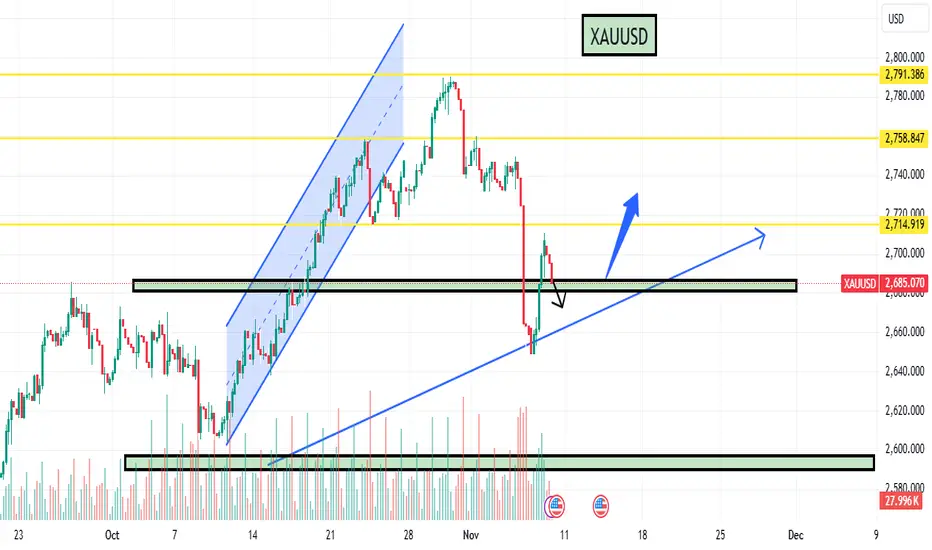
Approaching Key Levels with Potential Deep Correction Ahead!OANDA:XAUUSD
Current Price: 2737.445
2H Chart
Reason for Correction:
1H - Monthly: Overbought Zone (Deeper Correction Possible)
As indicated on the chart, the price is in an uptrend within an ascending channel on the Daily chart, and a similar trend is observed on the 2H chart, where an additional ascending channel is also forming.
Moreover, Gold is currently in the overbought zone across multiple timeframes, from 1H to the Monthly chart.
Before a potential correction, the price may rise to the overbought zone at 2753.906 or even the extreme overbought zone at 2773.699. However, it is not necessary for the price to reach these levels, as a correction could begin sooner.
A potential correction could target 2700, a significant psychological level, and extend further to 2685. It’s also possible for a deeper correction to occur, which will be addressed in a subsequent analysis.
Key Levels:
• 2753.90
• 2773.70
• 2700.00
• 2685.44
Happy trading!

Potential Correction in XAU/USD After Recent Bull RunThe price of XAU/USD has experienced a significant upward rally from $2,605 on October 10, 2024, to $2,741 as of October 21, 2024. This impressive bull run has been largely driven by market euphoria surrounding expectations of interest rate cuts. Investors have flocked to safe-haven assets like gold in anticipation of a looser monetary policy, boosting its appeal and driving prices higher.
However, despite the ongoing bullish sentiment, there are signs that a potential correction may be on the horizon. When analyzing the recent movement using the Fibonacci retracement tool, the golden ratio (61.8%) suggests a key level of potential support around $2,695. This level could act as a corrective target for profit-taking or a temporary pullback before the next leg higher. A retreat to $2,695 would align with the natural ebb and flow of price action after an extended bullish phase, providing an opportunity for the market to consolidate gains before resuming its upward trend.
In the 15-minute chart, XAU/USD is currently forming a bearish rising wedge pattern, a technical signal often associated with potential downward movement. This formation indicates that the recent bullish momentum may be losing steam, suggesting a reversal could be imminent. The narrowing price range within the wedge hints at weakening buying pressure, setting the stage for a possible breakdown.
Given the recent extended rally, traders may begin to take profits in the near term, especially as the upward momentum in XAU/USD shows signs of exhaustion. This could lead to increased selling pressure, amplifying the likelihood of a short-term correction.
If the price breaks below the lower boundary of the wedge, it would confirm the bearish signal, increasing the chances of a move towards key support levels, such as the previously mentioned $2,695 level. Traders looking to capitalize on this setup should closely monitor the price action for a clear breakdown, as it could offer strategic entry points for short positions or profit-taking opportunities for long traders.
Traders and investors should keep a close eye on this level, as a confirmed correction could present buying opportunities for those seeking to enter the market at a lower price. Conversely, if the price holds above key support levels, the bull run could continue, especially if macroeconomic factors such as additional rate cuts or geopolitical tensions further fuel gold's allure.
In conclusion, while the recent rally has been impressive, prudence suggests being prepared for a potential correction, especially with $2,695 emerging as a key technical level to watch.

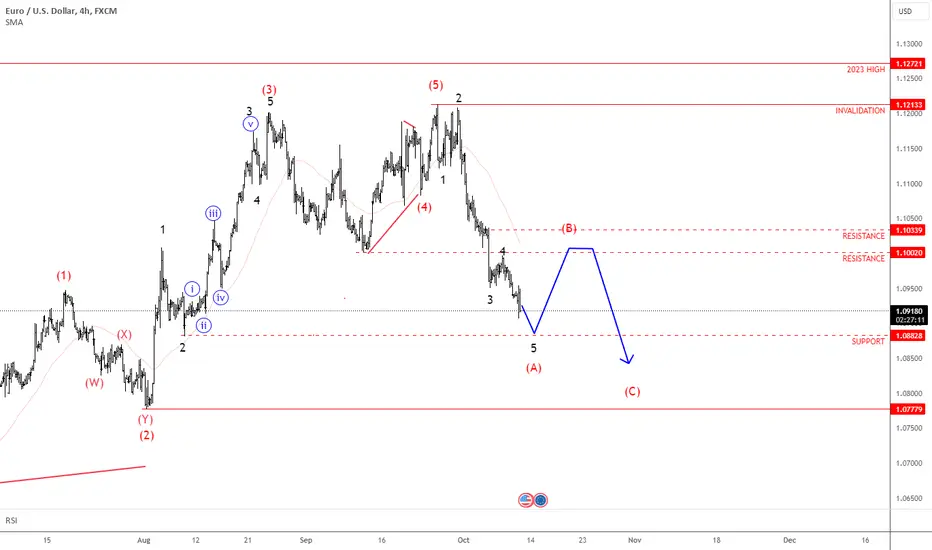
EURUSD: Sell RalliesThe dollar has been in a strong recovery for the past two weeks, ever since the Fed decided to cut rates by 50 basis points in mid-September. This appears to be a classic “buy the rumor, sell the news” situation, as much of the dollar weakness earlier this year was driven by speculation that the Fed would cut rates. Now that they've finally done it, we’re seeing the opposite reaction.
Focusing on the EUR/USD pair, we can see a very clear and strong push to the downside, forming an impulsive pattern from the 1.12 level. In Elliott Wave terms, this structure indicates the trend direction, which on the intraday timeframes is currently down. I would expect more weakness ahead, although markets never move in a straight line, so an ABC pullback is possible. In such a case, 1.10 to 1.1040 could serve as a good resistance zone to sell into.
It's also important to note that the ECB may be leaning towards more rate cuts, especially with Germany’s economic struggles. This could further pressure the euro, particularly if the Fed slows down its dovish actions, given that US inflation didn’t drop to the expected 2.3%, but instead came in at 2.4%. With US yields poised to move higher while the ECB remains dovish, I believe EUR/USD will stay under pressure.