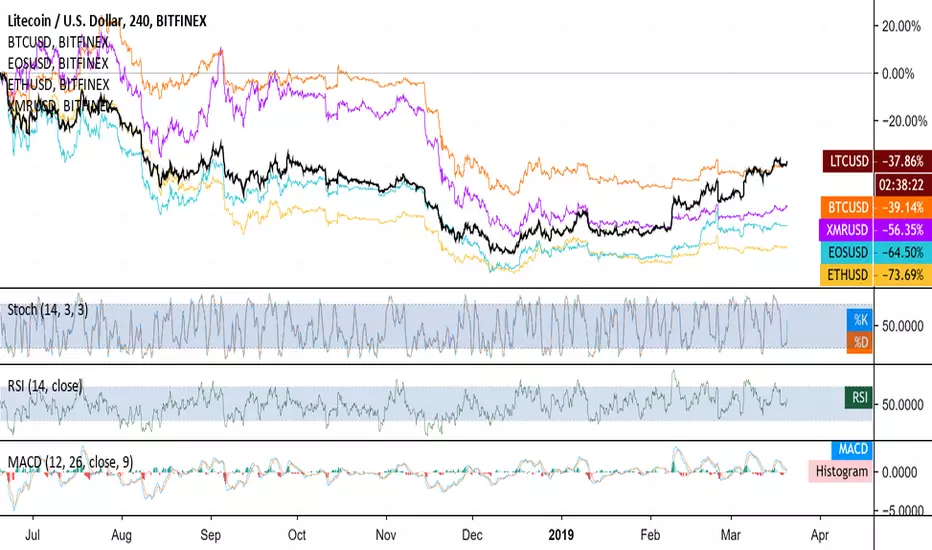
This is what I mean when I say Litecoin OutperformsHere we have Litecoin in black against a bevy of other cryptos including Bitcoin, EOS, Monero, and Ethereum. As can be seen, it wasn't doing great compared to its peers before the September and November 2018 setbacks, but since then has outperformed all o its peers.
Keep in mind though, these cryptos, nearly all relatively liquid cryptos really, are cointegrated. Don't confuse this with correlation. Correlation can tell us that when one asset or variable moves in one direction and another moves in that same direction, that the two are positively correlated with one another and if they move in opposite directions that they are negatively correlated. But these cryptos are doing that arn't they? Yes they are, but they are also deviating from one another more and more as time goes on. This is cointegration and it can tell us which is not if they are moving in the same direction, but that the degree to which the variables (cryptos, currencies, or other assets) are sensitive to the same average price over a period of time.
So what on earth is the relevance of this you may ask. The point is that something, we don't really know what, is impacting all of these currencies at the same time as they are all positively correlated against the US dollar and they are also cointegrating meaning. What is that hidden variable? It could just be Bitcoin as it has been arguably the 'market leader' as the main crypto most known and traded. Just take a look at this link and scroll down to the crypto correlation chart of 2018: cryptocurrencyhub.io Every crypto pair was highly positively correlated with one another in 2018, almost all of which were between 90 and 100 percent. That is actually quite unheard of in financial markets where an entire asset class is related to one another. Surely we can find correlations and cointegrations in other places in the market such as bond yields. In the US or Germany or Brazil, the 1 year, 2 year, 5 year, and 10 year bonds are all positively correlated with one another another and cointegrated with one another as well. Except, the difference is that it only holds for a single country. Sure, maybe a few countries are more closely related to one another than others, but not the entire market.
So what are the takeaways then? First, a 'diversified portfolio' of cryptos is not diversified at all. All it will do is let you know which ones are the winners and which ones are the losers which we already know from the chart starting right at you above. Then what do you want to do? Look if you're an investor, like a real investor not a crypto bro, then yeah sure maybe have a high performing crypto in your portfolio. That crypto in 2019 is Litecoin. Period end of sentence. Yes maybe this could change, but right now its Litecoin. Nothing else to say beyond this. If this changes, I will be the first one to scream it from the mountain top, but really nothing can be said to convince me that a portfolio with fifteen cryptos is any smarter than one with just the good ones.
Please please please tell me if there is another crypto out there performing much better than Litecoin and I would be more than happy to give it a look, change my worldview, and incorporate it into my analysis. I challenge you to do so. Good luck trading out there.
Also if you are enjoying my honest analysis the way I see it, please take a look at my other content at www.anthonylaurence.wordpress.com
Correlation
Potential Drop for NZDCADThis trade is based on the 6 term trend pattern of correlation with both CAD and NZD and JPY. There is strong resistance at the 9200 level, hence the stop loss. However, I believe that based on 5 day,1 month, 3, month, 6 months, that NZD is overpriced in comparison to CAD in JPY terms.

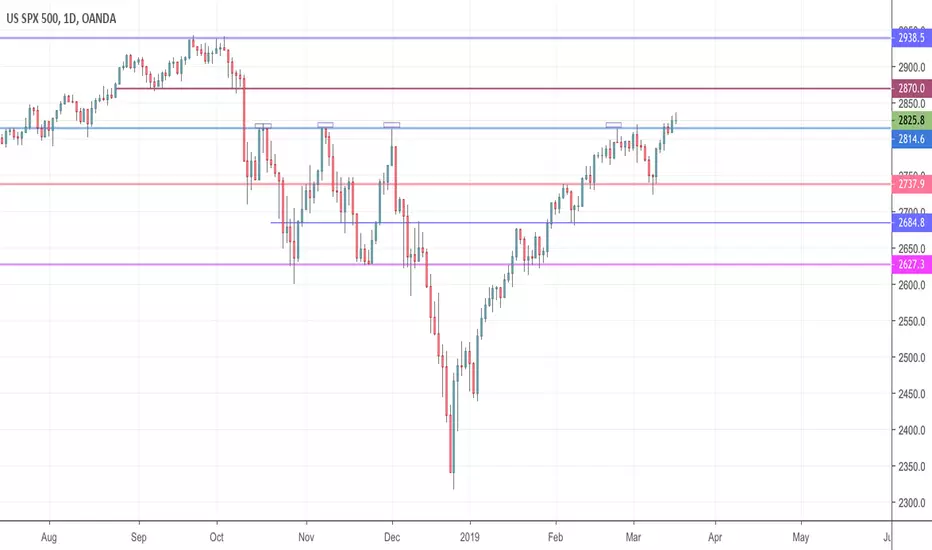
SPX500USD D1Price has closed above the strong resistance level that has held multiple times in the past. Will be watching for more upside & "risk on" theme in the forex market.
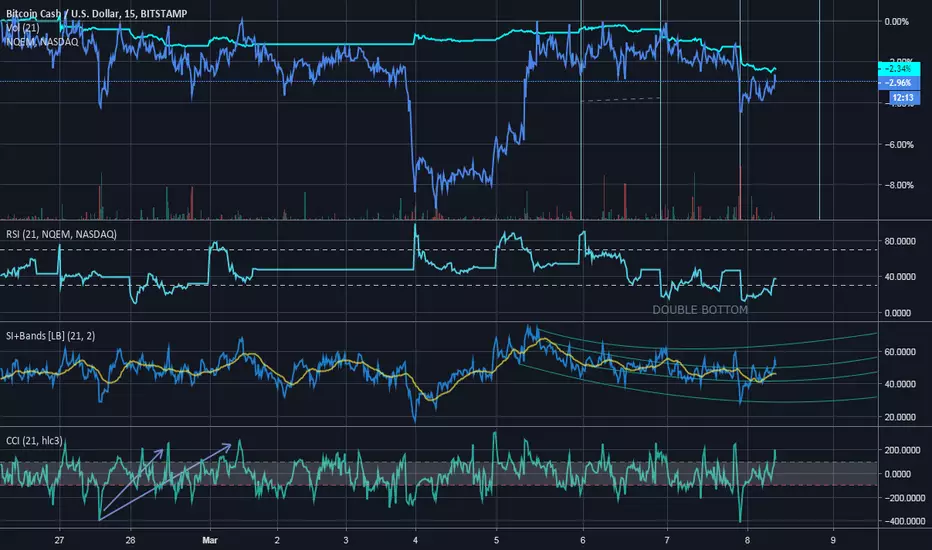
Enjoy the Nice ReboundLast time we saw a CCI this low, it resulted in a double top. Same could happen here, ladies and gentlemen. To reinforce this morning as a good one, we had a double bottom on the NQEM RSI-21 on the 15min timestep. Cryptocurrencies closely correlate with the emerging market indexes, so this is another good sign we can enjoy a bullish run this morning.
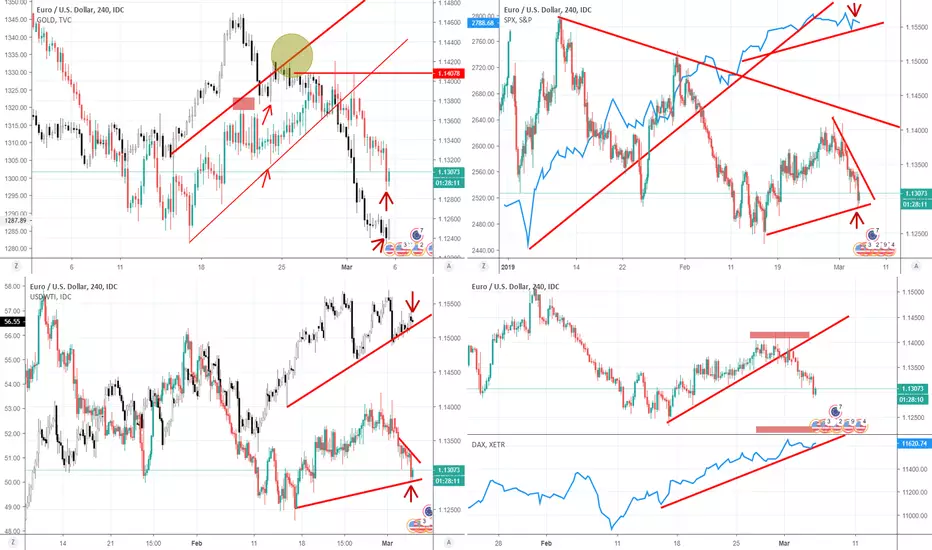
Correlation Trading EUR/USD/ DAX/ OIL/ GOLDHey guys,
after a time of inactivity I"m back.
Today I show you how you can trade EUR/USD with the help of correlations.
You can see in the chart positive correlations and negative correlations.
Be careful the arrows on the chart are no trend direction.
If for example Oil change its direction the trend direction is turned.
But be careful with long term-trends and short- therm trend.
Always be aware of your timeframe.
(4h is short therm trading)
Hope I could be informative for you guys
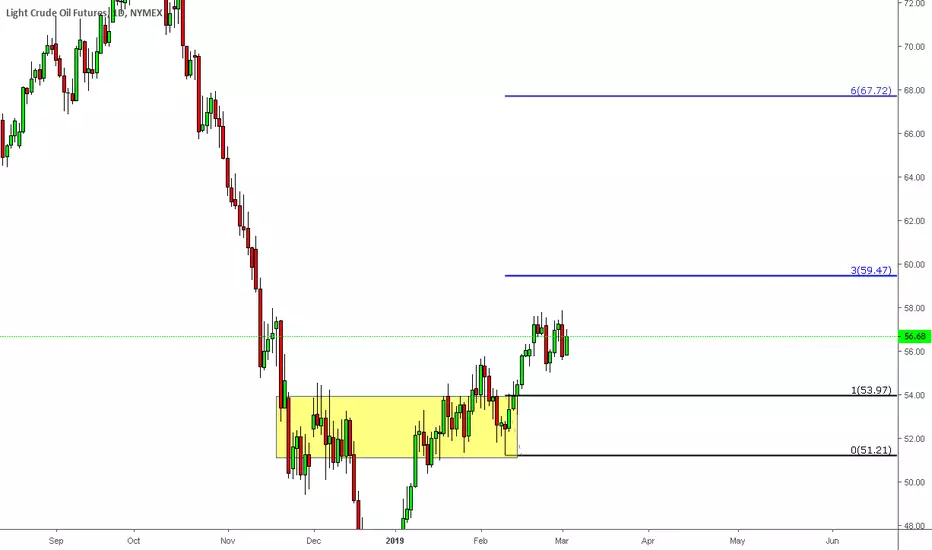
Crude Oil--LongWeekly Uptrend//Looking for pullback to 94.00 area.//Using Daily Chart for Forex correlated trades.//Daytrade futures on smaller timeframes...

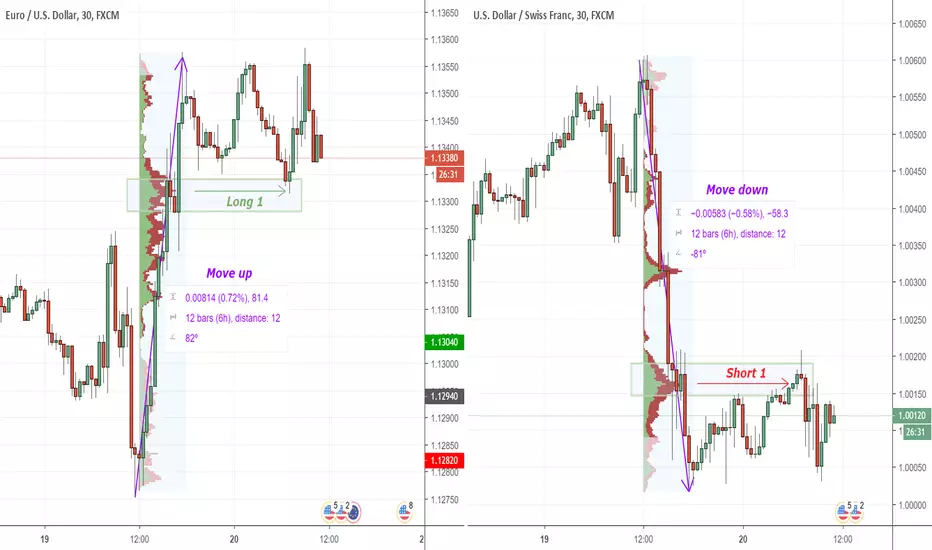
Correlation EURUSD VS. USDCHFHere is my two yestarday´s levels from my Members area. ( Both ended up in profit )
Let me explain my how correlation between EURUSD and USDCHF works and how you can look at the charts.
EURUSD and USDCHF are negatively correlated (correlation almost -100%). If USDCHF falls, then EURUSD should rise. If EURUSD rises, USDCHF should fall.
This means that in similar areas there will be similar levels for trade.
HOW THIS CAN HELP ME IN TRADING?
If you consider some price level for trade make sure that is visible on other pair too... If will be significant area for long on EURUSD, make sure that there is a significant area for short trade on USDCHF too!
If there is, then you will be more likely to have a successful trade.
Happy trading
Dale
Correlation Coefficient + CCIPictured above is a graph of Royal Dutch Shell vs brent crude, the correlation coefficient between them, and the commodity channel index tracking the volume weighted moving average of Shell.
I tested this indicator on a few energy stocks: RDS, MRO, BP and XOM. Negative correlation between brent crude and an energy stock coupled with an overbought CCI seems to give an indication of price reversal. Here we see two overbought CCI readings coupled with negative correlation, both followed by massive drops in the price of BCO and RDS. Likewise we see negative correlation coupled with upward CCI readings pointing to massive price rises in RDS. Seems to work on daily time frame as well but indicator length will need to be tweaked accordingly.
Correlation coefficient going negative is an indication of pricing inefficiency and momentum potential, but does not give us an indication of price direction. The commodity channel index can give us a sense of where price momentum is pointed. Both put together give us a powerful indicator capable of foreshadowing both momentum and direction.

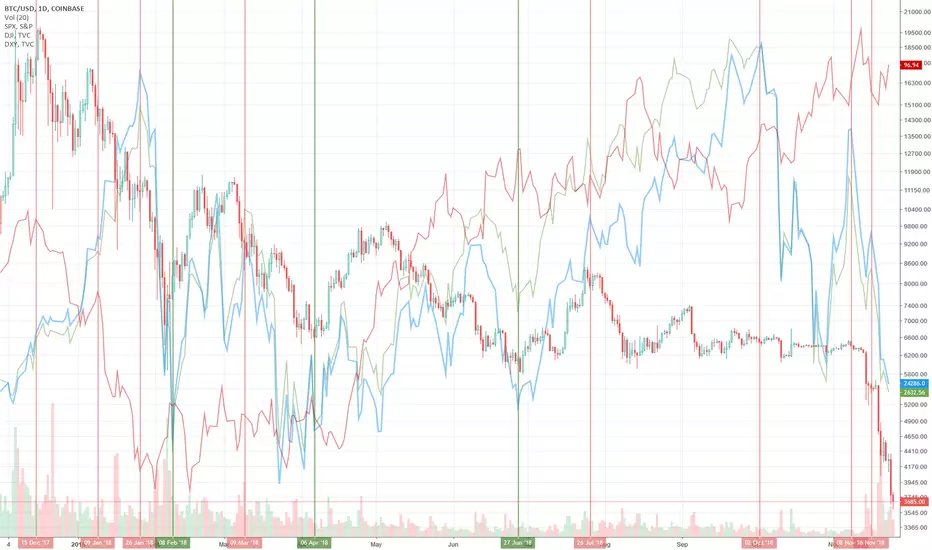
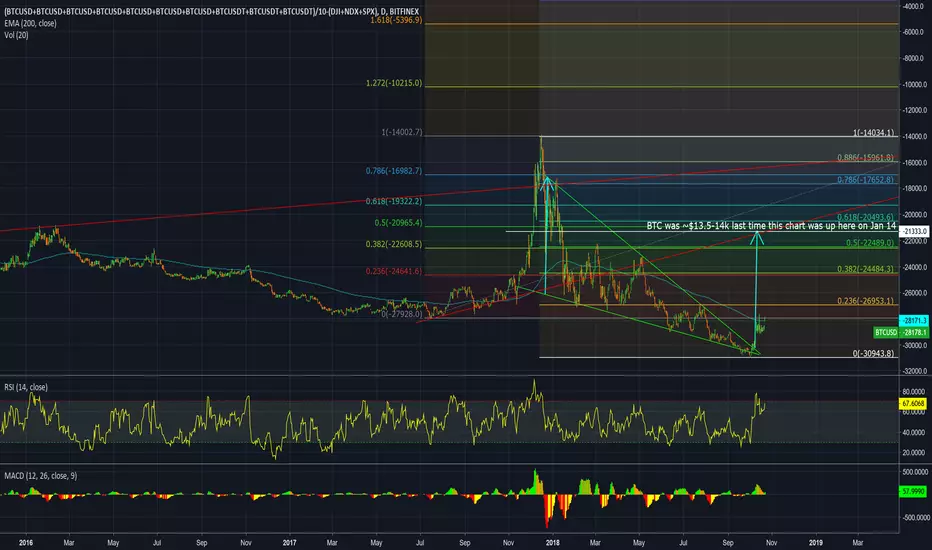
Average price of bitcoin against the American stock marketSince I'm lazy, here's what I said on twitter: "Due to the stock market opening lower than it closed yesterday, this chart that takes into account the average price of #bitcoin against the sum of $DJI $NDX and $SPX opened exactly at the 200 day moving average, rising as the day progresses... A $BTC target ~$13k based on this"
I've been noticing clear inverse correlation with the American stock market and bitcoin(along with the inverse correlation with DXY). After realizing it was possible to form charts out of formulas using other charts as variables, I decided it would be very interesting to weight the American stock market against the average price of bitcoin across the 10 most significant exchanges according to me.
Unfortunately for the no coiners, I've been anticipating a significant recession that adds fuel to the next bitcoin bull run(see related ideas).
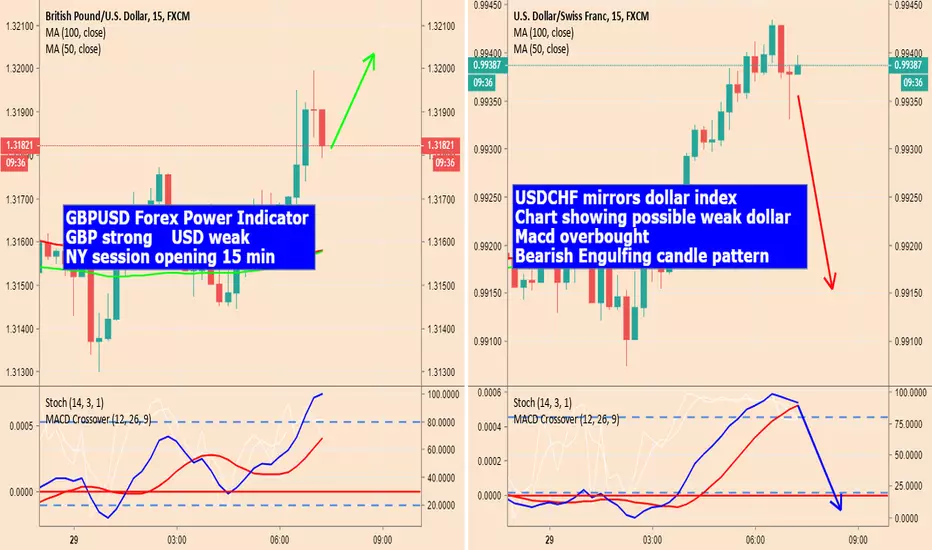
Forex Correlating PairsUSDCHF mirros USD Dollar Index
Chart shows weak dollar
Macd overbought
Bearish engulfing candle pattern
GBPUSD
Forex power indicator shows
Strong GBP Weak USD
NY session starts in 15 min
Possible bullish continuation move for GBPUSD
Stocks likely to continue rally Measured by US30, an index representing the 30 largest corporate enterprises of the United States of America, closed the week with the second largest green candle of the year 2019 while preceded by 2 minor red candles and another 8 larger green candles.
My guess is this rally will continue for another couple weeks. Also backed by UJ seasonality, all relevant markets seem to be in agreement for this to follow through.

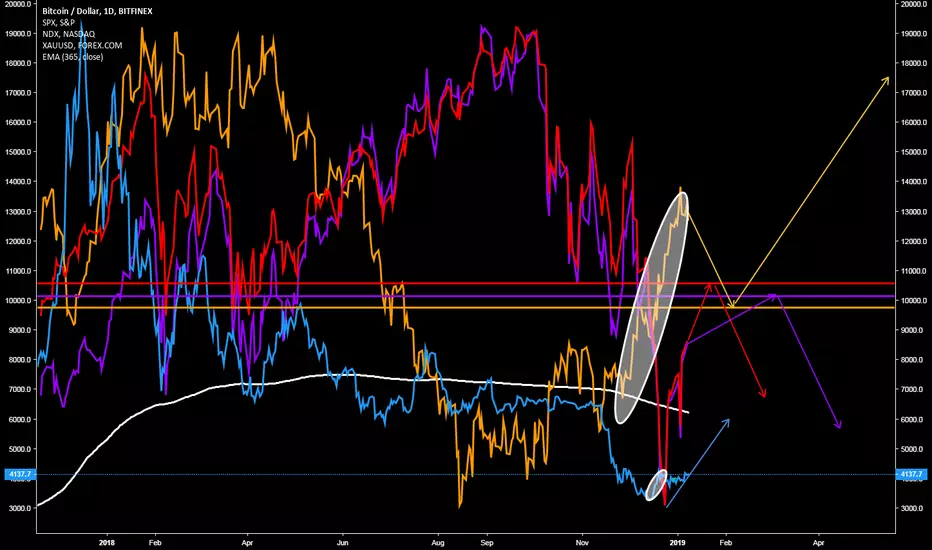
The playI have this idea of that the marked points(horizontal lines) will be the key areas for determining the upcoming trend of bitcoins price movement because the areas collide as in support meets resistance and resistance meets support between GOLD & the indexes S&P 500 and NASDAQ 100 whom naturally have an inverse relationship.
The reason for this thinking is because for a longer period of time i have paid attention to that when the indexes go up the market of cryptocurrency goes down and knowing that gold has a naturally inverse relationship as a form of hedge towards the traditional market i would assume identifying key points and finding a correlated area would be legitimate for making a speculative guess for the future price movement of the bitcoin.
This also means that because bitcoin moves all the other currencies in its sphere being the most dominant one all my other assumptions will revolve around either the break of the resistance for indices RED & PURPLE or the support of gold against the indices marked YELLOW
So if GOLD finds support i say there will be a reversal for bitcoins bear trend towards the bull sentiment and if Indices break the supply areas a continuation for bitcoins bear trend will emerge short to medium term.
However if any of these situations are to be played out i am biased to that GOLD will be favored in its area because of the recent news revolving around the financial markets and break of chart patterns.
Please do give me a like and or a follow as i will be updating these charts if you want to follow its development!
Bonds Being Bearish? Long Side potential Trade at Trend LineThe rate of Bonds is at a very interesting place as highlighted in the chart! In depth exploration in the video below:
youtu.be

Correlation between USDARS and USDCLPThe exotic crosses USDARS and USDCLP are moving with a positive correlation.

SPX500USD D1Price has been following a range for some time now, testing both the top & bottom of the range 3 times, closing on Friday with a bearish engulfing break below the range support. Will be watching for a retest of broken support as new resistance next to anticipate more downside to come. This will lead into a weaker AUD & NZD, & causing CHF & JPY to gain strength as these are "Safe haven" assets.

CNY, AUD and NZD correlations explained !The reasoning behind this very important set of correlations!

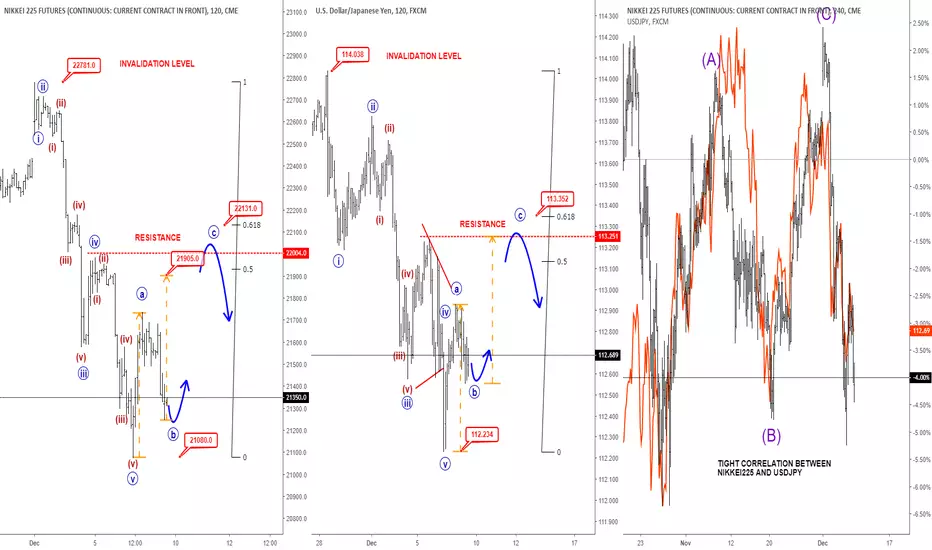
EW ANALYSIS: Risk-Off Sentiment Could Continue; NIKKEI+USDJPYHello traders!
Today we will talk about Risk-Off mode over NIKKEI225 and USDJPY, where we see a tight positive correlation!
As you can see, the main driver for the USDJPY sell-off was NIKKEI225, which may continue later this week, since we have seen an impulsive five-wave decline. In EW theory, after every five waves, a three-wave pullback follows and we can already see an a-b-c correction in progress, where wave »c« is still missing, so be aware of a Monday rally towards projected resistance areas, from where we may see another sell-off in the stock market and consequently also in the USDJPY!
That said, in the NIKKEI225 futures chart, we are tracking a three-wave a-b-c corection, where 22000 resistance area can be tested, before we may see a sell-off continuation! So, as long as it's trading below 22780 highs, we will remain bearish!
If we respect correlations, then it's similar with USDJPY, in which we think that 113 area, specifically 113.25 – 113.35 resistance area can be retested before another sell-off, so while it's trading beneath 114 region, we remain in the bearish mode!
Early Monday moves are usually fake, so if we get a Monday rally within projected wave »c«, then this would be a perfect three-wave corrective rise that can be easily covered in the next days, when we expect another sell-off!
Trade well!
Disclosure: Please be informed that information we provide is NOT a trading recommendation or investment advice. All of our work is for educational purposes only.
Correlations: US30/DE10/JP10 yr bonds with the S&P/DowThis was an experiment to find any relevant patterns or correlations between US Bonds/equities. Nasdaq was not included due to it's high %'s skewing the perspectives on the chart
Green vertical lines were "buy signals", and the red lines were sells. The result is that there definitely is some correlation here with the "oversold"/overbought" position on US 30yr bonds and US equities. What I'm seeing is more often than not it is an accurate indicator for a trend reversal, and also that it is not time for a buy "long term" yet. That signal comes (more often than not) when the 30 yr bond price is overbought on a weekly timeframe.
I'm expecting an equities bounce in the next few days, but I'll be setting my long term buy targets lower. S&P around 2200-2300 wouldn't surprise me before the end of 2019

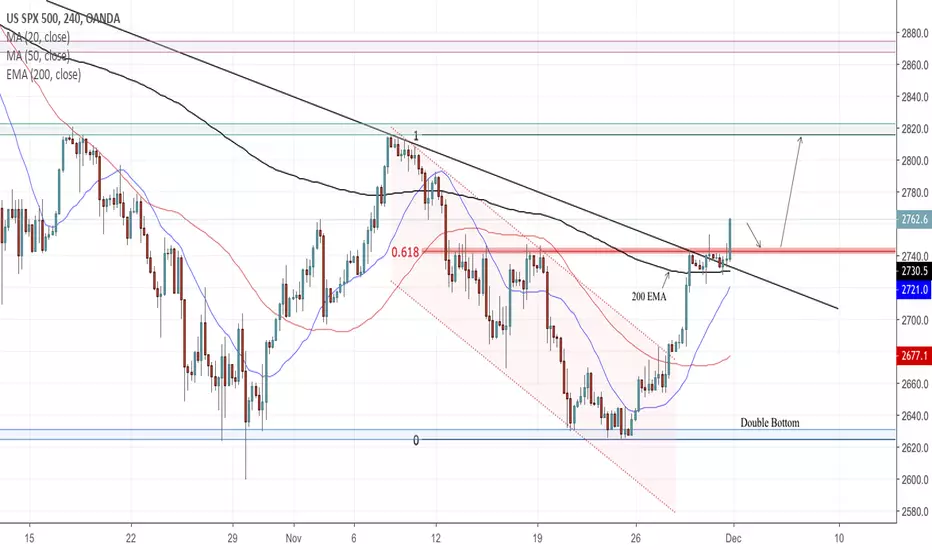
SPX500USD (H4)After price formed a double bottom at key level support, a strong bullish impulse took place breaking all barriers of the downtrend structure. Price closed this Friday with a bullish engulfing candlestick breaking above resistance along with the major descending trendline. Will be anticipating a slight pullback to retest broken resistance (61.8 fib) as new support for a further push to the upside.
This pair is important to watch as it has a strong correlation to the forex market. When price pushes up, AUD & NZD gain strength. When price moves lower on the SPX, this causes fear in the market & people move their money to safe haven assets like the CHF & JPY.
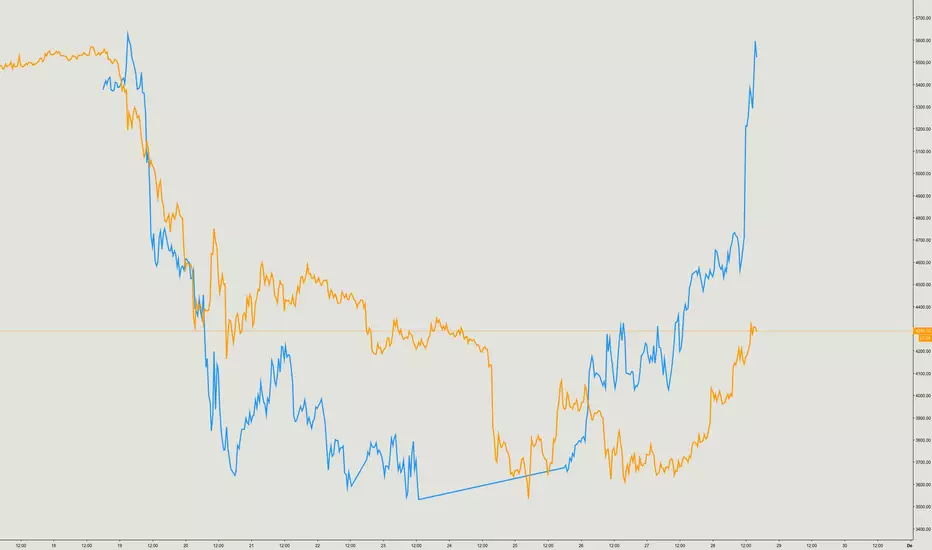
BTC pumps with the markets!!While most say that BTC and the stock market have no connection at all, we have been shown over and over that there is something interesting there.
We can see on this chart that both the strong downturn lower in both markets mirrored each other and today's rally in stocks was yet again mirrored in crypto markets.
Whether basing trades off of the movements of one on the other isn't recommended, the correlation is there and it is something to keep an eye on.
Cheers!
Bitcoin vs Stock Market CorrelationHere's Bitcoin compared to Stock Markets.
As you can see, almost every major drop of DJI/S&P500 has caused a sell-off in Bitcoin, while it stays flat most of the time as stocks go up. Right now Bitcoin is falling in sync with the stock market.
In the beginning of the year every major move down of DXY has lead to a down trend in Bitcoin, now it has more of a reverse correlation.