Correlation

SPX and sectors correlations 10 day PeriodSPX and sectors correlations 10 day Period, Advance Decline ratio (ADL) and ADL correlation 10 day Period
Sector Correlations
XLY Consumer Discretionary
XLP Consumer Staples
XLE Energy
XLF Financials
XLV Health Care
XLI Industrials
XLB Materials
XLK Information Technology
XLU Utilities

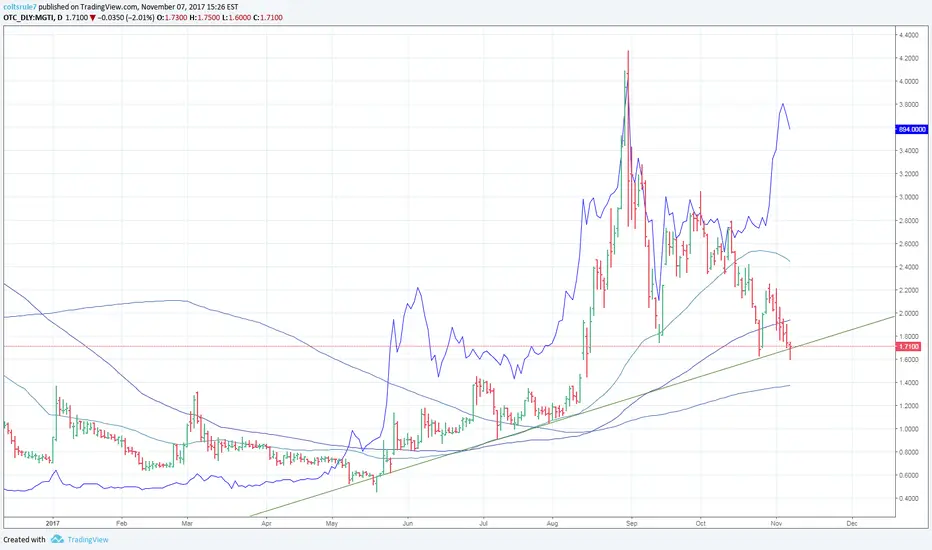
MGTI's Correlation with GBTC is Uncanny!Shares of MGTI have strongly corrilated with shares of GBTC and now the shares of MGTI are selling off into earnings while GBTC has rallied. A sharp pop in shares of MGTI is very possible due to the action of GBTC as off late. MGTI has also ramped up their bitcoin mining opperations buying 2000 more Antminer S9 miners. With these new miners alone MGTI will be able to generate 22 Million annually pre tax. I would consider MGTI a STRONG BUY right now.
Full discloser I am a shareholder of MGTI. I am not a shareholder of GBTC.
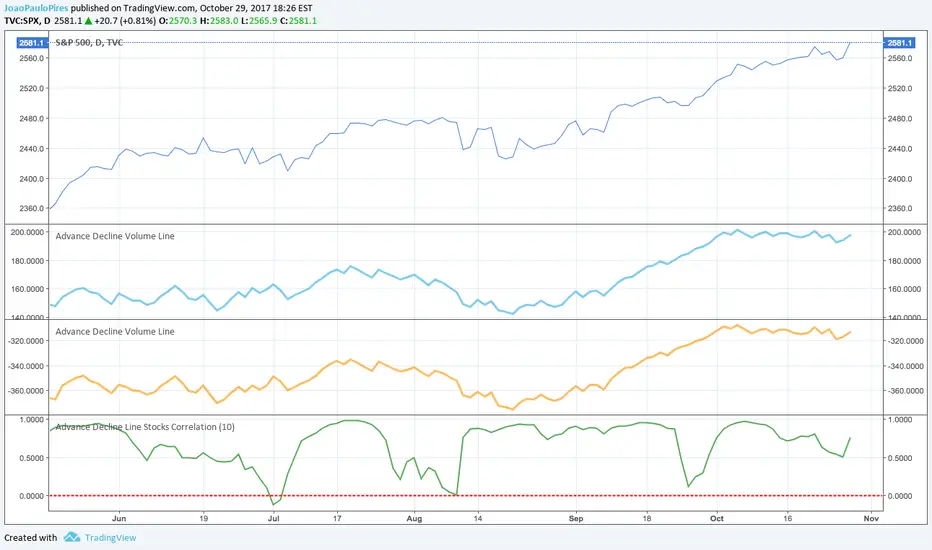
Advance Decline Line and Advance Decline Volume Line...Analysis of SPX and ADL and ADVL, and also positive and negative correlation in 10 days period. Important to notice that in the situation when ADL up and SPX down, doesn't anticipate a drop in SPX in the correlation indicator above. Only when SPX up and ADL down that usually does but is not guarantee also.
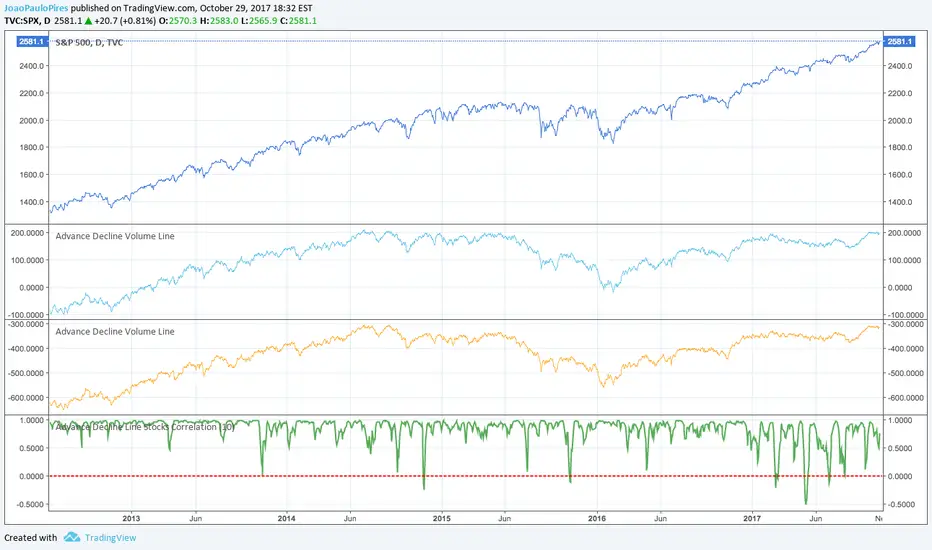
Advance Decline Line and Advance Decline Volume Line...Analysis of SPX and ADL and ADVL, and also positive and negative correlation in 10 days period. Important to notice that in the situation when ADL up and SPX down, doesn't anticipate a drop in SPX in the correlation indicator above. Only when SPX up and ADL down that usually does but is not guarantee also.
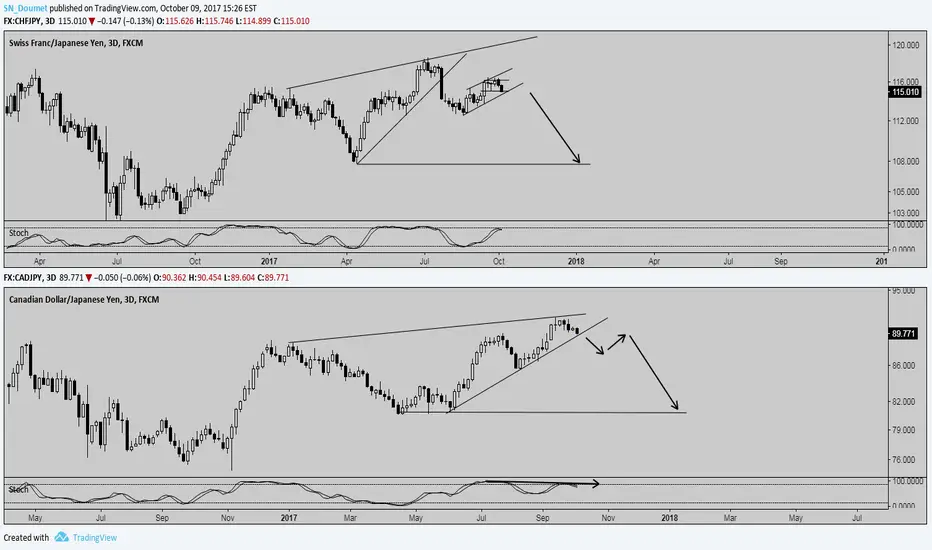
CHF/JPY - CAD/JPY -> QUITE REMARKABLE SIMILARITIES No need to explain the charts themselves pretty much sum up the title of this post. The only thing I can say is that I'm definitely looking towards the downside on both of these 2.
Trade safe and implement your own due diligence before entering a trade.
EUR–XAU–USD Correlation…. Economic and non-economic risksI compared the correlation between Euro_ Gold_ and Dollar_ on a combined chart, and tried to figure out the periods when Euro_ and Gold_ reacted inversely to DXY_ trend.
I distinguish the two factors effecting gold_prices: USD_weakness, risk appetite.
Focusing on the non-economic risks, I recall these critical events since November.2016.
- US election risk release and Trump rally
- Netherlands and France elections
- Brexit uncertainty (effective until T.May triggered Article 50)
- Comey’s testimony effect on Trump administration
- North Korean tension (excessive reaction in gold_prices)
Except US elections (after which USD_ smashed all its rivals), maybe we can say that the gold_markets bought the other risks listed and sold them back, which broke the Euro_Gold Correlation.
During other times, correlation seems quite normal, where USD weakness or strength has driven the prices of Gold_and_Euro_ in parallel.
At the final point as of now:
Gold_prices still ranging within 1250-1300, but Euro_ appreciated well compared to last quarter of 2016.
In economic terms, USD is weaker than before (FED less hawkish) and EUR is stronger supported by hawkish ECB (following long years of dovishness).
Taking all above as a deuce point, I plan to take long-term positions on (stronger USD/weaker EUR) basis, which I see more probable.

Market correlationRising commodity prices-CRB index (high inflation) are generally indicative of economic growth, which results in higher interest rates and lower bond price ( higher bond yield)

DXY Reversal PatternAfter a trend line break out , it could be noticed how the Dollar has been getting stronger through the days.
However, a retracement till 93.00 is not a bad idea , in order to start shaping an inverse head and shoulders, a reversal pattern.
-----
Constructive Critics are well received.
*I appreciate your feedback.
Thank you.

S&P and Gold correlationOk this one is interesting. Let's check out the divergence between the equity market and gold.
No statistical arbitrage opportunity on this one, but this seems to indicate to me that once the correlation between the two starts to get closer to equilibrium, gold will already be rising and equities should begin a descent down, although likely not for long.
The real opportunity here is the gold long.
Math is always going to win. Numbers don't lie.


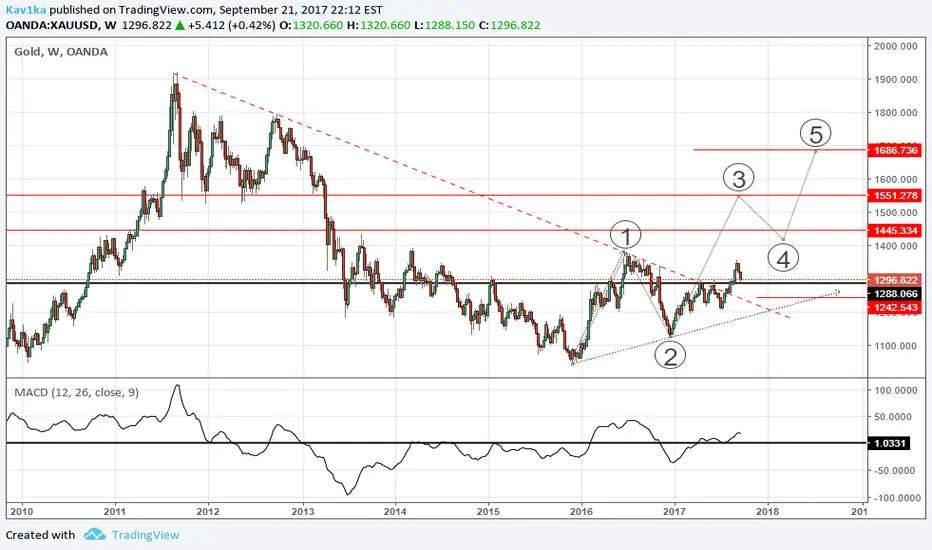
Trump is Good For Gold!Or let's say bad for USD. History repeats itself with Republicans in office :D Good time to buy gold? As long as support holds at 1280 level, we could see another rally to 1400. Which means USD heading lower to the 80s.
Projection "for all" the crypto marketIf things happen like in the drawing, then we know we have strong market!

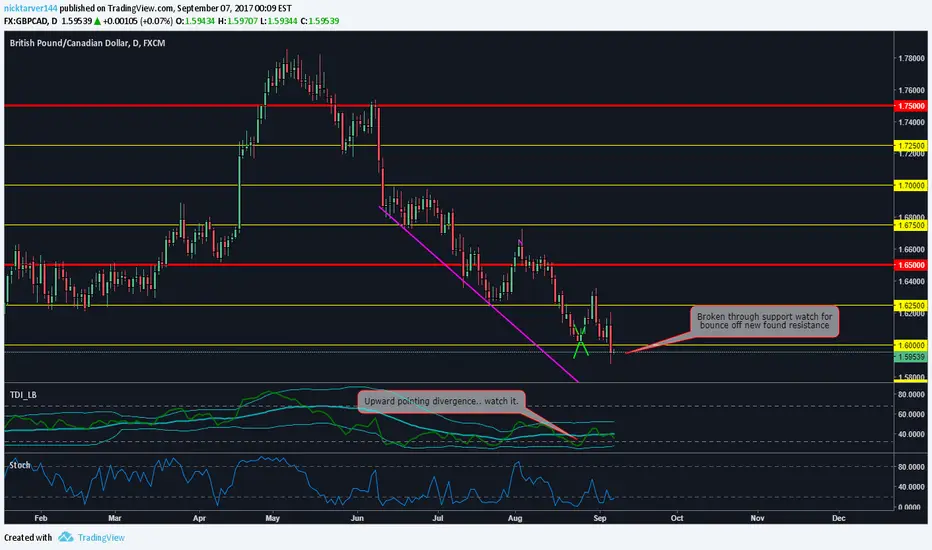
GBPCAD UnclearDirection is unknown at the moment. price has opened JUST underneath a resistance line and could possibly bounce off and continue downwards. Although if my ideas about EURGBP are correct then GBP will be gaining strength to go long. Upward divergence also gives the idea of a shoot UPWARDS. Bands on TDI are also low. Watch closely.
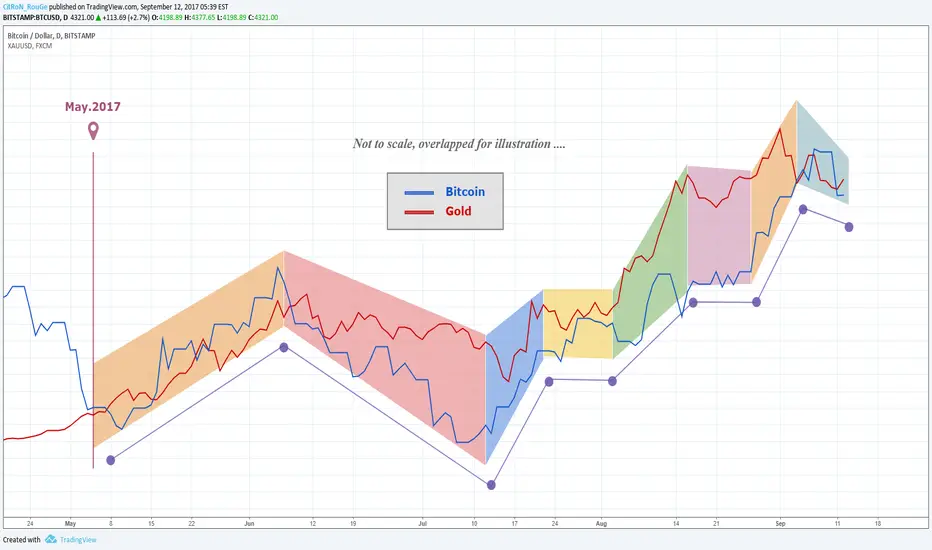
Bitcoin and gold getting into correlation recently ???Since May.2017, I noticed that the prices of bitcoin and gold are acting under a correlation, although not like the correlation between silver and gold.
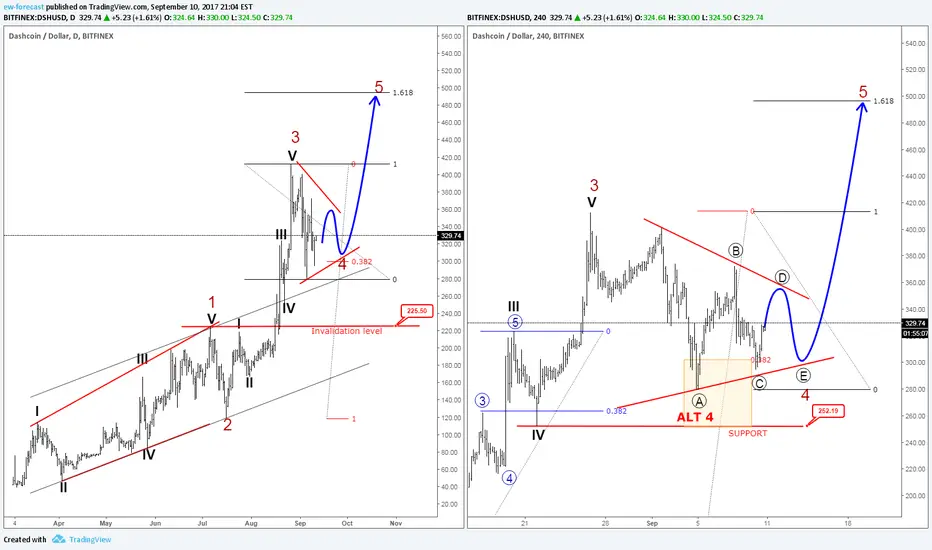
Dash In An Ideal Triangle CorrectionDash trapped in wave 4 triangle like BitCoin and LiteCoin. We assume that Cryptocurrencies are in positive correlation, so we have to track this triangles. Triangles are typical for wave 4, so we are expecting new highs in next days/weeks and @500 psychological level can be seen.
ew-forecast.com <- Visit for more Cryptocurrencies FREE Analysis!!

Crypto correlation nowThe main traded cryptos are now correlated. What that means? Think about it! ;)

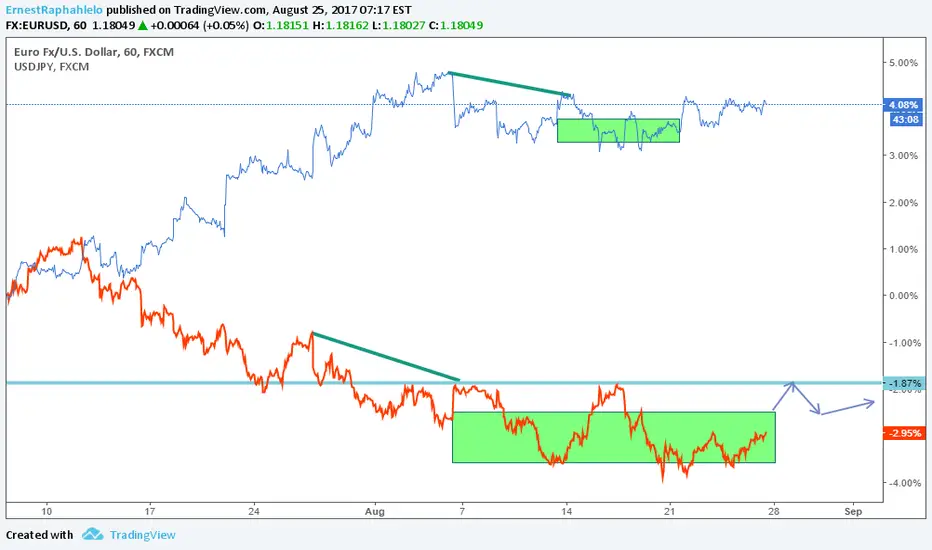
correlation between EURUSD AND USDJPYI GUESS USDJPY WILL FOLLOW THE SAME PLAYBOOK USED IN EURUSD LOL
Correlation study on gold prices and US10Y bond yieldsTaking 1st of January 2015 as the starting point, I overlapped gold prices and US10Y bond yields to review the correlation between these. The scales are by percentages taking 2015/01/01 level as zero point.
The correlation is apparent as we know about it. I noted two points in this chart:
(1) The correlation cycle is diverging since the beginning of year 2017. Personally, I take the starting point of this divergence at mid-December 2016 when Trump announced that his economic policy would not favor strong USD, and this speech badly shocked the markets who were holding great expectations on USD.
(2) As of today, gold prices recovered well back to price levels before US election, on the other side US10Y bonds yields are still much above their November.2016 levels, This might be due to the quantitative tightening actions of FED. Recently, US10Y bonds yields are defending the 2.100-2.200 band, but the general bias is on further decrease side with a big risk.

USOIL WTI : Sell setup **
This setup is in correlation with my longterm daily short view , watch in related idea and update .
Accumulation of :
-H4 Trend retest (Red)***
- Double downtrend (blue)
- Resistance zone
- Triple fibonacci level
- Bearish structure continuation
A safe way to trade is to wait for a retest of the red trend & a breakout of the current m15 bull trend .

The Correlation..Weekly Timeframe
EURUSD Main Strength -98.7%
AUDUSD Main Strength-74.2%
GOLD Main Strength -68.6%
GBPJPY Main Strength +5.0%
USOIL Main Strength +NODATA
USDJPY Main Strength +52.1%
DXY

$BTCUSD $QQQ Correlation ContinuesI just wanted to follow up on my last post, after I had first realized that $QQQ and $BTCUSD move in a pretty close lock-step, with the Nasdaq 100 actually making the moves first.
Still been trading this strategy with a pretty high success rate.
Here's my first post on the idea.
