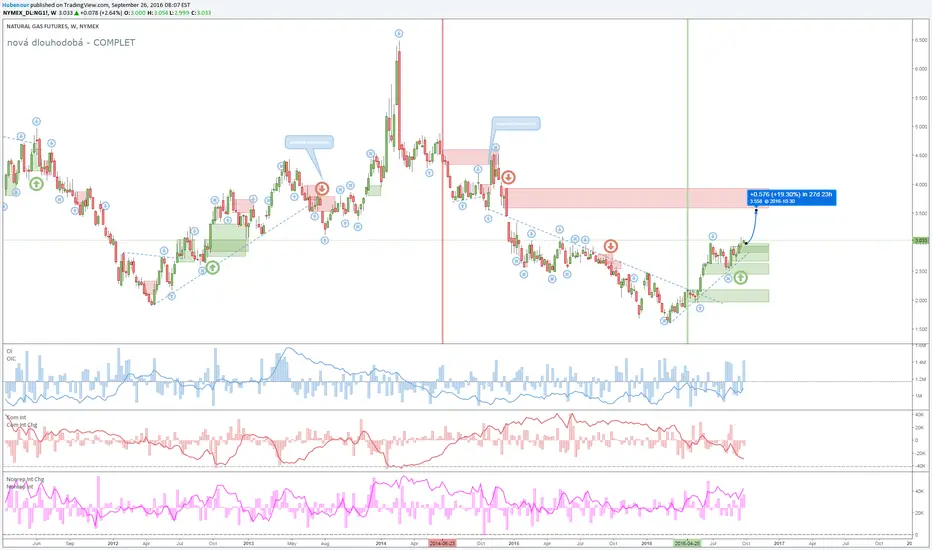
NATURAL GAS is driving for $3.550?Bounce from critical zone (failure of correction) @2.520 and solid spike on OPEN INTEREST last week should be sign of strenght.
COT
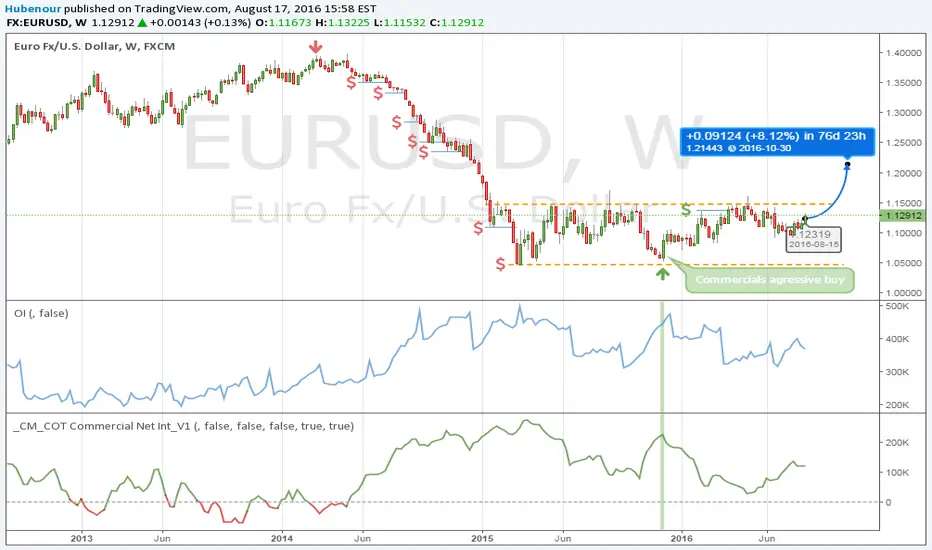
EURO seems to be stronger next couples of weeks for meVery agresive buy commercials from 30.11.2015 with first profit taking @1.1378 still in play?
Trapped traders - how to use the commitments of traders report Before reading this I want people to understand that this kind of trade doesn't always work (NO TRADING SYSTEM DOES) so if this single trade doesn't work, don't lose confidence in the technique - it has served me extremely well and I have used it many times before. Both for USDJPY (2 ideas) and USDCAD (1 idea) - you can find these ideas on my page.
Links to those ideas
(UCAD was positioning hugely long)
You can find the commitments of traders report on this page (www.cmegroup.com) every Friday. It reflects the current positions of forex futures traders in Chicago's Mercantile Exchange on the Tuesday of that week.
You want to see the "leveraged" positions - these are CTAs and hedge funds - the people like you and me that are speculating on these prices with the objective of making returns; usually with leverage.
This is last Friday's report for AUDUSD.
prnt.sc
Note how Long (blue) positions have been rising.
On 18/7 the net position was 45k LONG, on 8/8 the net position is 75k LONG.
So between these two dates, we know that 30,000 long positions were opened. The price on 18/7 was 0.7916 and on 8/8 it was 0.7911. Those positions were therefore opened above 0.7900.
The current price is 0.7820 and that means that all of those positions are experiencing a draw down of AT LEAST 80 pips (>1%). They are trapped traders.
If price continues to move down, at some point those people are going to get out of those longs because the draw down will be too much for them to take.
Getting out of a long = going short => price moving down = move people have to exit their longs = going short => price moving down etc.
So just go short and you can benefit from this.

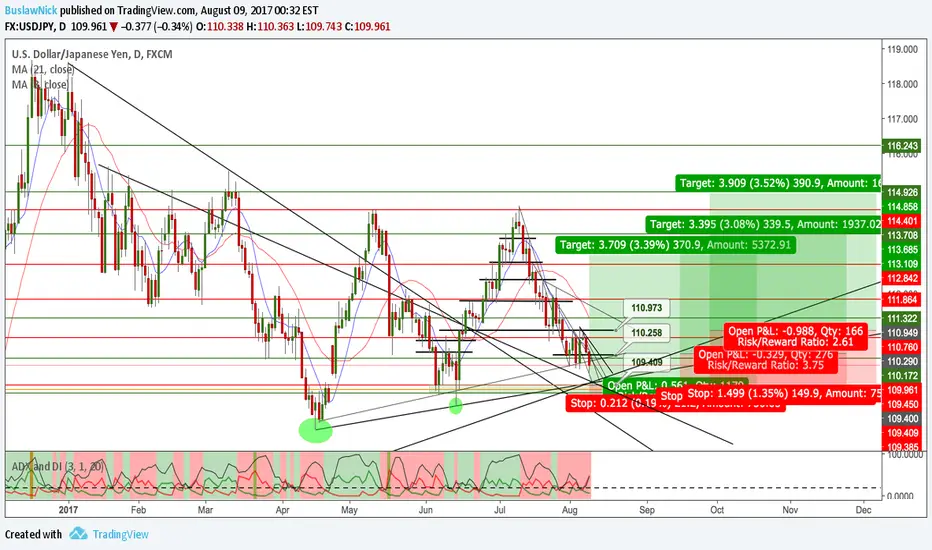
UJ LongLong based on trendline 3rd touch
Additionally supported by COT data 80% Non-Comm Inst. Reportables Long USDJPY.
(too late but will edit with a better write up later)
Analysis of production, consumption and reserves of oil and oil On April 11, a fresh STEO report comes out, so you should wait for the updated forecast for the oil market from an official source. Conclusions on this report will be published in the blog www.cofutrading.com. But at the moment the situation is as follows: OPEC reduces production, and the US increases it. But along with the growth in production, which is accompanied by an increase in the number of drilling rigs in the US, oil consumption is also increasing. Exports are also high. Despite of inreasing us oil stocks (which is quite normal for a given time of the year), the growth rate of reserves is low, it is lower than last year and below the average for 5 years of value. That in general is bullish (at least for me). Demand for gasoline is high, demand for distillate is also high, so refineries will continue to "consume" a sufficient amount of oil, absorbing the growth of supply. Judging by CFTC COT reports, as of March 28, funds reduced their extremely bullish position. I do not attach high importance to these reports, I can only say that the long lines have been dropped, so the way for entering new long positions is open. I continue to adhere to the neutral-bullish direction in the US oil market, but before the opening of new positions I will wait for a new STEO report from the EIA.
See EIA report charts at my facebook page :

Analysis of production, consumption and reserves of oil and oil On April 11, a fresh STEO report comes out, so you should wait for the updated forecast for the oil market from an official source. Conclusions on this report will be published in the blog www.cofutrading.com. But at the moment the situation is as follows: OPEC reduces production, and the US increases it. But along with the growth in production, which is accompanied by an increase in the number of drilling rigs in the US, oil consumption is also increasing. Exports are also high. Despite of inreasing us oil stocks (which is quite normal for a given time of the year), the growth rate of reserves is low, it is lower than last year and below the average for 5 years of value. That in general is bullish (at least for me). Demand for gasoline is high, demand for distillate is also high, so refineries will continue to "consume" a sufficient amount of oil, absorbing the growth of supply. Judging by CFTC COT reports, as of March 28, funds reduced their extremely bullish position. I do not attach high importance to these reports, I can only say that the long lines have been dropped, so the way for entering new long positions is open. I continue to adhere to the neutral-bullish direction in the US oil market, but before the opening of new positions I will wait for a new STEO report from the EIA.

COT signal directional change for coffee?Looking to trade coffee long with stops under previous cycle low for conservative risk. Target upper TL , allow for fluctuations of price with an accommodative stop management in order to achieve the desired target.

NZD/JPY, DAY CHART, SHORT (18-FEB-2017)From the Price Action, there are more selling
pressure than buying pressure in this consolidation pattern.
From COT Report,
For JPY, there are more non-commercial positions
added to long side.
From both Price Action and COT Report, there is
confluence that NZD/JPY might go down further.
Here are 2 trading plans for you:
1. When the price break the support level, short
2. If the price pull back to previous resistance level,
wait for bearish signal to short

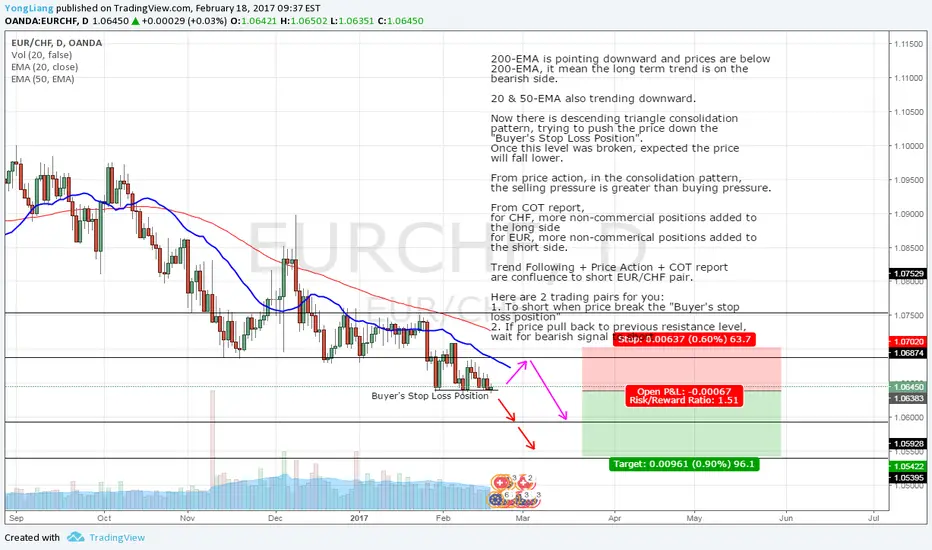
EUR/CHF, DAY CHART, SHORT (18-FEB-2017)200-EMA is pointing downward and prices are below
200-EMA, it mean the long term trend is on the
bearish side.
20 & 50-EMA also trending downward.
Now there is descending triangle consolidation
pattern, trying to push the price down the
"Buyer's Stop Loss Position".
Once this level was broken, expected the price
will fall lower.
From price action, in the consolidation pattern,
the selling pressure is greater than buying pressure.
From COT report,
for CHF, more non-commercial positions added to
the long side
for EUR, more non-commerical positions added to
the short side.
Trend Following + Price Action + COT report
are confluence to short EUR/CHF pair.
Here are 2 trading pairs for you:
1. To short when price break the "Buyer's stop
loss position"
2. If price pull back to previous resistance level,
wait for bearish signal to short
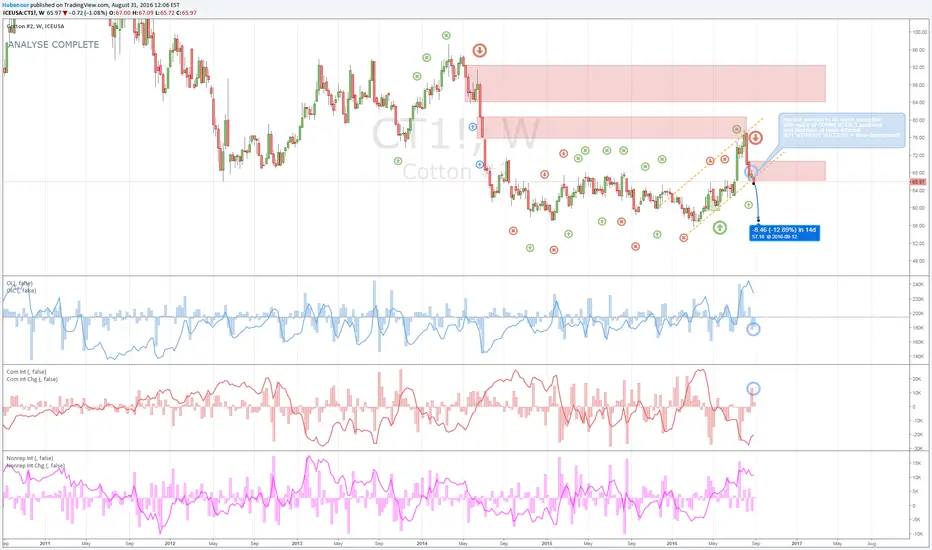
COTTON failed trying to make a correction?Speculation on making a new low after failure of correction point.
Bearish on COCOAShould see some drop price after failurse of correction into upside several times and after fundamental new this week 01126?]http://www.nasdaq.com/article/cocoa-pares-losses-coffee-drops-ahead-of-export-data-20160913-01126?

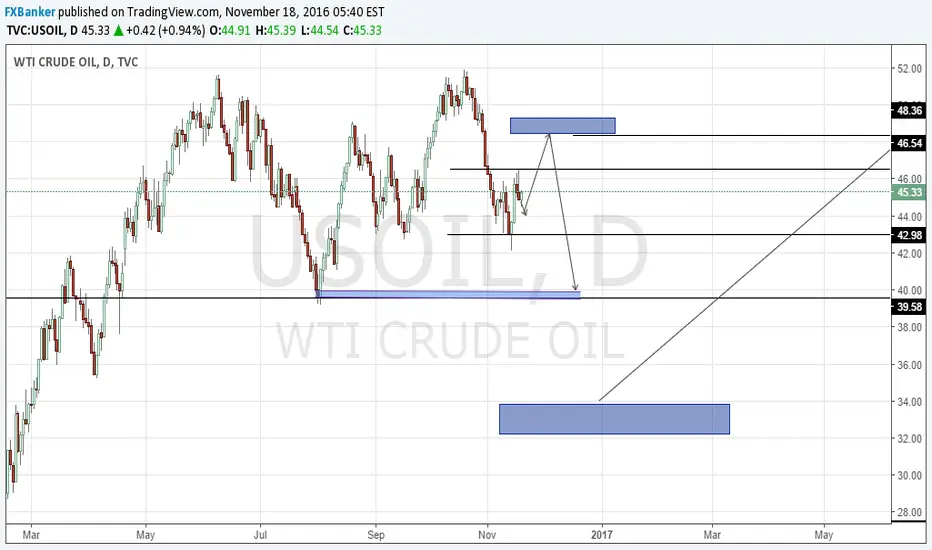
The time for selling oil is upon UsThe recent test of the 51 area signaled the biggest net short position by producers in a very long time.
The sold in anticipation of higher prices but now the market topped and needs to correct before we see a big push to the $60 that Saudi Arabia wish to reach soon.
I will be placing a limit at the 48 area and sell to $40 - $35 range, That is the area where we can start piling up on long term buys and re-enter with each daily retracement.
The demand for oil keeps rising we are in a 40 year bull market , we must not worry about excessive manipulation and noise from the talking heads on TV and focus on a long term perspective.
The true direction is a medium term bear move. I will also place a sell stop below the recent swing low just in case OPEC meeting sends us straight down.
COT Based on CMEHello traders ! This week i will remain super active. Here is the commitment of Traders report based on CME. must take a look while taking any trade. Thanks

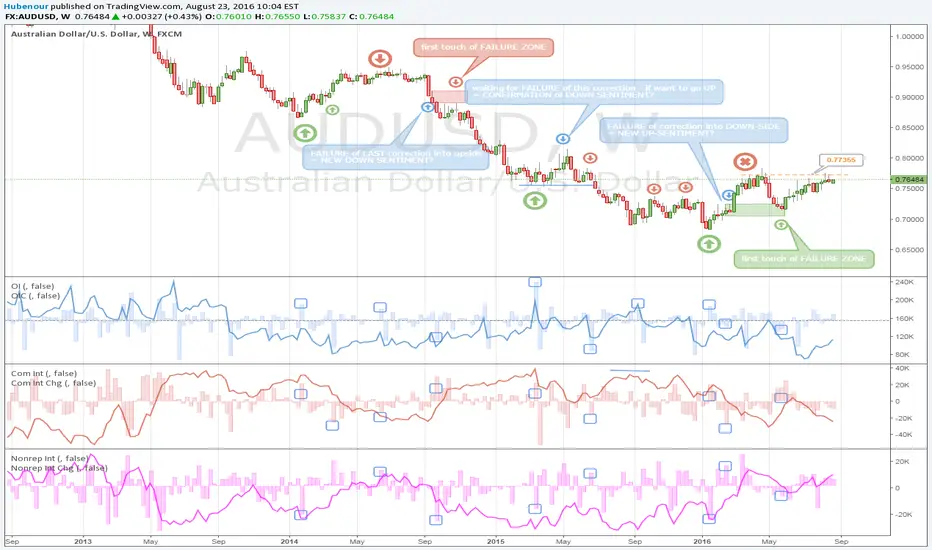
Still positive on Aussie, BUT...Clean bullish sentiment on Australian dollar for me (from $0.7153) and still positive . But last week we touched $0.77355 with rissing Open Interests, so probably we will see some profit-taking before breaking through (IF BREAK THROUGH). So no suprise it the price will fall little and make sme correction.
Crude stronger (watch out 50.00 level!)After bounce @30.00 on 08.02.2016 looks CL strong for me. second tuch of resistance @50.00 looks like profit taking. WATCH OUT 50.00 LEVEL!!!

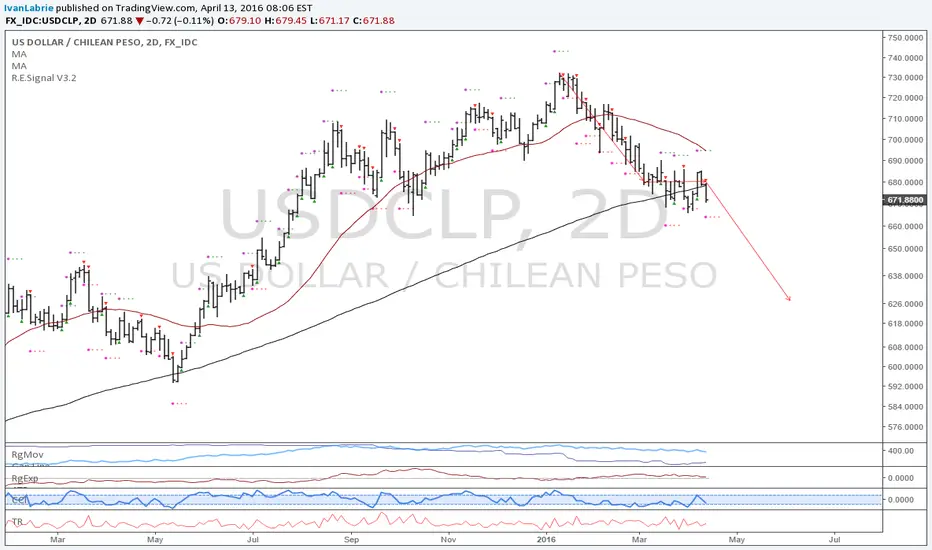
USDCLP: Downtrend continuation shortUSDCLP has traced a nice downtrend, and now with commercial hedgers net long copper I expect excellent continuation into the lows.
Target is on chart, the time at mode signal specifies a slightly higher target, but there's potential to reach the red arrow below.
Shout out to my mate Tom Killick, he's frequently trading this pair. Check out his posts, definitely a trader worth following.
Good luck if taking this trade.
If interested in my trading signals, or in personal tuition, contact me privately. I'm offering a considerable discount on a packaged course which includes access to my private trading signals list for a year.
Cheers,
Ivan Labrie.
CHFJPY: Want to short oil? Here's a nice proxy pair...CHFJPY is offering a terrific reward/risk opportunity in the daily chart.
As you can see I have marked a level of net short positioning for oil futures traders, as well as added the oil line chart as an overlay to the comittment of traders report data indicator so you can see what happened the last time commercial hedgers' net short positions reached these levels.
I anticipate downtrend continuation naturally, and as you can see, this pair is a good alternative to outright shorting oil futures, and if you factor in pips instead of % distance, it can outperform the oil shorts, with potentially lower risk (considering the way the chart's setup).
As a sidenote, commercial traders are now net short the Swiss Franc, which is good incentive too. (They have been wrong in the Yen, but large specs have captures all major moves in it and are net long and increasing longs currently).
Entry is either a new daily low, or a retracement to the red triangle tip with stops above the red line or using 1 to 3 times the daily ATR value.
If interested in my trading signals, or in personal tuition, contact me privately. I'm offering a considerable discount on a packaged course which includes access to my private trading signals list for a year.
Cheers,
Ivan Labrie.

Aussie move driven by short coveringHi everyone!
I would really appreciate any comments or thoughts on this analysis, what are you missing here, if there is anything unclear. Your time is greatly appreciated! Thank you.
Last week I published and Aussie did actually exactly what was anticipated. Price went up confirming support zone and pivot points at .695. Price is now siting in from of resistance zone and 618 Fib retracement which is usually sell zone for bears.
Considering that according to COT report from last week the number of short was reduced while number of longer hasn't gone up much someone can interpret this price increase can be just a short covering and is not driven by bulls.
As a result I see price of Aussie to retrace towards .702 levels this week. Significant volatility might be triggered around Interest rate decision on Wednesday.

Yen Major Move Up Coming! Custom COT Indicators!Overview.
-This is the Beginning of a Educational Series from Jake Bernstein to the TradingView Community.
-Many Traders use the COT Data Incorrectly.
-Jake Discovered if You Look at the Net Commercials and Take Note When Commercials net Buying is Either At All Time Highs, Or Net Buying = Longest Period of Buying Look for an Extreme Move To the Upside.
-In The Future We Will Show Precise Entry Signals…But a Basic Entry Signal Is When Commercials Go From Net Long to Net Short.
-Full Credit in Methodology goes to Jake Bernstein at www.Trade-Futures.com and www.2Chimps.net
Thought Process:
-Commercials Represent Large (Typically Billion Dollar) Companies.
-Take Note - When Commercials Are Buying at Record High
-Take Note - When Commercials Are Buying For Record Long Periods of Time
***Note…Commercials Can Buy For Extended Periods Dollar Cost Averaging…
***Basic Entry Listed In Overview.
***More Precise Entries Will Be Introduced Soon.
Take Note When Commercials STOP Buying and START Selling
Indicator Shows Net Commercials
-Full Credit goes to Greeny for Creating Original Code. I only made slight modifications.
Lower Indicator Modifications include
-Took Off Net Long and Short Individual Plots
-Added Optional Background Highlighting when Commercials Switch from Long to Short
-Added Optional Alert Capability If Commercials Go From Net Long to Short
-Ability to Show INVERSE - This makes it Easier for some Traders to See…Since the Signals look similar to MacD/RSI Type Indicators.
Upper Indicator Modifications include:
-Added Ability to Plot Text Entries when Commercials Switch From Net Long To Short
-Added Optional Background Highlighting when Commercials Switch from Long to Short
-Added Optional Alert Capability If Commercials Go From Net Long to Short
***Additional Indicators and Updates Coming Soon
***Link To Lower Indicator & Upper Indicator Below Under Related Ideas:

US Dollar Index To Fall - First Support at 84.50The US Dollar Index has been rising strongly for most of this year, coincident with a major decline in broad based commodity indexes. However, we are currently seeing signs that the current price level may be the end of this strong run and lead to a major consolidation - likely coincident with a rally in overall commodities.
This chart shows the daily Dollar Index. There is a notable divergence on the momentum indicator between the October high and the current December high. The notes on the chart show that a typical price target after a divergence pattern would be for a retracement to the price low of the divergence pattern - in this case at about 84.50 which would be the next major horizontal price support on the chart.
Also while not shown on the chart the current Commitment of Traders data shows that the large speculators maxed there net long position at the October high as well, and the current run up from Oct to December has been on commercial buying which is opposite their normal pattern, and is a typical and classic sign of capitulation in a trend. This creates a compelling technical set-up for a sell out or short position. And the CoT data gives us confirmation from the "fundamentals" as evidenced in the extreme net short of the "smart money" commercial traders. The divergence or capitulation in commercial positions just gives us another aspect of market psychology suggesting that the trend is very close to an end.

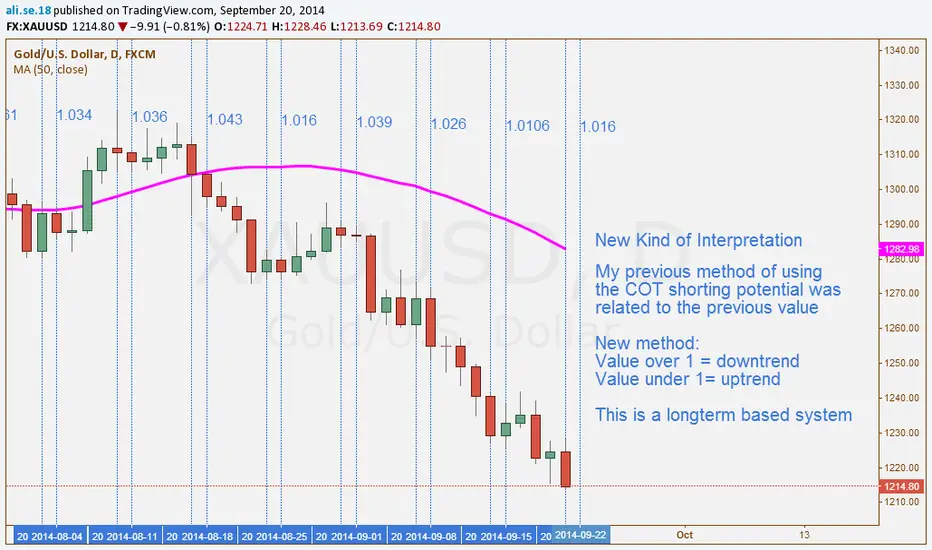
New COT Analysis XAU/USD 19/09/14My previous interpretation of this value was that I looked if the potential went lower or higher than previous week for defining a trend.
But after watching a bit back in the past it shows more accuracy if the trend is defined by the point 1.
If the potential wents from over 1 to under 1 it becomes an uptrend.
If the potential wents from under 1 to over 1 it becomes a downtrend.
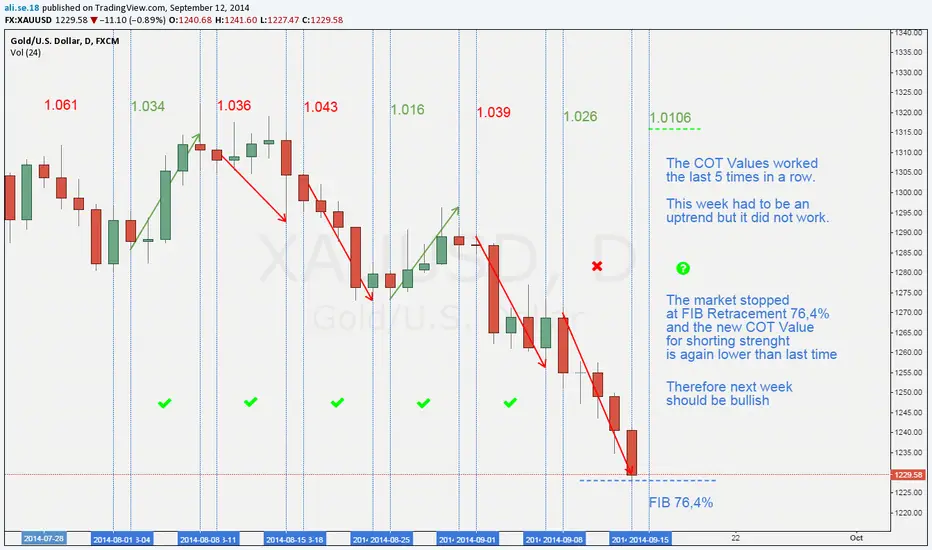
COT Analysis 12. September XAU/USDWe had a lower shorting potential this week but the market did not go up. The COT shorting potential is a very qualitative value for predicting the market direction of the upcoming week. It depends on the relation to the last value.
The so called shorting potential is again the second time lower and the commercials are stocking up their long positions. Addiotionally we have Indian Celebration and Marriage season upcoming.