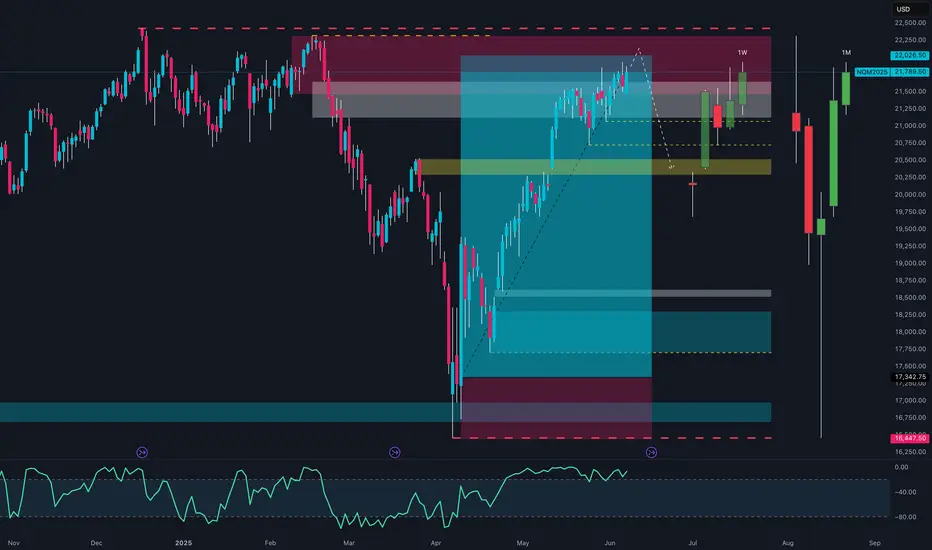
NQ100 → Entering the Danger Zone?📈 1. Technical Context (Price Action & Structure)
The daily chart shows a strong bullish continuation from the 17,350 area, with price now extending toward the 22,000 USD zone.
We are currently within a weekly/monthly supply, with:
Mild RSI divergence in overbought conditions
Temporary rejection at 22,050–22,200
A potential liquidity sweep above highs before distribution or pullback
The monthly structure shows a strong swing low that may serve as anchor for a future reversal
🧠 2. COT Report – Commitment of Traders (as of June 3)
Commercials (Smart Money):
+4,041 long | +3,320 short → Net +1,455 → hedging phase, not trend expansion
Non-Commercials (Speculators):
–2,237 long | +125 short → net exposure reduction
Open Interest increasing → new positions building, but no extreme imbalance
📌 Conclusion: Tactical neutrality, slight bullish lean from commercials.
📆 3. Seasonality
June has been historically bullish, especially in the past 2 years (+700 pts avg)
10Y average still leans bullish
⚠️ September is a clear seasonal reversal month across all timeframes
📌 Conclusion: Seasonal tailwind through end of June; cyclic reversal risk into Q3.
📰 4. Macro Calendar
High-impact USD week:
CPI – Wed, June 11
PPI – Thu, June 12
These will be critical to:
Validate the disinflation narrative
Set expectations for a Fed cut by Sep/Nov
📌 Conclusion: Expect explosive mid-week volatility — watch for liquidity spikes above 22,000 if CPI surprises.
⚙️ Operational Outlook
✅ Primary scenario (bullish continuation):
🎯 Target: 22,260 → fib extension + structure
❌ Invalid below 21,350
🔄 Alternative scenario (mean reversion):
🔻 Short from 22,050–22,200
🎯 Target: 20,950 → liquidity + FVG zone
🔁 Trigger: weekly engulf or hotter-than-expected CPI
COT
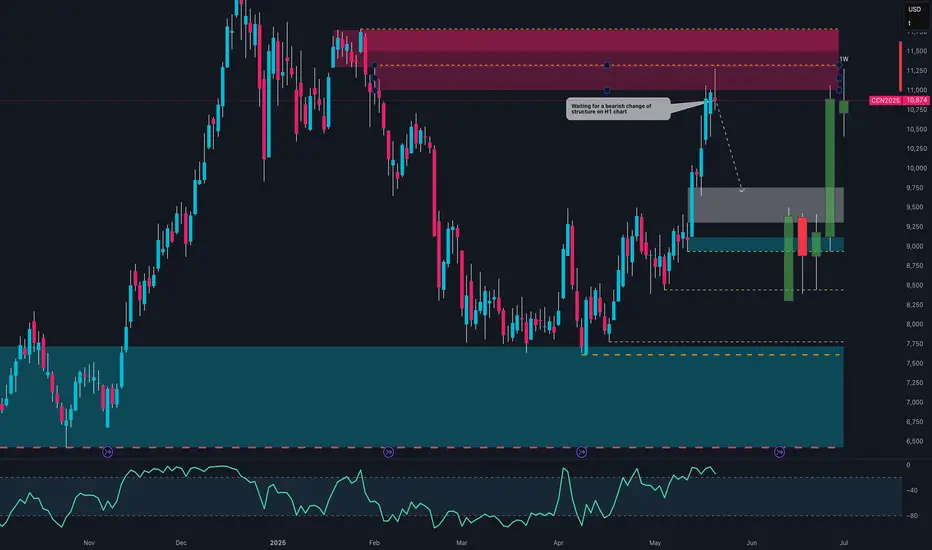
Cocoa Bounce From Demand – Can This Lead to a New 2025 High?On June 11th, price reacted sharply to a key demand block around the 8,880–9,000 zone, which aligns with:
Golden Pocket Fib (0.705–0.78) between 8,420 and 9,006
The midpoint of a previous consolidation range
A liquidity sweep followed by a strong bullish rejection
The RSI is showing a bullish divergence (lower lows on price vs rising RSI), which supports a possible technical rebound.
🟣 Immediate target: 10,400–10,600 (supply zone)
🔴 The bullish bias would be invalidated on a close below 8,850
📈 Commitments of Traders (COT) – as of June 3, 2025
Non-Commercials (speculators): still net long, but reduced their long exposure by -2,006 contracts, and trimmed shorts slightly as well
Commercials: remain heavily net short with over 61,000 contracts (61.4% of OI), indicating ongoing hedging by producers
Open Interest dropped by -1,257 → a sign of general position liquidation
➡️ The reduction in speculative longs likely reflects profit-taking after the May rally, but overall net positioning remains bullish on a medium-term view.
📅 Seasonality – June
On the 20, 15 and 10-year averages, June typically shows a moderately bullish rebound, often following weakness in May.
On the 5 and 2-year views, however, performance is more neutral to slightly negative.
Historically, June acts as a consolidation or pre-rally month, often preceding a stronger uptrend in July–August.
🧠 Operational Outlook
Bias: Moderately bullish in the short term, with potential recovery toward 10,400. Structure still shows signs of broader distribution, so caution remains in the medium term.
🎯 Trade idea:
Aggressive long initiated on the bounce from demand
First target: 10,400
Breakout extension: 11,200
Invalidation on daily close below 8,850

EURJPY Bulls in Trouble? Massive Rejection Signals📉 Full Multi-Factor Analysis – EUR/JPY
🔍 1. Price Action
EUR/JPY strongly rejected the key supply zone between 164.80–165.50, aligned with a major static resistance.
Last week's breakout was invalidated by a clear bull trap, followed by a bearish engulfing candle.
Price broke below the ascending channel drawn since April and is now heading toward the 162.00 demand area.
The weekly RSI shows a bearish divergence, confirming a slowdown in momentum.
➡️ Technical Bias: Bearish toward 161.50–162.00, with a possible extension to 160.00.
💼 2. COT Data – Commitment of Traders
EUR Futures (CME)
Strong increase in commercial longs (+16,095) and non-commercial shorts (+4,830).
Suggests smart money is accumulating while retail/speculators are pressing shorts — potential accumulation, but no breakout yet.
JPY Futures
Significant rise in non-commercial shorts (+10,575), while long positions declined.
The yen remains pressured, but extreme positioning could fuel a reversal if sentiment flips.
➡️ COT Takeaway: Euro remains in bullish consolidation. Yen is heavily oversold — ripe for mean reversion. Caution warranted.
📊 3. Retail Sentiment
80% of retail traders are short from an average price of 160.46, while price now sits at 164.86.
The crowd is deep in drawdown — a typical condition for short-term consolidations or fakeouts before reversals.
➡️ Implication: Price may hover around 164+ to trap remaining retail shorts before unwinding.
📈 4. Seasonality
June seasonality for EUR/JPY is historically neutral to bearish.
Only the 5-year data shows strength, while 15Y and 20Y trends reveal consistent downside starting mid-June.
➡️ Seasonal Outlook: Adds further weight to a bearish correction scenario for the second half of the month.
✅ Actionable Summary
📌 Weekly Bias: Bearish
📉 Main Target: 162.00–161.50
📉 Extended Target: 160.00
📈 Invalidation: Weekly close above 165.60
🧠 Final Thoughts
All major elements — price action, COT, sentiment, and seasonality — point toward a corrective move on EUR/JPY.
Given the strong underlying trend and retail’s positioning, watch out for bull traps before deeper downside.
Best setup: Sell the pullback or wait for clean breakdown below 163.00.

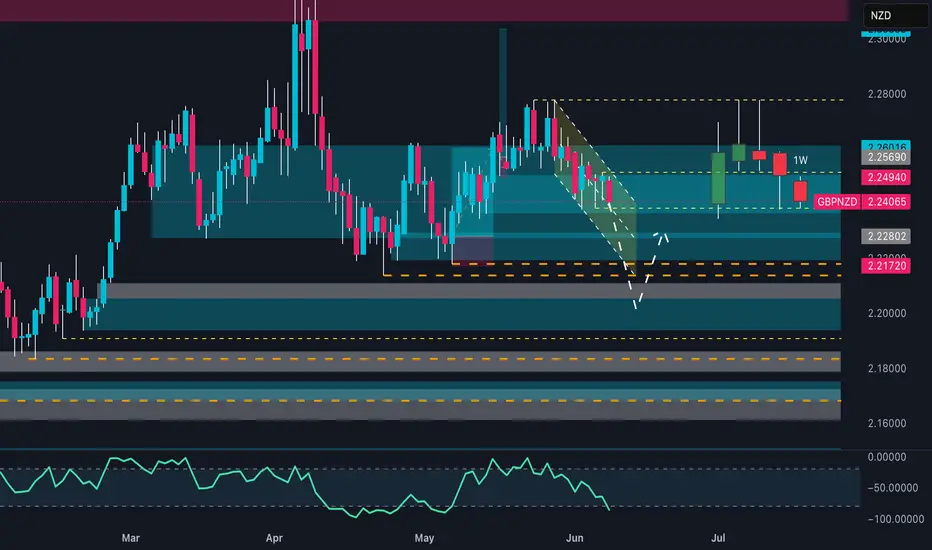
GBPNZD Ready to Flip? Key Reversal Zone in Play🔹 1. Price Action and Technical Structure
Price is currently at 2.2405, declining from the recent high in the 2.26–2.28 area.
The pair completed a descending channel with potential for reversal. A bullish reaction is taking place from the 2.2280–2.2170 demand zone, supported by previous volume spikes.
The RSI is falling, nearing oversold territory but not yet at extreme levels.
Possible technical scenarios:
Bullish: Recovery toward 2.2560–2.2600, with a potential breakout above recent highs.
Bearish: A break below 2.2170 could trigger further downside toward 2.2000 and 2.1800.
🔹 2. Seasonality (June)
NZD
June tends to be slightly positive for NZD (average: +0.0011 over 20 years), with consistent monthly patterns.
GBP
June is historically neutral to negative for GBP (average: +0.0015 over 20 years, but negative over 5 and 2 years).
➡️ This implies a seasonal edge for NZD over GBP.
🔹 3. Retail Sentiment
60% of retail traders are long on GBPNZD.
40% are short, but long positions average 2.1874, currently in profit.
➡️ This presents a mild contrarian bearish pressure, due to crowding on the long side.
🔹 4. Commitment of Traders (COT) – Institutional Positioning
GBP (as of 2025-06-03)
Commercials Net Long: +74.5K
Non-Commercials Net Short: -11.3K
Weekly changes: +30.3K longs vs. +32.6K shorts
➡️ Moderate balance, but growing speculative short interest.
NZD (as of 2025-06-03)
Non-Commercials Net Short: -23.6K
Strong weekly increase in commercial longs (+6.4K) and total long flows
➡️ NZD is seeing renewed interest from commercial players — a potential bullish signal.
🔹 5. Trading Outlook
📌 Current Bias: Neutral with short-term bearish tilt, but medium-term bullish reversal risk rising.
➤ Potential setups:
Conservative Long Entry: On bullish confirmation at 2.2170 (double bottom or bullish engulfing), target 2.2560–2.2600
Aggressive Short Entry: On pullback to 2.2490–2.2560, with stop above 2.2620, target 2.2280–2.2170
🎯 Seasonal and institutional factors favor NZD strength, but technical structure calls for caution and confirmation.
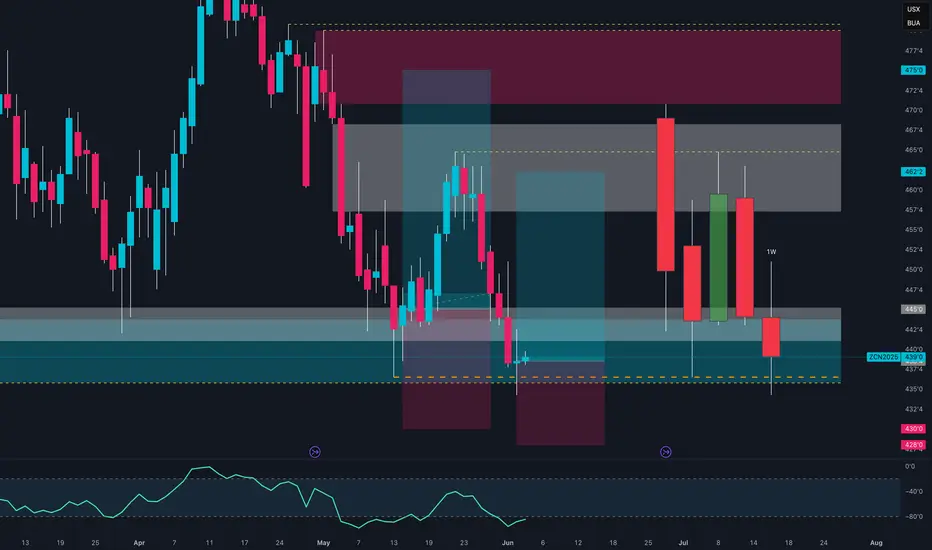
Corn at the Cliff Edge: Bearish Breakdown or Smart Money Trap?📉 1. Price Action & Technical Context (Weekly Chart – ZC1!)
Price is currently sitting around 439'0, after rejecting the 462'2 supply zone (gray block) and confirming rejection from the macro supply area between 472'6–480'0 (red block).
The last four weekly candles show a failed recovery attempt (three green candles trapped between two strong red ones), culminating in a bearish breakout below the intermediate demand zone (445'0–442'0).
Now, price is back inside the key demand zone between 439'0–433'4, an area with heavy volume and previous significant lows.
🔍 Technical takeaway: Bearish breakout confirmed. Price is testing the last major weekly support before opening the door toward the yearly lows (~420'0).
📊 2. Commitment of Traders (COT Report – May 27, 2025)
Non-Commercials (Speculators):
Long: 324,377 (▼ -17,952)
Short: 344,710 (▼ -9,171)
Net Position: -20,333 → Bearish, but the unwinding of both sides suggests profit-taking.
Commercials (Institutions):
Long: 766,211 (▲ +12,588)
Short: 713,647 (▼ -962)
Net Position: +52,564 → Increasing → Institutional accumulation.
🔎 Key observation: Commercials are increasing their net longs, while speculators are reducing exposure. This diverges from price action and may signal institutional accumulation under 440.
📉 3. Net Positioning vs Price (COT Chart)
The chart shows a clear decline in speculative longs since March, with a new low this week.
Meanwhile, commercials are gradually increasing their long exposure, positioning themselves against the current bearish trend.
💡 Combined view: While price keeps dropping, the "smart money" is accumulating → possible bottom forming, though not yet confirmed technically.
🌾 4. Seasonality
June Performance:
20-Year Avg: -4.25%
15-Year Avg: +12.31%
5-Year Avg: +1.15%
2-Year Avg: +28.61%
📈 Seasonal Conclusion: The seasonal bias has turned strongly bullish in the last 2–5 years. June–July is often a rally period for Corn following the late-May bottoms — likely tied to U.S. planting season dynamics.
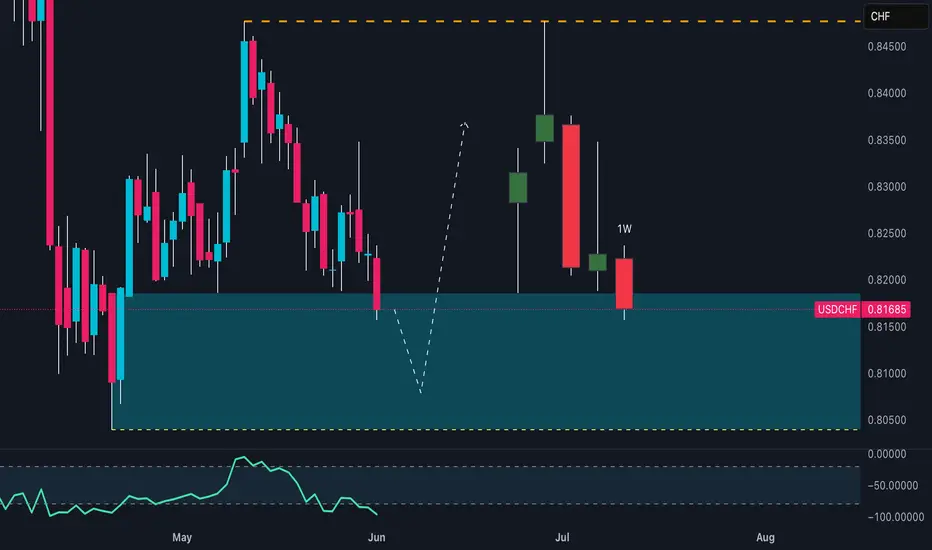
USD/CHF Setup Breaking Down: Don’t Get Caught Long This TrapUSD/CHF is currently trading at a critical technical and macro-structural juncture. Price is hovering within the weekly support area between 0.8050 and 0.8200, a zone that has historically triggered significant bullish reactions. However, the latest weekly candle closed below the psychological 0.8200 level, showing a clear rejection of upper resistance and signaling a lack of buying strength on the U.S. dollar side. This weak closure undermines the bullish structure and opens the door for a potential continuation of the downtrend—especially if price breaks below the 0.8150 mark on the daily or H4 timeframe.
From a seasonal standpoint, June has historically been a bearish month for USD/CHF. Monthly average returns over the past 20, 15, 10, and 5 years confirm steady downside pressure on the dollar against the Swiss franc. Only the 2-year average shows a slight positive bias, but it remains an outlier against the broader seasonal trend. This supports the idea that the recent weakness is not only technical but also cyclical in nature.
The Commitment of Traders (COT) report reinforces this bearish view. On the Swiss franc side, commercial traders (typically the most informed and hedging-oriented participants) are heavily net long, while non-commercial traders (speculators) remain significantly net short. This imbalance is often seen around reversal points and may indicate rising CHF strength. On the U.S. dollar side, positioning is far more balanced—the Dollar Index COT shows a neutral stance, with non-commercials slightly net long but without any dominant momentum. This confirms there’s currently no structural strength behind the dollar to justify a meaningful rebound in USD/CHF.
Lastly, retail sentiment provides a classic contrarian signal: over 90% of retail traders are long on USD/CHF, with only 10% short. This extreme imbalance typically occurs ahead of bearish breakdowns, as institutional players tend to fade overcrowded retail positions.
In conclusion, USD/CHF remains vulnerable to further downside. The weekly price action is weak, seasonal trends are dollar-negative, COT positioning favors CHF strength, and retail sentiment is extremely long-biased. All factors align toward a likely bearish continuation, with technical targets in the 0.8080–0.8050 range. The only alternative scenario would require a strong H4/H1 bullish reaction with a reclaim of 0.8220—but at this stage, that appears unlikely without a major macro catalyst.
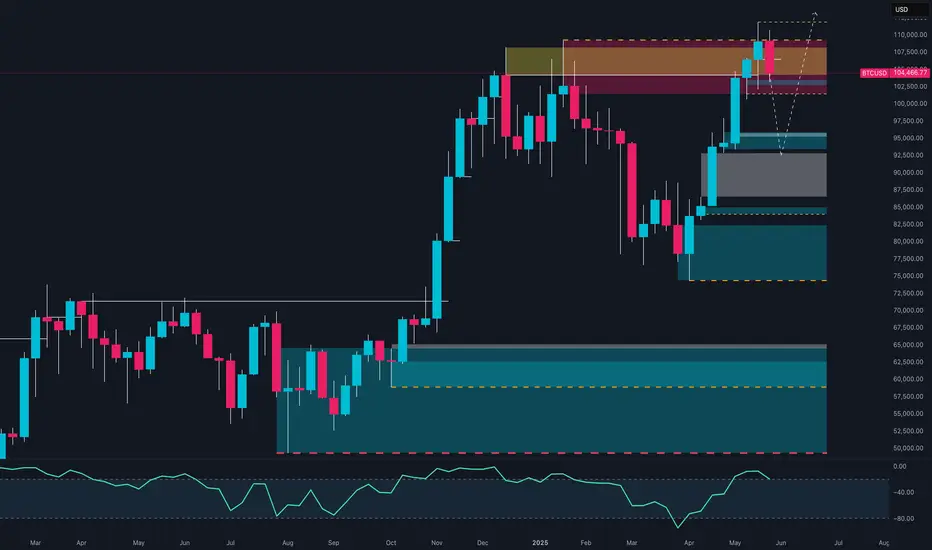
Bitcoin at a Crossroads: 110k RejectionAfter the powerful rally that began in the last quarter of 2024, Bitcoin is now at a critical market juncture. The price has once again reached the 106,000–110,000 USD zone, an area that already showed strong signs of distribution back in February and March 2025. This isn’t just a typical resistance level—it’s a psychologically loaded zone, marked by previous highs and repeated selling pressure.
In May, the monthly candle revealed a clear rejection from this zone: a prominent upper wick and a bearish body, signaling the bulls' struggle to sustain new highs. This behavior suggests the beginning of a profit-taking phase or, more likely, a medium-term consolidation.
The picture becomes even more complex when we look at the COT Report dated May 27, 2025. Non-commercial institutional traders—speculative funds, hedge funds, and portfolio managers—have significantly increased their short positions, now exceeding 26,800 contracts. Meanwhile, long positions are hovering around 24,500, resulting in a net bearish exposure. The message is clear: smart money isn’t buying the breakout—it's selling into it.
Seasonality analysis reinforces this narrative. Historically, June tends to be a weak month for Bitcoin, often followed by renewed strength in the next quarter. The 2025 seasonal curve has mirrored the bullish pattern of 2021 up to May, but now—consistent with historical patterns—is showing signs of slowing. This supports the idea that the market might need a breather before potentially rallying again in Q3.
From a technical standpoint, the key levels are well defined. The 95,000–97,000 USD area is the first dynamic support zone, where the price might find short-term relief. However, the more significant support lies between 82,000 and 85,000 USD—this is the origin of the current rally and aligns with the old breakout structure. A return to this level would represent a healthy and natural correction within a still structurally bullish long-term context.
In summary, the current outlook calls for caution. Momentum is fading, seasonality is unfavorable, and institutional players are trimming long exposure while adding to shorts. Until the price can consolidate above 110,500 USD, the dominant scenario remains a corrective pullback, with interim targets at 95k and potential drops toward the 85k zone.
However, if the market surprises with a strong weekly close above the highs, it could pave the way for a new leg up toward the 125,000–135,000 USD range—potentially fueled by macro catalysts such as ETF inflows, Fed narratives, or broader adoption.
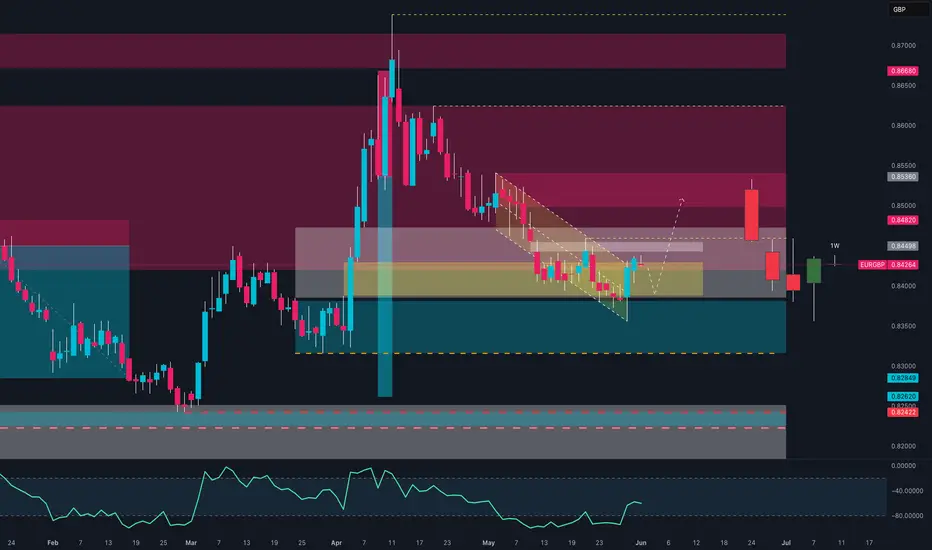
EUR/GBP at a Tipping Point: Key Demand Zone or Breakdown Ahead?The EUR/GBP cross is currently trading in a key technical area, hovering around 0.8427, showing signs of mild recovery after a bullish reaction from a previously tested demand zone.
📊 Technical Analysis
Price action reveals a compression phase within a descending channel (corrective flag), followed by a breakout to the upside last week. Price reached the supply zone between 0.8480 and 0.8535, which triggered a strong bearish candle rejection.
Currently, the pair is testing support around 0.8400–0.8380, a level previously defended by buyers.
The RSI bounced from oversold territory, suggesting the potential for a consolidation phase or sideways movement, rather than a clear divergence.
📌 Key Levels
Dynamic Resistance: 0.8480 – 0.8535
Structural Support: 0.8380 – 0.8285
Upside breakout target (if momentum builds): 0.8660
📅 Seasonality
Historically, June tends to be slightly bullish for EUR/GBP, especially on the 5-year and 10-year seasonal patterns. Curves indicate upward pressure between the second and third weeks of the month, suggesting that any retracement could present a seasonal long opportunity.
💼 COT Report
Euro FX
Non-Commercials reduced both longs (-1.7K) and shorts (-6.7K) → signaling indecision or rebalancing.
Net positioning remains positive, but momentum is fading.
British Pound
Non-Commercials added significantly to longs (+14.2K) and slightly to shorts (+2.8K) → GBP is attracting bullish interest.
This could reduce upside pressure on EUR/GBP in the short term.
Overall, COT data currently favors the British Pound in the near term.
📈 Retail Sentiment
Retail traders are heavily skewed to the long side (74% long), which may create contrarian downside pressure if the market moves against the crowd. The average entry price is around 0.8481, meaning many traders are currently underwater.
🎯 Conclusion & Bias Outlook
Short-term bias: Neutral to bearish down to 0.8380
Mid-term bias: Moderately bullish if price holds above 0.8380 with higher lows confirmation
Ideal long entry could emerge from a retest of 0.8380 with bullish confirmation (candlestick or RSI support)
Alternatively, a clear H4 close below 0.8380 could open space down to 0.8280
EUR/USD at a Crossroads: Will the Bears Strike Back from 1.14? 📍1. TECHNICAL CONTEXT
EUR/USD is trading around 1.1405, inside an ascending channel and right within a supply zone (1.1370–1.1470), which already triggered a rejection on April 16. Price action currently shows hesitation, with three consecutive candles at the top of the channel and RSI divergence, suggesting a loss of bullish momentum after an overextension.
The bullish trendline from April remains intact and validated, but the upside is narrowing. Likely scenario: bullish exhaustion followed by a pullback towards 1.1270–1.1220, with a potential retest of both the trendline and the lower boundary of the channel.
📊2. COT REPORT (USD & EUR) – Updated to May 20
USD Index: Non-Commercials added +2,044 net longs, but also +1,975 new shorts. Open Interest rose by +2,207 → a more active market, but still mixed. Net exposure remains neutral to slightly bearish for the dollar.
EURO FX: Non-Commercials cut -3,587 longs and added +6,814 shorts, while Commercials increased longs by +16,796. Speculative funds are gradually shifting short on the Euro, while Commercials continue to hedge long.
→ Combined read: Large speculators are reducing their Euro exposure and staying cautious on the Dollar. Short-term pressure on EUR/USD remains bearish, though no macro reversal yet.
📉3. SENTIMENT & POSITIONING
Retail sentiment shows 71% of traders are short EUR/USD — a classically contrarian signal. However, price is now sitting in a liquidity cluster where smart money might exploit a final squeeze before a real reversal.
Market depth shows strong imbalance, with long orders stacked above current price — suggesting potential stop hunt already triggered or about to fade.
🧭4. SEASONALITY
Historically, May is a bearish month for EUR/USD: -0.0079 on 20-year average, and -0.0163 on 10-year average. Seasonality supports late May weakness and potential downside continuation into early June.
✅ TRADING OUTLOOK
📌 Primary Bias: short-term corrective bearish, waiting for clearer reversal signals.
📌 Key Reaction Zone: 1.1400–1.1470 → structural short area, already tested.
📌 Bearish Target: 1.1270 > 1.1210 (golden pocket + trendline confluence)
📌 Setup invalidation: daily close above 1.1470 with volume → possible extension to 1.1550/1.1580
📌 Macro support: Commercials remain long on the Euro → underlying structure still bullish, but too early to fade short-term bearish momentum.

Cocoa Explosion Loading? Specs & Hedgers Agree🔍 Fundamental Analysis – Commitment of Traders (COT)
The latest COT report, dated May 13, 2025, reveals a strong bullish accumulation signal, with a significant increase in long positions across all major trader categories.
Specifically, Non-Commercials (speculative traders such as hedge funds and money managers) increased their long positions by +3,490 contracts while simultaneously reducing shorts by -467 contracts. This dynamic reflects renewed speculative confidence in the cocoa bullish trend.
Simultaneously, Commercials (typically producers and processors) added +5,187 long contracts and closed -661 short contracts. This is especially noteworthy, as commercials usually take the opposite side of speculators. Here, however, their alignment with speculators may indicate expectations of upcoming supply constraints or market stress.
Total open interest rose by more than +6,000 contracts, suggesting real capital inflow into the market rather than just rebalancing.
This alignment between speculators and institutional hedgers is rare and often precedes further price appreciation.
📈 Net Positions & Price Action
Looking at the “Net Positions & Prices” chart over the past year, it’s clear that Non-Commercial net positions are recovering after a notable drop in March and April. This reversal aligns with the technical bottom and the start of the current price rally.
Commercials, although still net short (in line with their historical bias), are reducing their bearish exposure, hinting at lower physical supply pressure or a need for hedging against further price increases.
Price action has reflected this narrative, surging higher following the April lows.
🕰️ Seasonal Analysis
Seasonality adds another layer to the analysis.
Historically, May tends to be flat or slightly bearish (10Y and 15Y averages), but the 2-Year seasonal line—which better reflects current market behavior—shows a strong bullish tendency starting mid-month. This supports the ongoing rebound and increases the likelihood of further upside in the short term.
Historical data also shows that June, while volatile, is often positive or neutral in shorter cycles.
📊 Technical Analysis
From a technical perspective, cocoa recently completed a strong bullish leg, rebounding from the 8,800–9,000 USD demand zone, identified as a clear area of institutional buying (evident through volume and impulsive candles).
The price then decisively broke through mid-range resistance levels and tested a key weekly supply zone between 11,200 and 11,500 USD, where it was initially rejected.
Currently, we are in a technical pullback, likely targeting the mitigation zone at 9,700–10,000 USD. This area represents a solid long entry opportunity if the market confirms a bullish structure on intraday charts (H1 or H4).
The RSI is near overbought, yet without divergence—suggesting the trend remains structurally bullish despite a natural correction.
🧭 Strategic Conclusion
Cocoa currently shows a rare convergence of bullish signals: supportive COT positioning, increasing net long interest, strong 2Y seasonality, and clear technical structure controlled by buyers.
However, after the recent sharp upside move, a correction to key support zones is likely before another bullish leg unfolds.
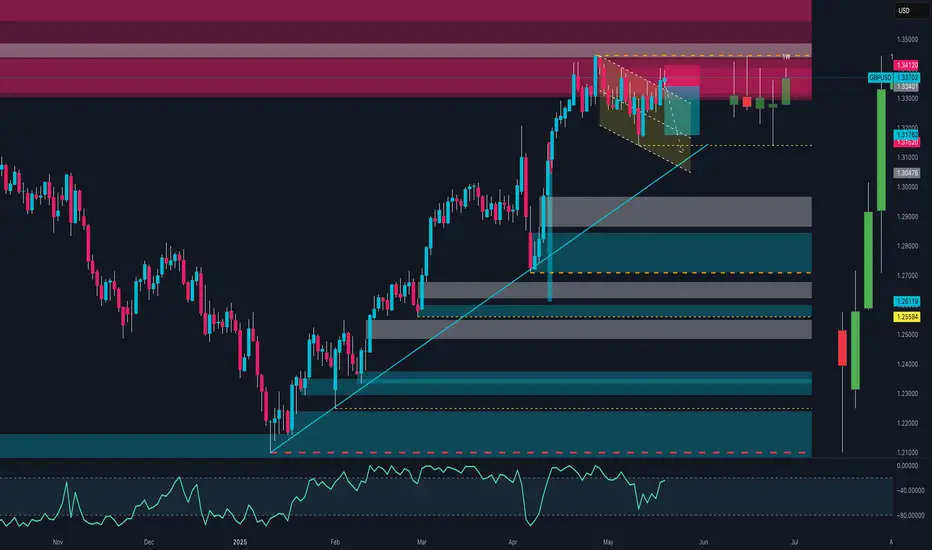
GBP/USD About to Explode?GBP/USD is currently trading around the 1.3360–1.3380 zone after testing the key weekly resistance area between 1.3400 and 1.3450. The bullish momentum remains strong, supported by speculative positioning still favoring the pound, while the dollar shows signs of softening. On the macro side, the interest rate differential between the UK and the US may narrow in the coming months, but for now, it continues to support upward pressure on the pair.
From a technical standpoint, price has broken out of an ascending triangle on the daily chart, showing strong momentum and confirmation with multiple closes above 1.3300. Market sentiment remains skewed to the short side, adding contrarian fuel to the bullish bias. The key short-term support lies between 1.3270 and 1.3300. As long as this area holds, the base case favors a continuation toward 1.3520 and potentially 1.3600. A break below 1.3170 would invalidate the current bullish structure and open the door for a deeper pullback toward 1.3000.
From an execution standpoint, a confirmed breakout above 1.3415 could offer a long entry opportunity with active management. Still, caution is advised around the weekly supply zone due to its historical responsiveness. Eyes remain on upcoming macro data and potential volatility from central bank statements.
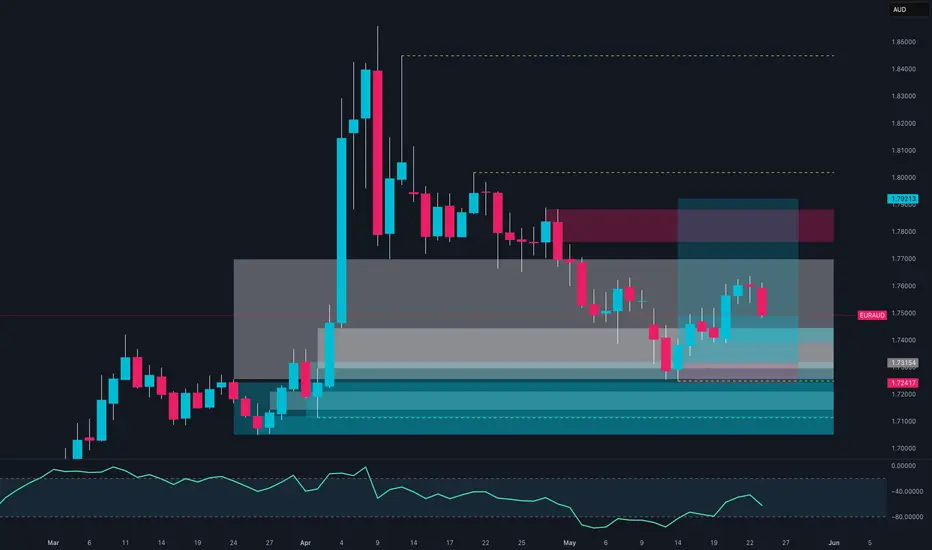
EURAUD Ready to Launch? Institutions Positioning for a Big Move!🔍 1. COT REPORT (Commitment of Traders)
EUR:
Net Positioning (Non-Commercial): +75,253 → Bullish, but slightly reduced this week (-3,587 longs, +6,814 shorts).
Commercials: Heavily short (550,286 vs 423,456 longs) → Hedging against potential EUR strength.
Open interest change: +8,343 contracts → Higher market participation, active environment.
AUD:
Net Positioning (Non-Commercial): -59,077 → Strong bearish sentiment on AUD.
Commercials: Net long (121,279 vs 61,743 shorts) → Fundamental support for AUD at potential value areas.
Open interest down (-2,607) → Possible position unwinding or rollover.
📊 COT Conclusion: Speculators favor EUR long / AUD short, but commercials are positioned inversely, suggesting a potential reversal point.
📈 2. SEASONALITY
EUR in May:
Generally negative, with average monthly performance over 10y, 15y, and 20y ranging between -0.01% and -0.02%.
Only the 2y curve shows strength (≈+0.0194).
AUD in May:
Mixed performance: 10y and 5y negative, but 2y slightly positive (+0.0083) → sign of recent improvement.
📊 Seasonality Conclusion: Slight edge for AUD thanks to near-term seasonal resilience.
💡 3. SENTIMENT
Retail traders: 84% short on EURAUD.
Average short entry: 1.7002, current price ≈ 1.7491 → many are in drawdown.
High short congestion above 1.74 → Potential short squeeze setup.
📊 Sentiment Conclusion: Environment favors a bullish push to trigger stops and unwind retail shorts.
🧠 4. PRICE ACTION
Price reacted to a major demand zone at 1.7200–1.7350.
Last two weekly candles show compression and accumulation following strong bearish momentum.
Clear liquidity pocket above 1.76–1.77, targeting the 1.79–1.80 zone.
RSI showing recovery from oversold conditions.
📊 Technical Conclusion: Structure suggests rebound or reversal, aligned with sentiment and positioning dynamics.
🔚 STRATEGIC OUTLOOK
Primary Bias: LONG EURAUD (multi-day / swing setup)
🎯 Target: 1.7700 – 1.7920
🛡️ Stop: Below 1.7310 (weekly close under demand zone)
⚠️ Alternative (Scenario B): A clear weekly close below 1.7300 may reactivate the bearish trend toward 1.7200.
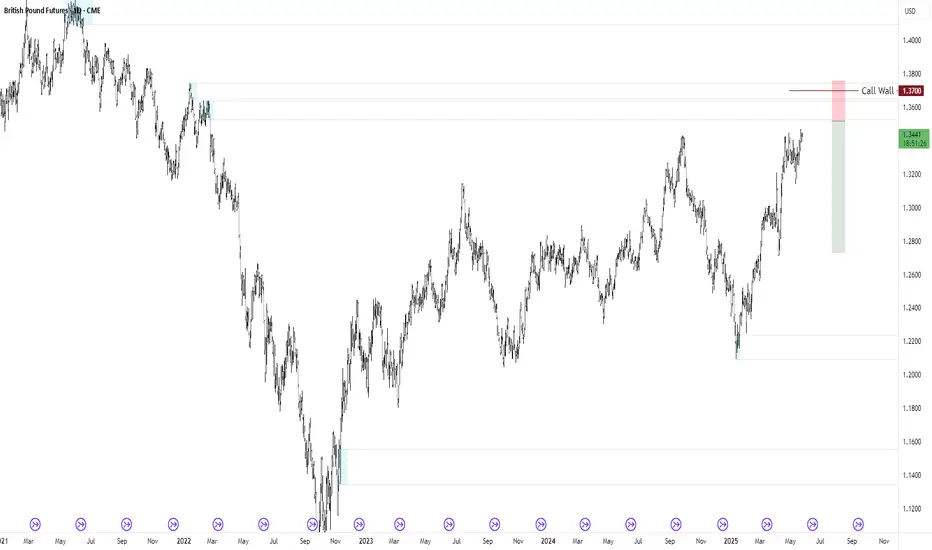
6B Swing Short Swing short, COT - Valuation - Supply and Demand.
Been waiting a long time to short the pound..

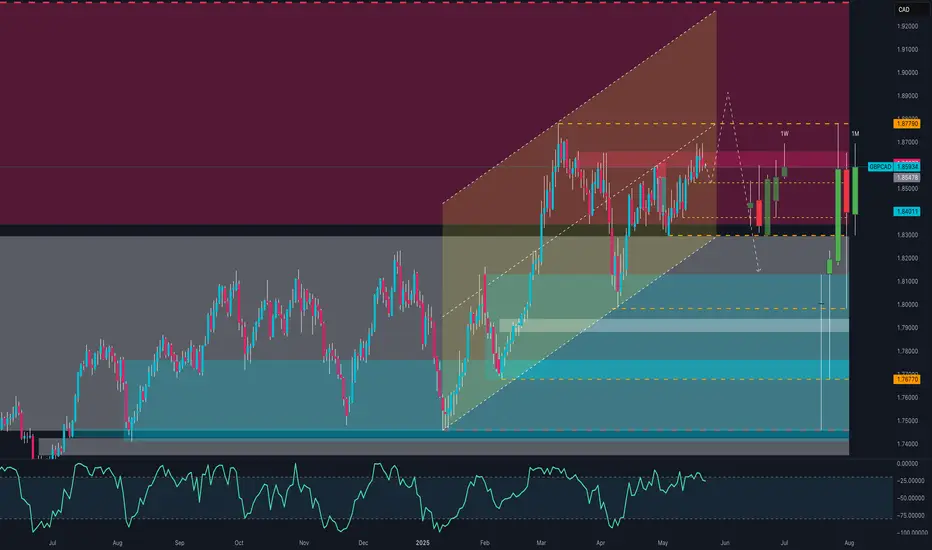
GBP/CAD Poised for Breakout – What’s Next After 1.8600?1. TECHNICAL CONTEXT (Daily Chart)
GBP/CAD has been trading within a well-defined ascending channel since early 2025. After hitting the lower bound of the channel around 1.8050 in May, price bounced sharply and regained strength, pushing back above the key 1.8400–1.8450 zone, now confirmed as new support.
Currently, price is approaching the 1.8600 area, which represents:
The upper boundary of the April–May consolidation range
A clear supply zone visible on the weekly chart
A technical resistance cluster (previous closes + Fibonacci levels)
The RSI shows growing momentum, yet not overbought, suggesting potential upside extension toward 1.8779, the monthly high.
Key Technical Levels:
Resistance: 1.8600 – 1.8779 (extended target)
Support: 1.8401 (weekly) and 1.8250 (mid-range level)
Primary Trend: Bullish
Structure: Active ascending channel
2. INSTITUTIONAL POSITIONING (COT REPORT – May 13, 2025)
CAD:
Non-Commercials (speculators) are heavily net short:
23,250 longs vs 105,466 shorts = -82,216 net
Weekly increase: +18,084 new shorts → clear rise in bearish pressure
Commercials (hedgers) are net long, typical of risk hedging, indicating an opposing view to speculators
GBP:
Non-Commercials are net long:
89,540 longs vs 62,324 shorts = +27,216 net, despite a minor weekly reduction (-4,844)
Commercials are net short, likely hedging strength in the pound
COT Takeaway:
Speculators are clearly favoring GBP strength vs CAD, while CAD is under heavy short pressure. This supports further upside in GBP/CAD.
3. RETAIL SENTIMENT
80% of retail traders are short GBP/CAD, with an average entry at 1.8551
20% long, with average entry at 1.8147
This extreme retail skew represents a contrarian bullish signal: the market may push higher to trigger stop-losses on poorly positioned shorts.
4. SEASONALITY
CAD in May:
Mixed behavior with a slight bearish/neutral tendency on 10y and 2y averages
Monthly average: as low as -0.0097 (10-year data)
GBP in May:
Historically one of the weakest months for the British pound
Average returns range between -0.015 and -0.0226
That said, 2025 appears to diverge from seasonal norms, with GBP showing relative strength across the board.
Seasonality Takeaway:
While seasonality favors CAD over GBP in May, this year’s price action and positioning override that pattern.
TRADING SUMMARY
🔹 Primary Bias: Moderately Bullish
🔹 Technical Outlook: Positive structure above key support at 1.8400
🔹 COT Insight: Supports upside due to aggressive CAD short buildup
🔹 Retail Sentiment: Skewed short → potential short squeeze
🔹 Seasonality: Bearish for GBP, but currently outweighed by fundamentals/positioning
SCENARIOS
📈 Bullish Scenario (preferred):
Break and hold above 1.8600 → acceleration toward 1.8779
Midway target: 1.8670 (psychological level)
Technical stop: Below 1.8400 (or trailing SL on breakout)
📉 Corrective Scenario:
Failure at 1.8600 → pullback to 1.8401 (bullish retest)
Deeper weakness only confirmed on break below 1.8250, which would invalidate the ascending channel
CONCLUSION
GBP/CAD is in a structurally bullish setup, backed by speculative favor toward GBP and an extreme short bias on CAD. Despite the unfavorable seasonality for GBP, the technical trend and positioning data justify a bullish outlook with a target at 1.8779, contingent on a confirmed break above 1.8600.
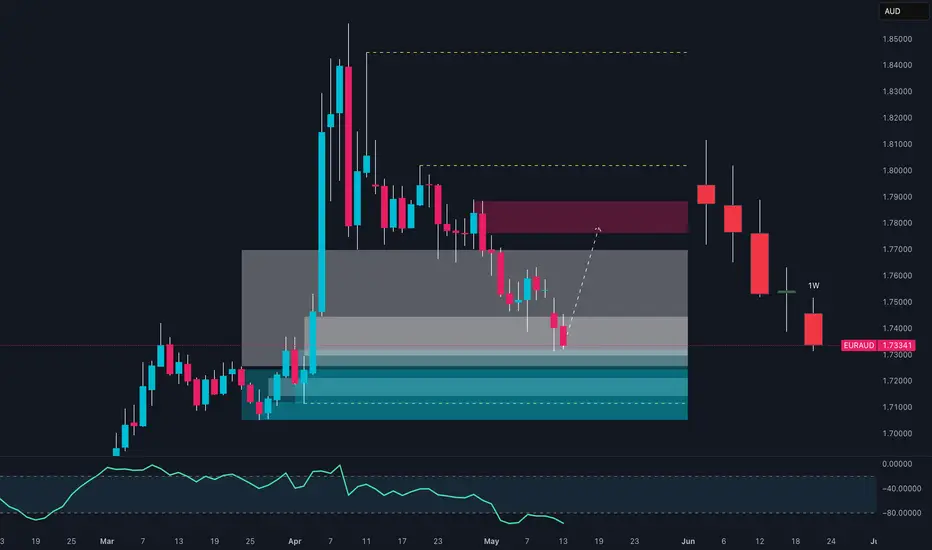
EUR/AUD: Rebound or Continuation of the Drop?EUR/AUD is in a critical situation after a strong bearish trend that pushed the price into a key support area. Analyzing the daily chart, we can observe that the price is testing a strong demand zone, highlighted in blue, from which a potential rebound towards the upper supply zone (in red) could emerge.
The retail sentiment confirms strong short pressure, with 82% of traders positioned on the downside. This excess pessimism suggests, from a contrarian perspective, a possible rebound. Additionally, the oscillator indicates an oversold condition, reinforcing the hypothesis of a correction.
From an institutional point of view, the COT data shows a slight reduction in long positions for both EUR and AUD, but with one detail: speculators remain predominantly long on EUR and short on AUD. Meanwhile, hedgers continue to protect themselves against a possible decline in the euro, demonstrating caution.
In terms of seasonality, May has historically been a weak month for both currencies, but in the last two years, EUR has shown a slight recovery, while AUD has demonstrated signs of stability.
Trading Strategy:
Monitor the reaction to the support zone carefully. A bullish signal in this area could pave the way for a rebound towards the upper resistance. However, a bearish breakout would confirm the ongoing downward trend.
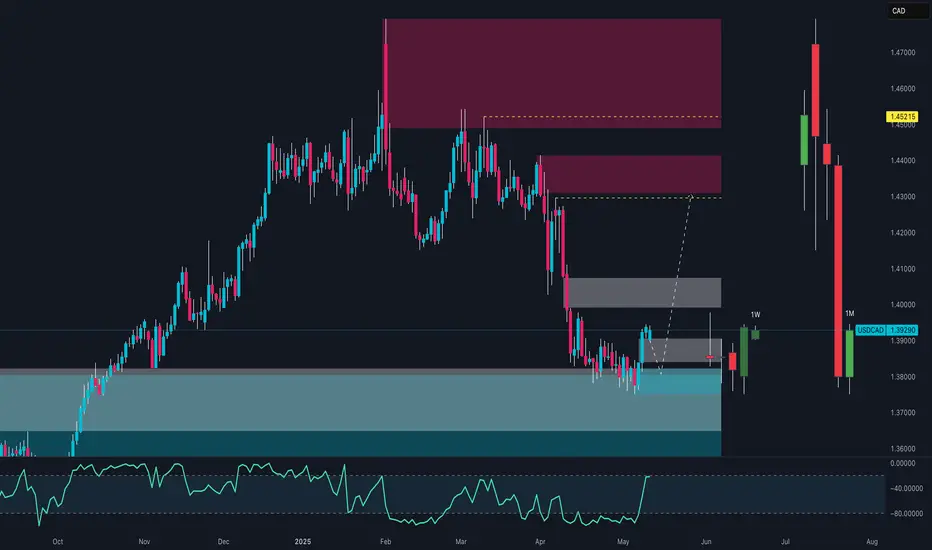
USD/CAD: The US Dollar in a Trap! Ready for a Rebound?Technical Overview:
The monthly chart of USD/CAD shows a weakening phase of the US dollar against the Canadian dollar. Currently, the price is located at a key support zone around 1.3800. The RSI suggests a potential technical rebound, but the bearish structure remains intact until the resistance at 1.4000 is broken.
Seasonality:
According to seasonal trend data, the month of May historically shows a slightly positive trend for USD/CAD:
20 years: +0.0017
15 years: -0.0027
10 years: +0.0014
5 years: +0.0039
2 years: -0.0020
This trend highlights a historical short-term weakness (2 years), while over longer periods, the movement is marginally positive.
COT Report:
COT data shows an increase in long positions on the dollar (+2,158 contracts), while short positions also increased (+2,817 contracts). This suggests uncertainty among institutional traders, with a slight inclination towards short positions.
Market Sentiment:
Data indicates that 65% of retail traders are short on USD/CAD, while only 35% are long. This could signal a potential squeeze if the price breaks above resistance levels.
Operational Conclusion:
Considering the bearish pressure and technical structure, a prudent strategy could include:
Long Entry: Above 1.4000 with confirmation on lower timeframes.
Stop Loss: Below 1.3800 to minimize exposure to false breakouts.
Primary Target: 1.4200, then 1.4400.
Alternative Strategy: If the price rejects the 1.4000 resistance, consider shorting towards 1.3700.
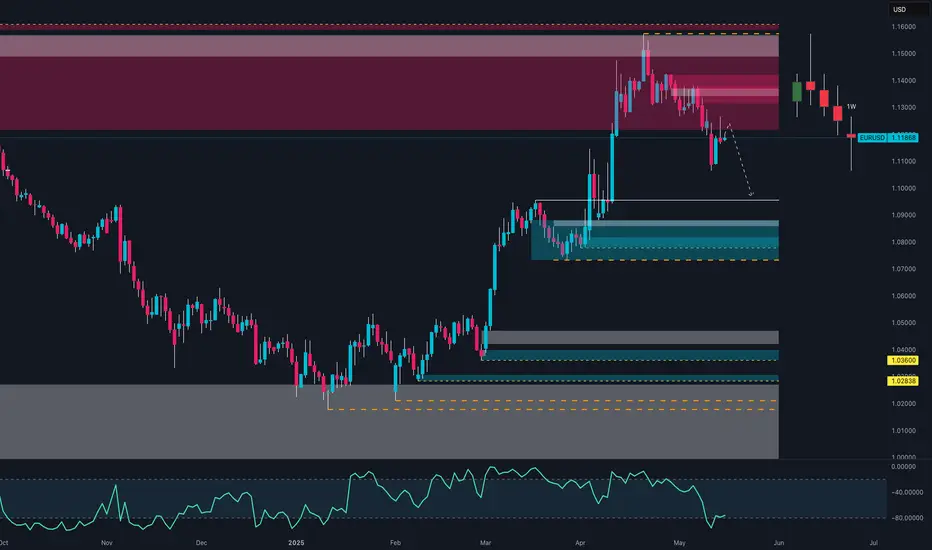
EUR/USD Breakdown in May: Seasonality + Smart MoneyEUR/USD Weekly Outlook – May 15, 2025
EUR/USD is showing clear signs of weakness after a sharp rejection from the key supply zone between 1.1450 and 1.1600. Last week’s candle closed decisively below the 1.1250–1.1300 structure, confirming the failure to sustain bullish momentum. The RSI has also dropped below the 40 level, signaling strong downside pressure.
From an institutional positioning standpoint, non-commercial traders are rebalancing: both longs and shorts on the euro have decreased, while spread positions have increased—suggesting hesitation and a lack of clear conviction. On the other hand, commercials remain heavily long on the euro, but this appears to be more of a hedging move than a directional bias. The US dollar is regaining strength, with new long positions added by speculative traders, aligning with the recent EUR/USD decline.
Retail sentiment shows that a majority of traders are short, but not in extreme proportions. There’s a heavy cluster of long orders between 1.1100 and 1.1050, likely serving as liquidity targets for further downside movement.
From a seasonal perspective, May is historically bearish for EUR/USD. All major seasonal timeframes (5y, 10y, 15y, 20y) point to consistent average negative performance in this month. The current 2025 trend aligns perfectly with this historical pattern, providing a statistical tailwind to the bearish thesis.
Macro-wise, today’s key US data releases—PPI and Retail Sales—could significantly impact the USD. A positive surprise would further strengthen the dollar, adding downward pressure on the pair. Market attention is also focused on Fed Chair Powell's speech later today, which could add fuel to the current move.
Conclusion: The macro, technical, sentiment, and seasonal frameworks all converge on a bearish continuation for EUR/USD. A weekly close below 1.1175 would confirm the downside extension, targeting the 1.0850–1.0700 demand zone. A break above 1.1330 would temporarily invalidate the bearish setup.
GBP/USD Bulls Are Back? Institutions Are Loading Up1. Price Action & Zone Mapping
GBP/USD is consolidating above 1.3300 after a strong bullish reaction near the demand zone between 1.3040 and 1.3150 — an area that has already rejected price twice in recent months.
While the market structure still shows lower highs, the weekly candlestick formation signals a clear loss of bearish momentum. On the upside, the 1.3500–1.3600 zone remains the key supply area to break for a structural reversal to be confirmed.
2. COT Report – Institutional Positioning (as of May 6, 2025)
Non-Commercials (speculators) added +3,320 long positions and reduced -1,956 shorts, bringing the net long to +7,683 contracts — a strong bullish signal.
Commercials remain net short, but not with increasing aggression.
👉 The net positioning supports continued bullish bias, aligned with the recent technical rebound.
3. USD Index – Opposite Positioning
Non-Commercials increased both longs and shorts slightly on the US Dollar Index, but net positioning remains neutral with a slight bearish tilt.
This suggests a phase of indecision or mild retracement in the dollar, which indirectly supports GBP/USD upside.
4. GBP/USD Seasonality – Historical Behavior in May
According to MarketBulls data, May tends to be neutral-to-weak for the pair:
15-year avg: +0.0023
5-year avg: -0.016
2-year avg: +0.0069
Overall, this supports a ranging or corrective phase — not a high-conviction trending month. A breakout may need more confirmation.
5. Retail Sentiment
Currently, 60% of retail traders are short GBP/USD, with an average price of 1.2959, while only 40% are long from 1.3337.
👉 This imbalance favors a contrarian bullish narrative, especially if the market decides to run stops below 1.3300.
✅ Operational Outlook
GBP/USD is showing bullish consolidation signs, backed by:
Increasing institutional long interest
Contrarian retail sentiment (potential fuel for rallies)
Solid demand near 1.3040–1.3150
However, neutral seasonality and lack of structural breakout advise caution. A pullback towards 1.3200–1.3150 might come before any further upside move toward 1.3500.
🔍 Preferred Play: Wait for a retest of 1.3150 with price action confirmation before entering long. A strong breakout above 1.3350 would be early confirmation of renewed bullish pressure.

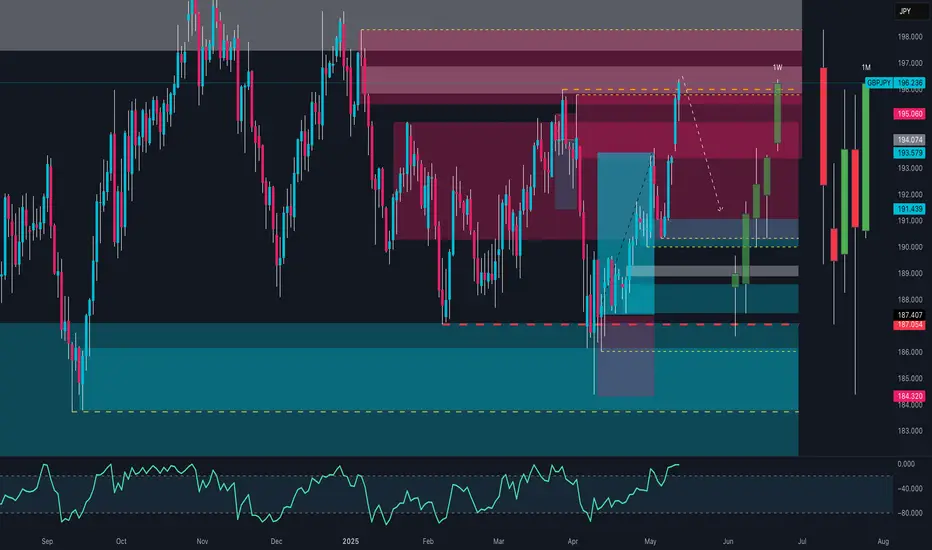
GBP/JPY Breaks Above 196.00! Continuation or Distribution?Detailed Techno-Macro Analysis – GBP/JPY
GBP/JPY has just completed a significant weekly structure breakout, pushing through a key supply zone between 195.00 and 196.30 — an area that historically acted as strong resistance. The breakout occurred via a high-volatility daily candle that closed above the zone, indicating strong bullish pressure.
🔍 Structure & Price Action
Price action shows higher lows and higher highs: a clearly defined bullish structure.
The breakout originated from an accumulation base, following a false bearish breakout below 188.50 (bull trap).
RSI is around 70 on the daily timeframe → strong momentum, but signs of potential exhaustion.
🧠 Key Zones Identified
Current weekly supply: 195.00 – 196.80 (being tested)
Next resistance: 198.70 – 199.50 (swing high and monthly level)
Immediate support: 194.00 – 192.80 (ideal area for pullback and long setups)
Structural support: 190.50 – 188.80
Invalidation: Daily close below 191.00 → potential reversal signal
📈 Macro & Fundamental Context
🇬🇧 UK Macro Update
Wages rising: +5.5% (above expectations) → could support further monetary tightening
Claimant count increasing → early weakness in the labor market
Mixed data, but wage growth bias favors GBP strength
🇯🇵 JPY Still Weak
BoJ remains ultra-accommodative
Verbal interventions from Japanese officials haven’t yet had structural impact
🪙 Retail Sentiment
70% of retail traders are short GBP/JPY, with an average price of 190.59
Only 30% are long, with an average price of 194.65
➡️ Current price (196.30) is above both → retail squeeze in play. Contrarian setup confirmed.
🧾 COT Report
GBP (Non-Commercial Speculators):
Long: +3,320 contracts
Short: -1,956 contracts
➡️ Net long positions increasing → favorable institutional exposure
JPY:
Mixed positions, with increases in both long and short → institutional neutrality on the yen
📅 Seasonality – GBP/JPY
May is historically bearish on both 5Y and 20Y timeframes:
5Y: -2.52%
20Y: -0.43%
Only the 2Y pattern shows a positive return
➡️ Negative seasonality vs. bullish technical structure → conflict worth watching
🔍 Execution Summary
The bullish breakout is strong and supported by sentiment and institutional positioning, but price is now entering a potential distribution zone, where profit-taking could increase.
👉 Main scenario: technical pullback toward 194.00–192.80 for possible long entries, targeting 198.50–199.50
👉 Alternative scenario: daily close below 191.00 → bias reversal and bearish continuation
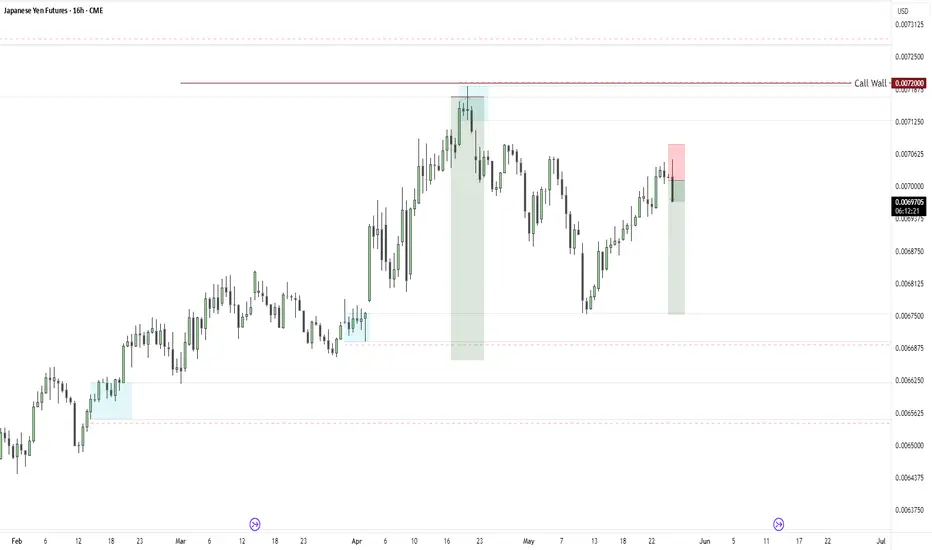
The Yen’s Comeback Starts Here—and it Seems the COT Knew First1. Introduction: A Market Everyone Gave Up On
For a while, the Japanese Yen looked like a lost cause. After topping out in early 2021, Yen futures (6J1!) began an unrelenting slide, shedding value week after week like an old coat in spring. Traders stopped asking, “Where’s support?” and started asking, “How low can it go?”
The macro backdrop didn’t help. The Bank of Japan clung to ultra-loose monetary policy, even as the Fed hiked aggressively. Speculators piled on shorts. The Yen was a one-way ticket down, and no one seemed interested in punching the brakes.
But beneath that apathy, a quieter shift was underway. While price kept bleeding, trader positioning began to hint at something different—something the chart didn’t show yet. And if you were watching the Commitments of Traders (COT) report closely enough, you might’ve seen it.
2. The COT Trend That No One Was Watching
The COT report isn’t glamorous. It’s slow, lagging by a few days, and rarely makes headlines. But for those who track what the big players are doing—those large enough to be required to report their positions—it’s a treasure trove of subtle clues.
One of those clues is Total Reportable Positions. This metric tells us how active large market participants really are—regardless of whether they’re long or short. When that number is dropping, it suggests the “big dogs” are losing interest. When it starts climbing again? Someone’s gearing up to play.
From 2021 through most of 2024, Total Reportable Positions in 6J were in a steady decline—mirroring the slow death of the Yen's bullish case. But in late 2024, something changed. Using a simple linear regression channel on this COT data, a clear breakout emerged. Positioning was picking up again—for the first time in nearly three years.
And it wasn’t just a bounce. It was a structural shift.
3. Did Price Listen?
Yes—and no. Price didn't immediately explode higher. But the structure began to change. The market stopped making new lows. Weekly closes began to cluster above support. And importantly, a Zig Zag analysis started marking a pattern of higher lows—the first signs of accumulation.
Here’s where the chart really gets interesting: the timing of the COT breakout coincided almost perfectly with a key UFO support at 0.0065425—a price level that also marked the bottom in COT Traders Total Reportable Longs. This adds a powerful layer of confirmation: institutional orders weren’t just showing up in the data—they were leaving footprints on the chart.
And above? There’s a UFO resistance level at 0.0075395. If the Yen continues to climb, that could be a significant price level where early longs may choose to lighten up.
4. The Contract Behind the Story
Before we go deeper, let’s talk about what you’re actually trading when you pull the trigger on Yen Futures.
The CME Japanese Yen futures (6J) contract represents 12.5 million Japanese Yen, and each tick move—just 0.0000005 per JPY—is worth $6.25. It’s precise, it’s liquid, and for traders who like to build macro positions or take advantage of carry flows, it’s a staple.
As of May 2025, margin requirements hover around ~$3,800 (Always double-check with your broker or clearing firm—these numbers shift from time to time.)
But maybe you’re not managing seven-figure accounts. Maybe you just want to test this setup with more flexibility. That’s where the Micro JPY/USD Futures (MJY) come in.
Contract size: 1/10th the size of 6J
Tick move: 0.000001 per JPY increment = $1.25
Same market structure, tighter margin requirement around ~$380 per contract
Important note: The COT report aggregates positioning across the whole futures market—it doesn’t separate out micro traders from full-size. So yes, the data still applies. And yes, it still matters.
5. Lessons from the Shift
This isn’t about hindsight bias. The value in this setup isn’t that the Yen happened to bounce—it’s how Total Reportable Positions broke trend before price did.
Here are the real takeaways:
COT data may or may not be predictive—but it is insightful. When positioning starts expanding after a long contraction, it often signals renewed interest or risk-taking. That’s tradable information.
Technical support and resistance as well as highs and lows give context. Without them, COT breakouts can feel theoretical. With them, you have real, observable UFO levels where institutions may act—and where you can plan.
6. Watchlist Insights: Where This Might Work Again
You don’t have to wait for another yen setup to apply this framework. The same structure can help you scout for early positioning shifts across the CME product universe.
Here’s a simple filter to start building your own COT watchlist:
✅ Look for markets where:
Price has been in a long, clean downtrend (or uptrend)
Total Reportable Positions are falling—but starting to reverse
A breakout occurs in positioning trend (draw a regression channel and watch for a clean violation)
A key support or resistance lines up with recent extremes in COT positioning
Whether it's crude oil, corn, or euro FX, this template gives you a framework for exploration.
🎯 Want to See More Setups Like This?
We’re just getting started. If this breakdown opened your eyes to new ways of using COT reports, UFO levels, and multi-dimensional trade setups, keep watching this space.
When charting futures, the data provided could be delayed. Traders working with the ticker symbols discussed in this idea may prefer to use CME Group real-time data plan on TradingView: tradingview.sweetlogin.com - This consideration is particularly important for shorter-term traders, whereas it may be less critical for those focused on longer-term trading strategies.
General Disclaimer:
The trade ideas presented herein are solely for illustrative purposes forming a part of a case study intended to demonstrate key principles in risk management within the context of the specific market scenarios discussed. These ideas are not to be interpreted as investment recommendations or financial advice. They do not endorse or promote any specific trading strategies, financial products, or services. The information provided is based on data believed to be reliable; however, its accuracy or completeness cannot be guaranteed. Trading in financial markets involves risks, including the potential loss of principal. Each individual should conduct their own research and consult with professional financial advisors before making any investment decisions. The author or publisher of this content bears no responsibility for any actions taken based on the information provided or for any resultant financial or other losses.
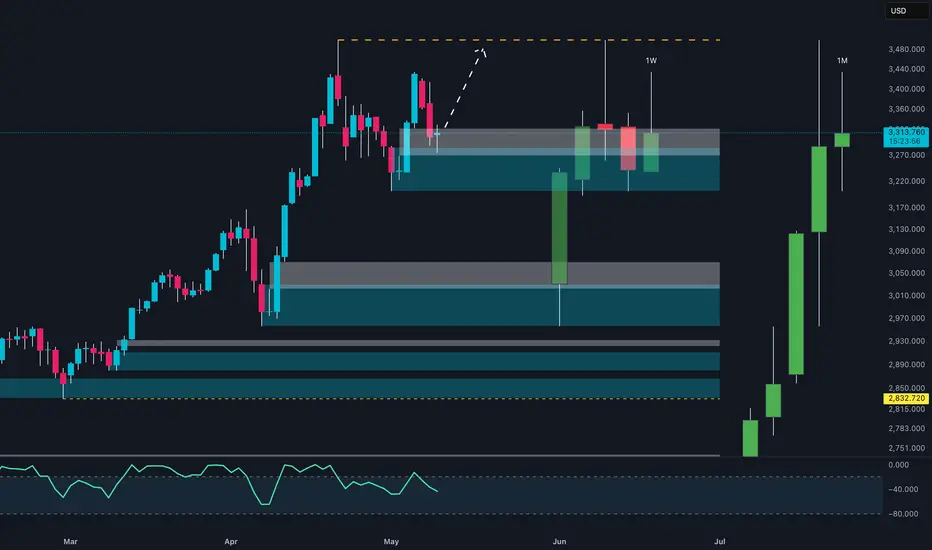
XAU/USD: Institutional Accumulation or New Bearish Impulse?Technical Context:
The graphical analysis shows that the price of gold (XAU/USD) is currently consolidating within a significant demand zone following the recent bullish impulse. The daily chart shows an attempt to bounce off the 3,300 USD zone, a key psychological level.
Volume and COT Analysis:
The latest COT data (April 29, 2025) indicates a slight reduction in long positions by non-commercial operators (-18,519 contracts), balanced by an increase in commercial long positions (+1,659 contracts), signaling potential institutional accumulation.
On the retail sentiment front, traders are slightly more exposed to the downside (51% short vs. 49% long), which could indicate a potential short squeeze if the price resumes an upward trend.
Seasonal Trends:
According to data, May historically shows mixed performances with an average of +9.83% over the last 10 years, but with significant fluctuations between longer and more recent periods.
Key Levels:
Resistance: 3,380 - 3,400 USD (previous distribution zone)
Support: 3,300 USD (current demand zone) and 3,050 USD (secondary support)
Trading Strategy:
Bullish Scenario: Buy above 3,340 USD with a target at 3,400 USD and a stop loss below 3,300 USD.
Bearish Scenario: Sell below 3,300 USD with a target at 3,050 USD and a stop loss above 3,340 USD.