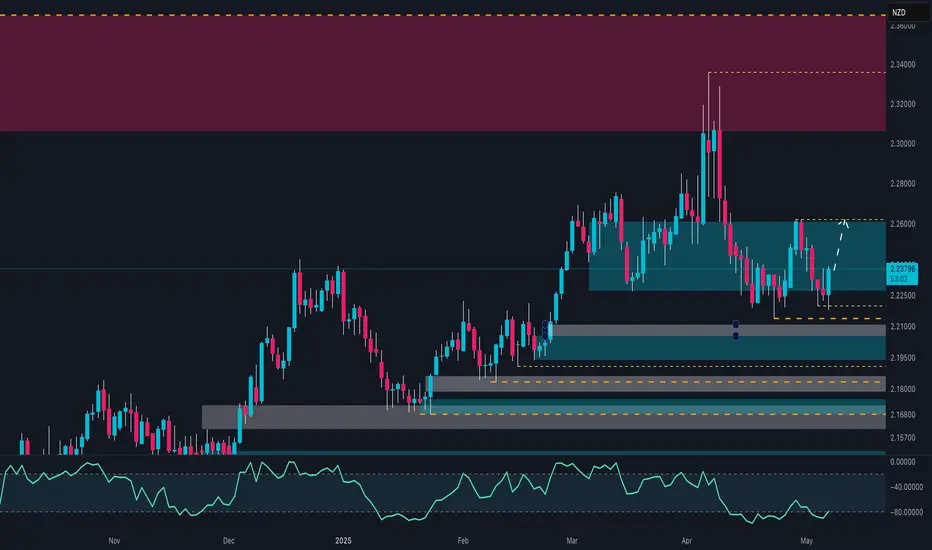
GBPNZD: Support Rebound! Target 2.26 on the Horizon? The weekly chart of GBPNZD shows a consolidation phase following a strong bearish impulse. The price has reacted positively from the support area around 2.2200, forming a significant bullish candle that could indicate a rebound towards the resistance area at 2.2600. The positive momentum suggests a possible test of the intermediate resistance at 2.2500, with the RSI gradually rising from an oversold zone.
Fundamental Analysis
According to the COT data updated as of April 29, 2025, we observe an increase in long positions on GBP by institutional traders, with an increment of +10,665 contracts. On the other hand, commercial traders (hedgers) continue to maintain a significant short exposure on GBP. This imbalance may suggest a potential short-term speculative interest in a bullish GBP move.
Regarding NZD, the latest COT report shows a significant increase in commercial long positions (+3,884 contracts), indicating a strengthening of the New Zealand dollar. However, the overall market sentiment shows a prevalence of short positions on GBPNZD (59% short vs. 41% long), suggesting that retail traders might be on the wrong side of the market.
Seasonal Analysis
Historically, in May, GBP tends to show weakness (-0.0076 over the last 20 years), while NZD does not show a clear seasonal pattern. This could reduce the likelihood of a decisive GBP movement during this month.
Operational Strategy
The rebound from 2.2200 could favor the opening of long positions with the first target at 2.2500 and the second target at 2.2600. The stop loss could be placed below the key support at 2.2100. In case of a resistance breakout, an extension towards the 2.2700 area would be plausible.
COT
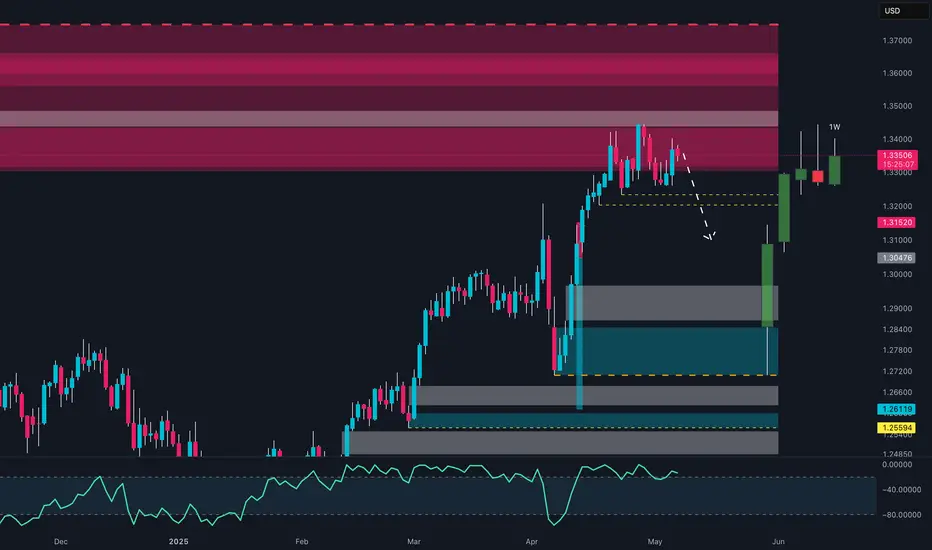
GBP/USD: Is the Bullish Impulse Over?The daily chart shows a significant bullish impulse that encountered strong resistance in the 1.3350 - 1.3400 area, where multiple supply levels and an important institutional selling zone are located. The bearish structure remains intact below this level, suggesting a potential decline towards the key support at 1.3100 - 1.3150. The short bias strengthens with the confirmation of resistance and the formation of a potential reversal.
COT Report (USD Index and GBP/USD)
USD Index: Non-commercial traders are slightly increasing long positions (+397) while reducing short positions (-128). This suggests a potential recovery of dollar strength, supporting a bearish move on GBP/USD.
GBP/USD: Non-commercials have significantly increased short positions (+6,426) and reduced long positions (-2,957), indicating a bearish sentiment. Commercials also show a slight increase in short positions (+5,070), confirming potential weakness in the pound.
Retail Sentiment
57% of retail traders are short on GBP/USD, with an average price of 1.2916, while 43% are long at 1.3343. This imbalance could indicate a market attempt to capture stops above recent highs before a reversal.
Seasonality
Historically, the month of May shows a negative performance for GBP/USD. The 5, 10, and 15-year seasonal data indicate a consistent decline during this period, supporting the hypothesis of bearish pressure.
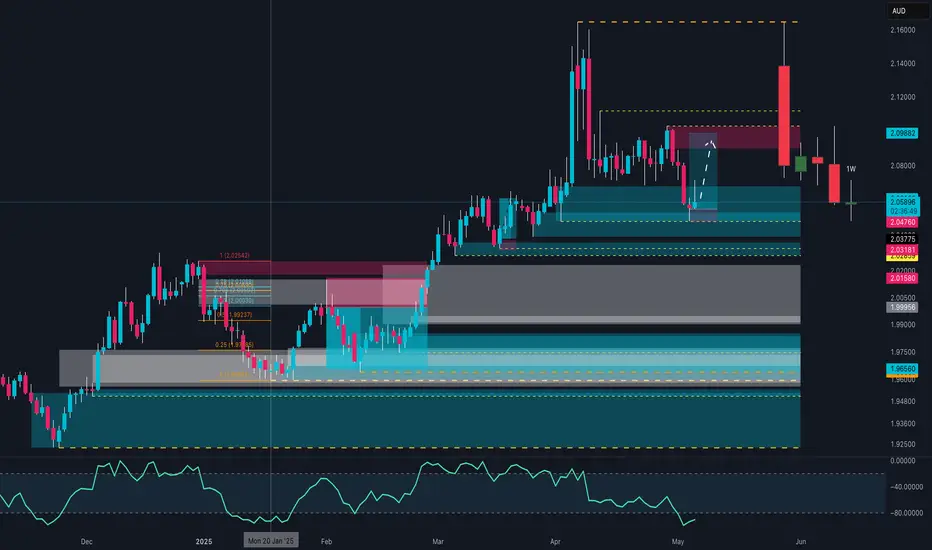
They Were 84% Short — Here's What Happened Next on GBPAUDThis is not just a simple breakout — this is what happens when data, price action, and psychology align with surgical precision.
Today, we entered a long position on GBPAUD directly from a well-defined weekly demand zone. The setup was already technically solid, but what made it exceptional was the alignment of multiple institutional-grade factors:
✅ Weekly demand zone respected to the pip, with proven historical sensitivity
✅ Change of structure on the H1 chart, confirming a short-term reversal from a deeply discounted area
✅ COT data showing a clear build-up of commercial long positions on the British pound
✅ AUD net positioning deep in negative territory, with declining open interest and no signs of reversal
✅ Retail sentiment: 84% of traders short on GBPAUD according to MyFxBook → strong contrarian signal
✅ Seasonality: GBP tends to outperform AUD during May and June
The result? A rapid and aggressive bullish impulse that allowed us to move the stop loss to break-even just a few hours after entry.
📌 Current trade status:
➤ Long from the demand zone
➤ SL at BE = zero risk
➤ Monitoring price action above 2.07 for potential continuation
🎯 Mid-term target zone: 2.1150–2.1300, with focus on liquidity clusters and previous inefficiencies as potential magnets.
This is how you build trades that are not just reactive, but proactive — based on multiple layers of confluence and edge, not on emotions or noise.
GOLD - Smart Money Selling, Retail Chasing Longs📉 Technical Context:
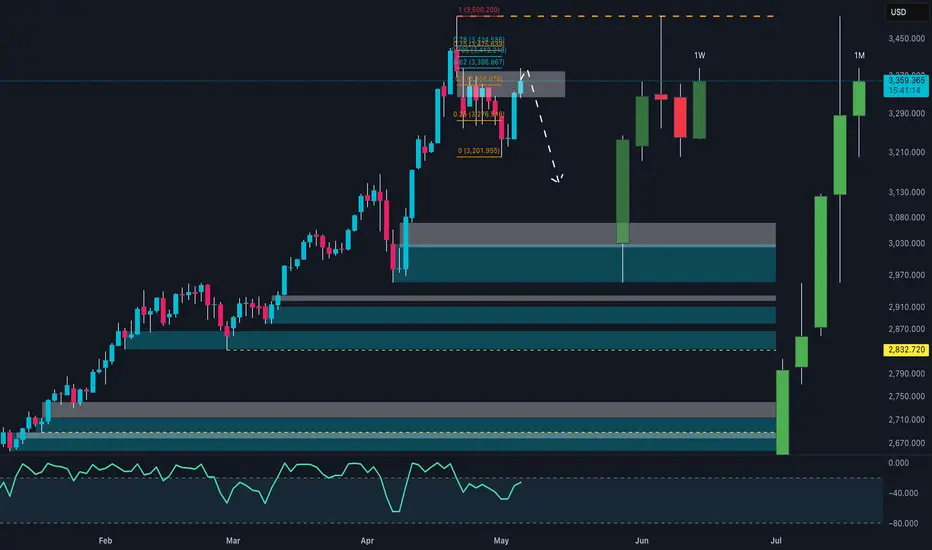
Price has reacted precisely to the 0.618–0.786 Fibonacci retracement zone between 3,386–3,442 USD, aligning with a clear weekly supply zone and imbalance. The current market structure suggests a potential lower high, with the first target around 3,060 USD, and the second near 2,880–2,900 USD demand.
🧠 COT Report (as of April 29, 2025):
Non-Commercials (speculators) cut 18,519 long contracts, signaling waning bullish conviction.
Commercials (hedgers) increased shorts by +9,848 contracts, maintaining a bearish contrarian stance.
📊 Retail Sentiment (MyFxBook):
65% of retail traders are short from 3,062, while 35% are long from 3,184 — ideal environment for a bull trap before reversal.
📅 Seasonality (Market Bulls):
May is historically weak:
10Y: -9.98%
5Y: -12.21%
Strength historically returns in June/July → a correction before continuation is likely.
✅ Conclusion:
Technical structure, macro context, and positioning all align for a high-probability short.
📍 Entry Zone: 3,420–3,440
🔒 Stop: Above ATH (3,500)
🎯 Targets:
TP1: 3,060
TP2: 2,900
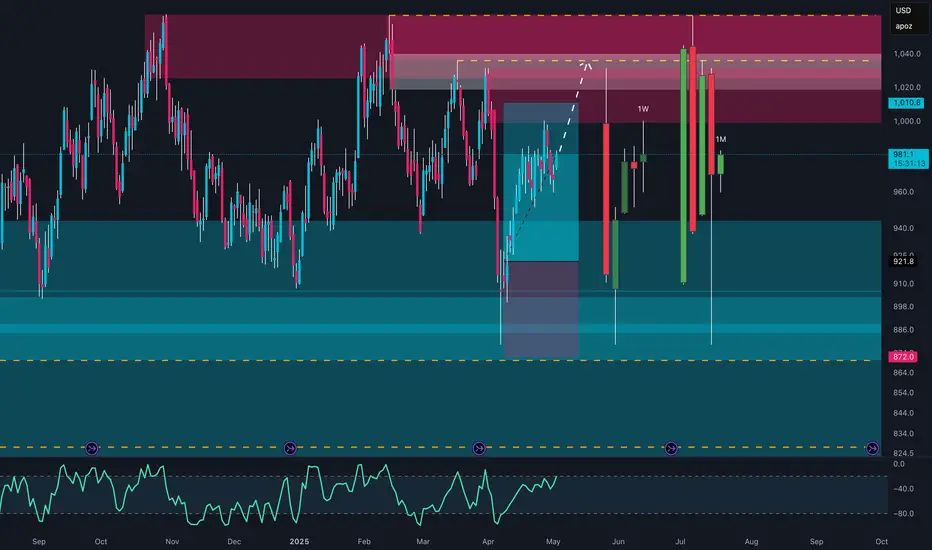
Institutions Are Loading EUR/NZDIn the current market context, EURNZD is showing a highly compelling technical and fundamental structure for both short- and medium-term opportunities. After a prolonged retracement from the March highs, the price has strongly reacted from a clearly defined weekly demand zone between 1.8712 and 1.8600.
From a technical perspective, this reaction aligns with a moderate RSI divergence and a still intact macro bullish market structure, despite the corrective nature of recent weeks.
However, what truly validates this setup goes beyond price action alone. The latest Commitment of Traders (COT) data strongly supports the long thesis. On the euro side, we observe a significant increase in commercial long positions (+14,659 contracts), signaling institutional hedging activity. At the same time, non-commercials (speculators) have been cutting their short positions, suggesting growing expectations of euro strength.
On the NZD side, the picture is even more decisive: non-commercials maintain a net short position of -40,444 contracts, with a further reduction in long positions. The speculative sentiment toward the NZD is clearly bearish and shows no signs of short-term reversal.
Adding to this, retail sentiment data currently shows that 59% of retail traders are short on EURNZD. From a contrarian perspective, this is particularly bullish — the crowd is selling while smart money is buying.
Seasonality also supports the setup: historically, the months of May and June have been positive for the euro and negative for the NZD, adding an additional statistical layer of confluence to the trade idea.
🎯 Conclusion
We may be witnessing the early stages of a new bullish leg on EURNZD. The 1.89 area represents a potential re-entry zone in the event of a retest. The medium-term target is set between 1.9300 and 1.9500.
Technical structure, institutional positioning, retail sentiment, and seasonality all align in favor of a clear bullish bias in the coming weeks.
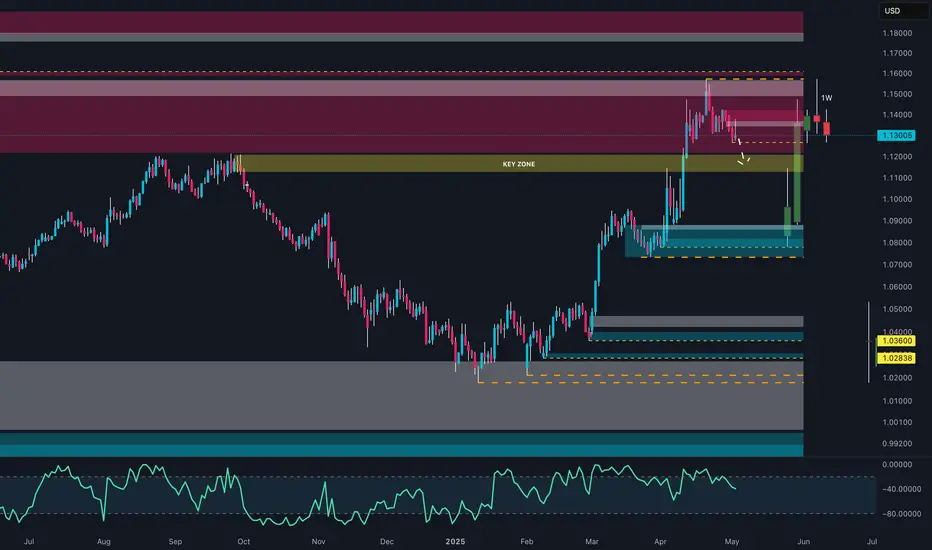
Did They Buy the Bottom? EUR/USD Set for Another Reversal!After an explosive bounce from the 1.0800–1.0850 demand zone, EUR/USD is now in a key structural retest around 1.1300. The COT data shows a net increase in long positions by Non-Commercials, but with the Dollar still holding structural strength in its own COT report and an RSI showing bearish divergence, this area may act as a key zone for price discovery.
📊 WHAT THE DATA SAYS:
📉 Price Action: Clear rejection from the 1.1450–1.1550 supply zone. Retest at key structure near 1.1300.
📑 COT (EURO): Net long positions up by +183 (196,388 long vs 120,591 short) = bullish tone.
📑 COT (USD): Still balanced, but Non-Commercials are reducing net longs → potential weakening.
📊 Retail Sentiment (MyFXBook): 70% retail traders are short = contrarian long bias remains.
🌱 Seasonality (May): Historically negative for EUR/USD (–0.0088) = potential downside pressure ahead.
📌 Key Levels:
Resistance: 1.1450 / 1.1550 (Supply Zone)
Support: 1.1300 (Structural retest) — 1.0850 (Strong demand)
📉 BASE SCENARIO: Pullback toward 1.1100–1.1050 before renewed long accumulation.
📈 ALTERNATIVE SCENARIO: Break above 1.1450 could target 1.1600–1.1720 zone.
🔍 Watch out for May's seasonal inversion and extreme speculative positioning — fakeouts may precede real directional moves.
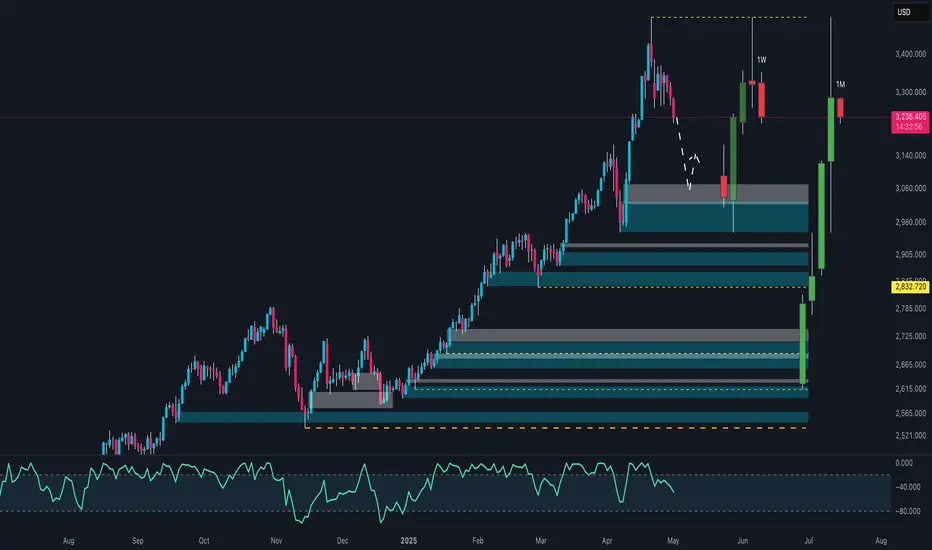
Is Platinum About to Explode? Imminent Rally!Platinum (PL1!) is currently in a technically and macroeconomically compelling setup. After a prolonged consolidation between 872–921, price has reacted strongly, forming a clear accumulation pattern supported by institutional positioning and favorable seasonality.
📈 1. Technical Analysis: Accumulation and Potential Breakout
The weekly chart shows a strong demand zone that has been defended multiple times over the past year. Following a deep pullback in April, price has formed a harmonic compression structure and broke to the upside with conviction. The area between 1010 and 1040 stands out as the first major historical supply zone — previously rejected but now looking increasingly vulnerable.
📉 2. COT Report: Institutions Repositioning Long
The COT data as of April 22 shows a clear increase in long positions from commercial traders (+1,177 contracts), while non-commercials maintain a net long bias. Total open interest rose by over 1,500 contracts — a strong sign of renewed speculative interest in Platinum.
✅ Conclusion
Platinum is showing strong confluence across technicals, institutional positioning, and historical seasonal behavior. The probability of a bullish extension in Q2 2025 is high. This is a setup worth watching closely in the coming days.
Gold Trapped? Everyone’s Long… But Price is Going Down!Gold (XAU/USD) is showing signs of exhaustion after its explosive rally that pushed it beyond $3,400. We are now witnessing a pullback phase, with price directly testing a key demand zone between $3,050 and $2,980. From a technical standpoint, this is the last major defense before a potential drop toward the $2,832 area.
The current bearish pressure is supported by a powerful blend of macro, positioning, and behavioral factors:
COT Report – Gold: Non-commercials (speculators) are aggressively closing long positions and opening shorts, which signals a breakdown in the short-term bullish narrative. On the other hand, commercials (hedgers), also known as the "smart money", are steadily increasing their long exposure, hinting at a potential accumulation zone forming.
COT Report – USD Index: Speculative funds are stacking long positions on the dollar, which continues to add downside pressure on gold. As long as this persists, any upside attempt on XAU/USD will likely face headwinds.
Seasonality: May tends to be historically bullish for gold, but June is seasonally weak. The strongest seasonal window opens between July and August, suggesting the possibility of a deeper pullback before the next bullish wave.
Retail Sentiment: Over 75% of retail traders are long on XAU/USD, typically a contrarian signal. This sets the stage for a classic stop-hunt scenario, where price flushes lower to trigger retail stop-losses before a potential reversal.
📌 Conclusion: In true Bridgewater fashion, we’re seeing a divergence between positioning and price action. In the short term, gold remains vulnerable to a move toward $2,832. However, if that zone holds, it could provide a compelling opportunity to accumulate for a potential summer swing rally toward all-time highs.
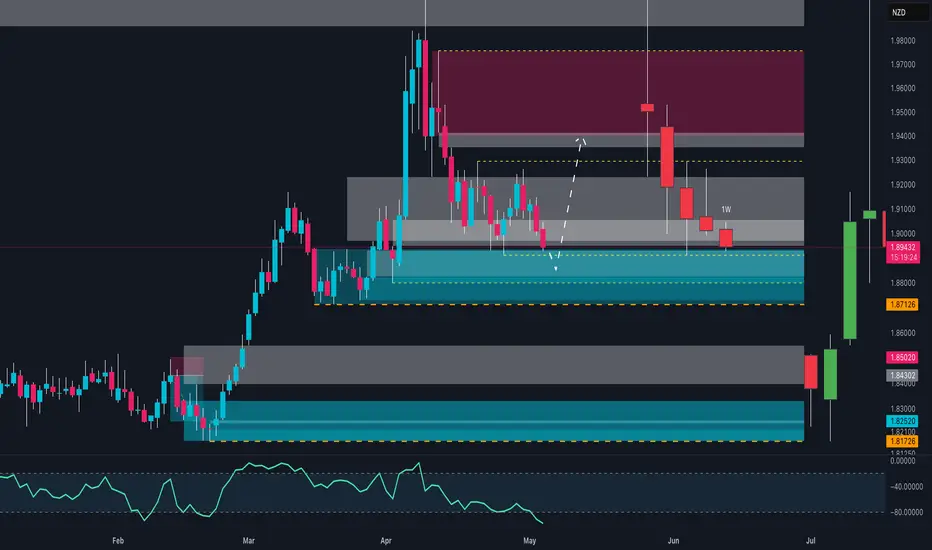
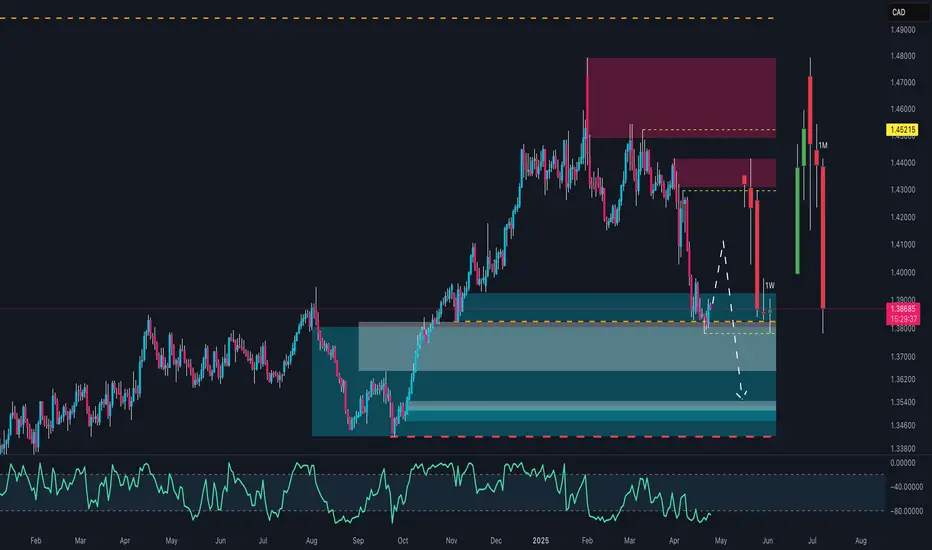
GBP/NZD Breakdown Imminent? Smart Money and Seasonality Say YES!🧠 1. Price Action & Technical Structure
Price was firmly rejected from the monthly supply zone between 2.33 – 2.35, marked by strong bearish candles.
A bounce occurred at the weekly demand between 2.20 – 2.22, where accumulation and a short-term reversal formed (dashed white arrow).
Currently, price is trading near the lower bound of a compression range (2.22 – 2.26), sitting below a key intermediate resistance (dark teal zone).
RSI is in the neutral-to-low zone, with no major divergence, leaving room for further downside.
Technical Bias: Neutral to Bearish unless we get a weekly close above 2.26–2.27.
📊 2. COT Data
GBP
Asset Managers remain net short, though improving since January.
Leveraged Money sharply reducing long exposure since early April → Institutional bullish sentiment weakening.
NZD
Asset Managers have been heavily short for over a year, but shorts are being reduced since February → slight sentiment recovery.
Leveraged Money flat, with no clear long build-up yet.
➡️ Combined COT Outlook: The GBP's advantage over NZD is fading. This supports a sideways to slightly bearish outlook on GBP/NZD.
📅 3. Seasonality
April: Historically bearish for GBP/NZD (–0.2971 avg.), aligning with current downward move.
May: Also typically bearish (–0.2964 avg.) → suggesting potential continued weakness.
➡️ Seasonal Bias: Bearish through mid-to-late May.
🧠 4. Retail Sentiment
Around 70% of retail traders are long GBP/NZD → classic contrarian bearish signal.
Average long entry: 2.1800, current price: 2.2246 → many longs in profit.
Potential for profit taking or breakeven pullback adds to bearish pressure.
📌 Trade Plan Summary
Weekly Bias: → Bearish / Range-bound
📉 Short Zones of Interest:
2.26 – 2.27 → key resistance zone
Stop above 2.2850 (H4/H1 close above invalidates setup)
🎯 Targets:
2.2050 → recent demand re-test
2.1850 / 2.1650 → deeper demand zones visible on chart
🧠 Invalidation Level:
Daily close above 2.2850 → structure turns bullish

USDCAD at Risk? COT Turns Bearish📊 COT Overview – CAD & USD Futures
🇨🇦 Canadian Dollar (CAD)
Asset Managers: Still net short, but recovering fast → from -150K to nearly -50K.
Leveraged Money: Strong bullish reversal from -100K to -30K and climbing.
✅ Interpretation: Institutions are flipping bullish on CAD → Bearish pressure on USDCAD.
🇺🇸 US Dollar (USD)
Asset Managers: Cutting long exposure since March.
Leveraged Money: Losing conviction → neutral to slightly long.
⚠️ Interpretation: USD is structurally weakening → adding to the USDCAD bearish bias.
🧠 Technical Analysis
Price has returned to the key demand zone (1.3700–1.3850) for the third test.
Candles are compressing → signal of upcoming volatility.
RSI remains weak, no bullish divergence → no clear reversal yet.
📌 Key Levels:
Support: 1.3700 → A confirmed break opens space toward 1.3550–1.3480.
Resistance: 1.3950–1.4100
🎯 Trade Scenarios
🔻 Breakdown trade below 1.3700 → Target: 1.3480
🔁 Pullback short on rejection from 1.3950–1.4000 → SL above 1.4100
🔼 Long only with a bullish engulfing weekly close + RSI divergence
✅ Summary
COT Bias: Bearish USDCAD → CAD strengthening, USD weakening
Technical Structure: Support under pressure, breakout likely
Preferred Play: Short continuation on breakdown or pullback rejection
USD/JPY in Free Fall: What’s Behind the Break Below 140?🔍 Technical Analysis – USD/JPY
The weekly chart shows a sharp rejection in the macro zone between 155–158, where strong supply is present (highlighted in red). After brushing historical highs, USD/JPY experienced a vertical drop down to 140, decisively breaking through the key zone at 148–146.
Price has now broken the weekly structure and is approaching an area that previously triggered significant rallies (blue zone between 138–141). Monthly support is in danger, with the RSI deeply in oversold territory, but no clear reversal signals just yet.
📊 COT Report – USD Index
Asset Managers: Slight recovery on long positions, but still in neutral territory.
Leverage Money: Increasing net shorts, indicating speculative bets against the dollar.
The divergence between the falling USD Index and speculative positions confirms a growing lack of confidence in the greenback.
📊 COT Report – JPY Futures
Asset Managers: Strong increase in long positions on the yen since December 2024.
Leverage Money: Reinforcing long bias since February 2025.
This confirms that institutional players are accumulating yen, possibly anticipating BoJ interventions or a broader flight-to-safety.
💥 Trade Outlook
USD/JPY is in full bearish breakout mode. If the 140 level breaks decisively, the next technical targets are:
137.00 → historical mid-level support
134.00 → base of the 2023 structure
Keep an eye on the RSI: a bullish divergence with strong volume could trigger a technical rebound. But as long as the overall sentiment remains strongly risk-off, every rally is a selling opportunity.

Trading Smarter, Not Harder: Decoding Institutional MovesThere’s an old saying in trading: “Follow the smart money.” But how do you know where the smart money is going? The answer lies not in guesswork but in data—specifically, the kind of institutional-grade data that most retail traders overlook. If you’re serious about understanding market dynamics, it’s time to dive into the world of **COT (Commitment of Traders) reports** and **options flow data** from the **CME (Chicago Mercantile Exchange)**. These tools are like your personal radar, cutting through the noise to reveal what the big players are doing.
Step 1: Understanding the Big Picture – Why Market Sentiment Matters
Before we zoom into the specifics, let’s start with the basics. Markets are driven by sentiment—the collective mood of participants. When fear dominates, prices fall; when greed takes over, they rise. But here’s the catch: Retail traders often react to sentiment after it’s already priced in. By the time you see a headline screaming “Market Crashes!” or “Record Highs!”, the opportunity has likely passed.
This is where systematic analysis comes in. Instead of relying on emotions or lagging indicators, smart traders use raw data to anticipate shifts in sentiment. And two of the most powerful sources of this data are **COT reports** and **CME options flow**.
Step 2: The Commitment of Traders (COT) Report – Peering Into the Mind of Institutions
The **COT report**, published weekly by the Commodity Futures Trading Commission (CFTC), provides a breakdown of positions held by different types of traders: commercial hedgers, non-commercial speculators (like hedge funds), and small retail traders. Here’s why it’s invaluable:
- **Commercial Hedgers**: These are the “smart money” players—producers and consumers who use futures markets to hedge their risk. For example, a sugar producer might sell futures contracts to lock in prices. Their actions often signal future supply and demand trends.
- **Non-Commercial Speculators**: These are the momentum-driven players who bet on price movements. Tracking their positioning helps identify potential reversals.
- **Small Traders**: Often considered the “dumb money,” their positions frequently coincide with market tops or bottoms.
By systematically analyzing the COT report, you will discover your ability to identify patterns and positioning levels of participants that signal trend reversals or the onset of corrections. Seriously, this will blow your mind! The insights you gain will be so groundbreaking that they will change your trading game forever.
Step 3: Options Flow – Real-Time Insights Into Institutional Activity
While the COT report offers a macro view, **options flow** gives you real-time insights into institutional activity. Directly through CME data feeds, you can track large block trades in options markets. Here’s why this matters:
It will take some time, observation, and comparison with price charts to learn how to uncover insights that lead to trades with a risk-reward ratio of 1:10 or even higher. This isn’t about needing to make options trades; that’s not a requirement. It’s about being able to trade the Forex market much more effectively by using entry points highlighted by options and futures market reports.
For example, over the past few weeks, the USD/JPY pair has been in a downtrend. Long before this happened, major players were accumulating positions in call options on the futures for the yen (which is equivalent to a decline in the yen). We discussed this before the drop occurred (you can easily find those analyses on our page ).
What’s remarkable is that there are many such insights available. For certain instruments (like precious metals and currency pairs), these insights appear with a certain regularity and provide excellent sentiment for opening positions or reversing positions in the opposite direction.
Step 4: Connecting the Dots – From General Trends to Specific Trades
Now that we’ve covered the tools, let’s talk about how to apply them systematically. Imagine you’re analyzing the sugar futures market (a favorite among commodity traders):
1. **Check the COT Report**: In the precious metals market, commercials are often positioned short, hedging against the risk of a decline in the underlying asset's value. When their net position hovers around zero , it typically signals a bullish trend for gold prices in the vast majority of cases.
2. **Analyze Options Flow**: when filtering options by sentiment, there are several key factors to consider:
- Size and value of the option portfolio
- Distance from the central strike (Delta)
- Time to expiration
- Appearance on the rise/fall of the underlying asset
Option portfolios with names such as vertical spread, butterfly, and condor (iVERTICAL SPREAD, IRON FLY/FLY, CONDOR/IRON CONDOR) have predictive sentiment regarding the direction of the asset's price movement. While "naked" options (PUT or CALL options) with above-average volume can signal that the price is encountering a significant obstacle at that level, leading to a potential bounce off that level (support or resistance).
3 **Combine with Retail Positions Analysis**: Look for opportunities to trade against the crowd. If retail sentiment is overwhelmingly bullish, consider a bearish position, and vice versa.
This layered approach ensures you’re not just reacting to headlines but making informed decisions based on valuable data.
Step 5: Why Systematic Analysis Sets You Apart
Here’s the truth: Most traders fail because they rely on intuition rather than evidence. They chase tips, follow social media hype, or get swayed by emotional biases. But markets reward discipline and preparation. By mastering tools like COT reports and options flow, you gain a competitive edge—a deeper understanding market breath! The path of least resistance!
Remember, even seasoned professionals don’t predict every move correctly.However, having a reliable structure allows you to maximize profits from transactions, eliminate noise and unnecessary (questionable) transactions.
Final Thoughts: Your Path to Mastery
If there’s one takeaway from this article, let it be this: The best traders aren’t fortune-tellers; they’re detectives. They piece together clues from multiple sources to form a coherent picture of the market. Start with the big picture (COT reports), zoom into real-time activity (options flow), and then refine your strategy with technical analysis.
So next time you open chart, don’t just look at price. Dive into the reports/data before. Ask questions. Connect the dots. Because in the world of trading, knowledge truly is power.
What’s your experience with COT reports or options flow? Share your thoughts in the comments below—I’d love to hear how you incorporate these tools into your trading routine!
**P.S.** If you found this article helpful, consider bookmarking it for future reference.

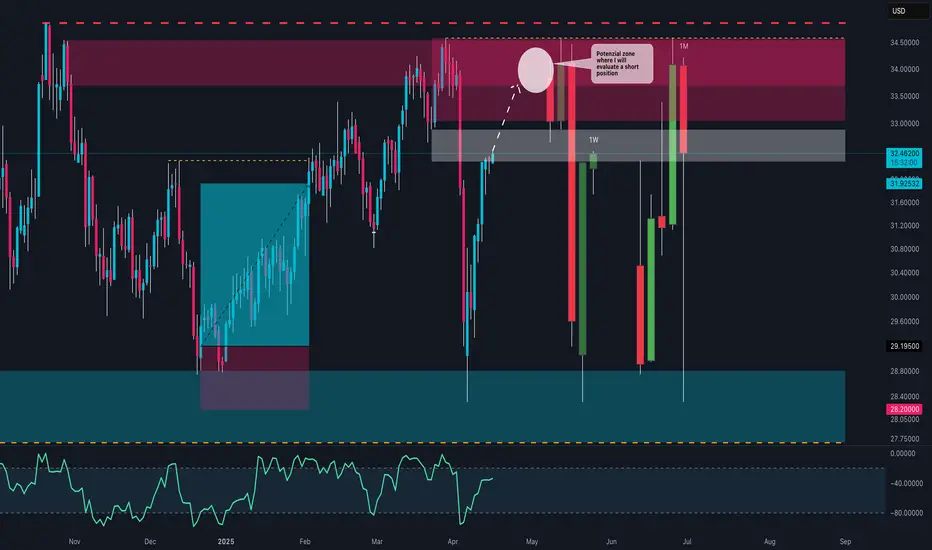
SILVER at a CROSSROADS: Bounce or CRASH to $28?🔹 General Context
Silver has shown a strong bullish reaction from the lows around $28, later reaching a key monthly supply area between $34 and $35. However, this zone has once again been firmly rejected, leaving room for a potential deep retracement.
🟥 Key Zones
🔴 Monthly Supply Zone (34.00 - 35.00 USD): Strong resistance already tested multiple times. Candlesticks show strong rejections and long upper wicks.
🟥 Weekly Supply Zone (33.00 - 34.00 USD): Breaker block or mitigation area that triggered a strong bearish move.
⬛ Current Weekly Support Zone (32.00 - 31.90 USD): Price is currently testing this area. A new impulse could arise here — or we may witness a breakdown.
🟦 Monthly Demand Zone (28.20 - 29.20 USD): The last area defended by buyers in the mid-term. A realistic target in case of breakdown.
📊 Price Structure
The short- to medium-term trend remains bearish, with lower highs and strong rejection candles.
Current price action shows indecision, with lower wicks on recent weekly candles but smaller bullish bodies — a sign of potential accumulation... or just a pullback?
📉 RSI (Relative Strength Index)
RSI is in the neutral-high zone, not yet overbought, but in a downward phase → more room for downside if buyers don’t step in soon.
No clear divergences visible, but watch for signals on the daily timeframe.
🧭 Possible Scenarios
✅ BULLISH Scenario:
Condition: Support holds between 32.50 and 31.90 USD with a clear reversal candle.
Target: Move back toward the supply zone at 33.80 – 34.90 USD.
Confirmation: Break above 33.00 USD with increasing volume.
❌ BEARISH Scenario:
Condition: Weekly close below 31.90 USD → sign of weakness.
Target: Zone between 29.20 – 28.20 USD, a potential new institutional buy area.
Confirmation: Strong bearish break with follow-through and lack of buying reaction.
🧠 Operational Conclusion
Silver is at a critical decision point: bearish pressure from the monthly zones is evident, but as long as the 31.90/32.00 zone holds, buyers may still defend. A clean breakdown would open the door for a drop below $30.
How low Can the Dollar Go? And What It Could Mean for EUR/USDThe US dollar index has handed back all of its Q4 gains with traders betting that Trump's trade war will do more damage than good to the US economy. I update my levels on the US dollar index and EUR/USD charts then wrap up market exposure to USD index futures.

I've Cracked the Bullish Code in Chicago Wheat Using COTZW (Chicago Wheat) is setup for longs based on COT positioning and other fundamental indicators.

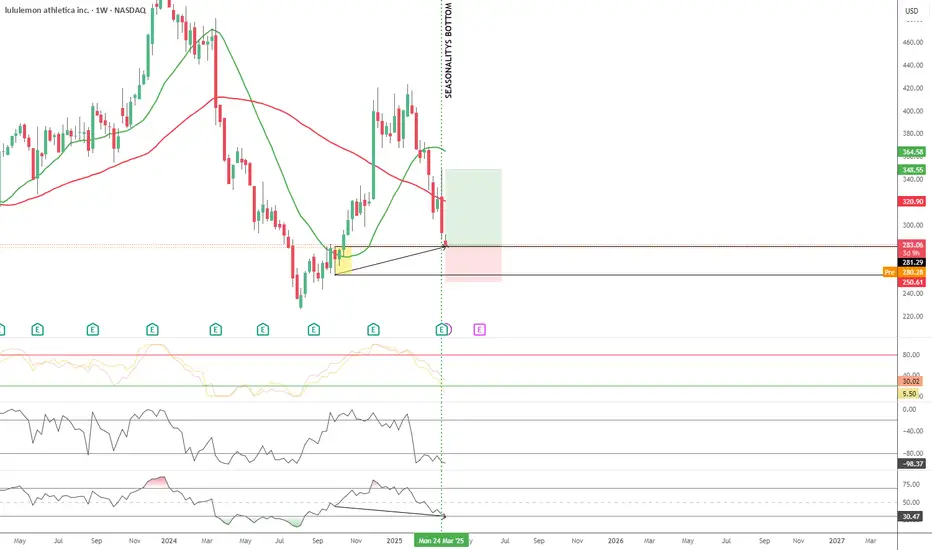
Buy Idea on $LULU (W)Trade based on:
- Seaonalitys, S&D Zone, Divergence on VOIP, RSI, ProGo, Uplslope SMA`s, Undervalued to Gold and Bonds
Not Financial Advice
Ask me anything in the comments.
I Cracked The Bearish Code on Copper Using COTCopper is setup for sells based on fundamental underlying conditions.
We also see confirmations from accumulation measurements, seasonals & cycle analysis.

Bears give the USD a break, EUR/USD pullback may not be overThe retracement higher for the US dollar is finally underway, which also shows further upside potential. And this is why I am wary of being long EUR/USD over the foreseeable future, even if I suspect it is poised to break to new highs in the coming weeks.
Matt Simpson, Market Analyst at City Index and Forex.com

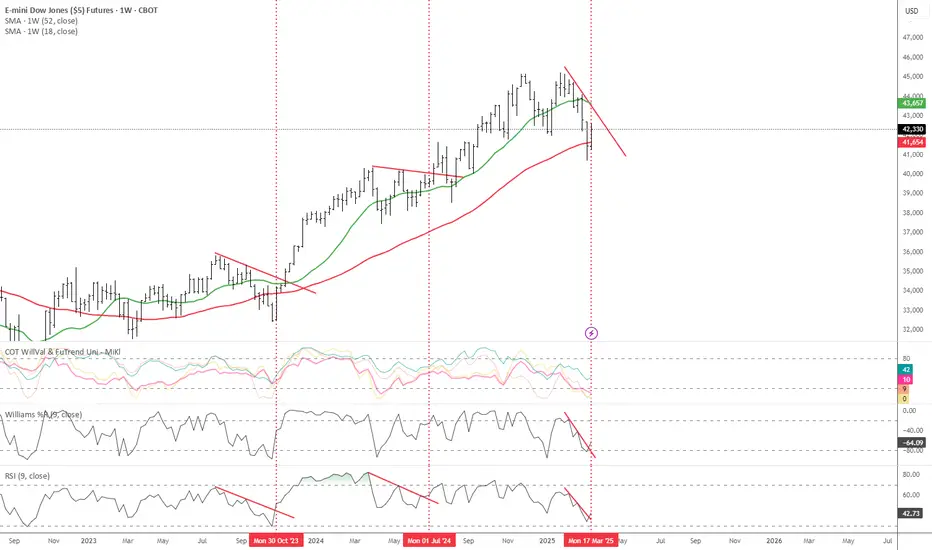
Promising Breakout Setup Ahead! Chart 1W CBOT_MINI:YM1! BLACKBULL:US30
Promising Breakout Setup Ahead!
The chart highlights RSI and Williams %R trendline breakout plays. My strategy? Identify trendlines on the chart, monitor RSI and Williams %R, and target breakouts on these momentum indicators.
Current Situation:
All key signals have already triggered.
Strong bullish seasonality
Favorable COT data (small specs bearish, commercials bullish)
Low open interest
This setup aligns with high-probability breakout criteria.
Chart Indicator
SMA 1W 52 (red)
SMA 1W 18 (green)
Bottom Indicators
WilVal
Williams R% 9 length
RSI 9 length
Not Financial Advice
for more questions ask in the comments or
check my X @valuebuffet
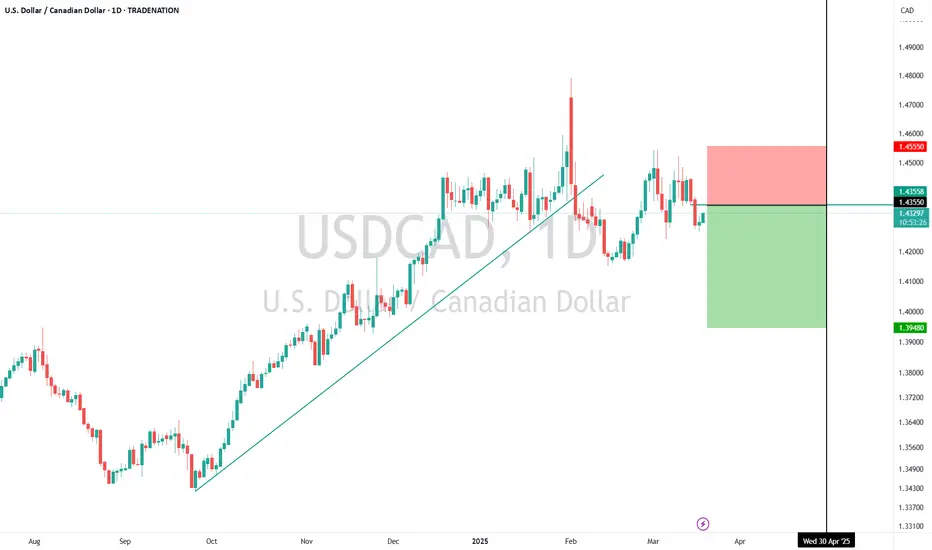
USDCAD Short Setup – Potential Top Formation & Seasonal WeaknessTechnical: USDCAD has stalled in recent weeks, signaling a potential topping pattern. A recent break of the short-term trend suggests a deeper correction may follow. Key resistance is at 1.4355 , offering a favourable risk-reward short opportunity.
Fundamental: The U.S. dollar remains weak, with commercial participants showing little interest in buying. Meanwhile, the Canadian dollar is seeing increased accumulation, indicating a potential shift in momentum.
Seasonal: Historically, from March 24 – April 30 , USDCAD has declined 76.2% of the time over the past 21 years, with an average drop of 1.30%.
Trade Idea:
Sell: 1.4355
Stop Loss: 1.4551
Target: 1.3948
Disclosure: I am part of Trade Nation's Influencer program and receive a monthly fee for using their TradingView charts in my analysis.
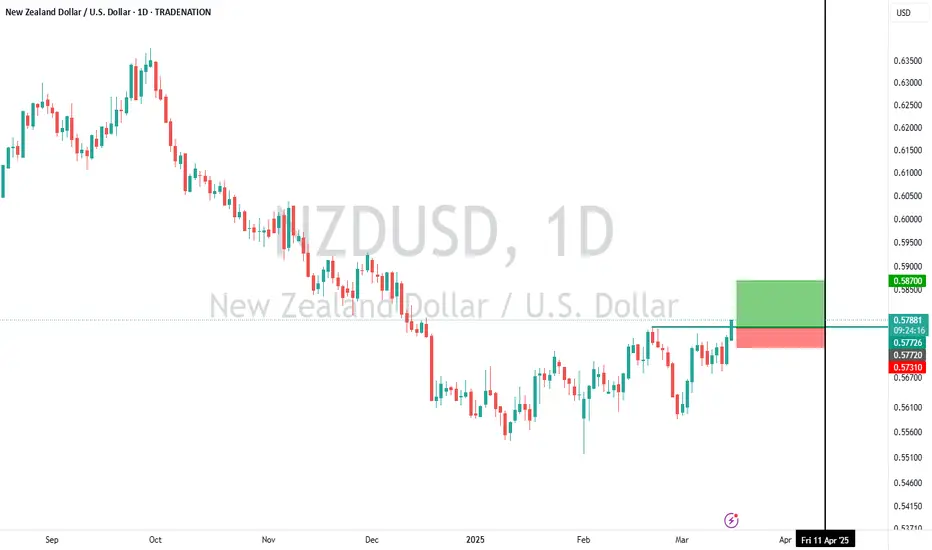
NZD/USD Long Setup – Breakout Confirmation & Smart Money SupportTechnical: NZD/USD has broken above 0.5572 resistance, confirming a bottom. This level should now act as support on any pullbacks. Look to enter between 0.5762 – 0.5572, with an upside target of 0.5870. Place a stop loss at 0.5730 to manage risk.
Fundamental: The U.S. dollar is seeing continued selling pressure from commercial participants, while NZD is being accumulated—suggesting smart money positioning for further upside.
Seasonal: Historically, NZD/USD has risen 66.67% of the time between March 17 – April 12, with an average return of 1.31% over the past 21 years.
Trade Idea:
Entry: 0.5762 – 0.5572
Stop Loss: 0.5730
Target: 0.5870
Disclosure: I am part of Trade Nation's Influencer program and receive a monthly fee for using their TradingView charts in my analysis.
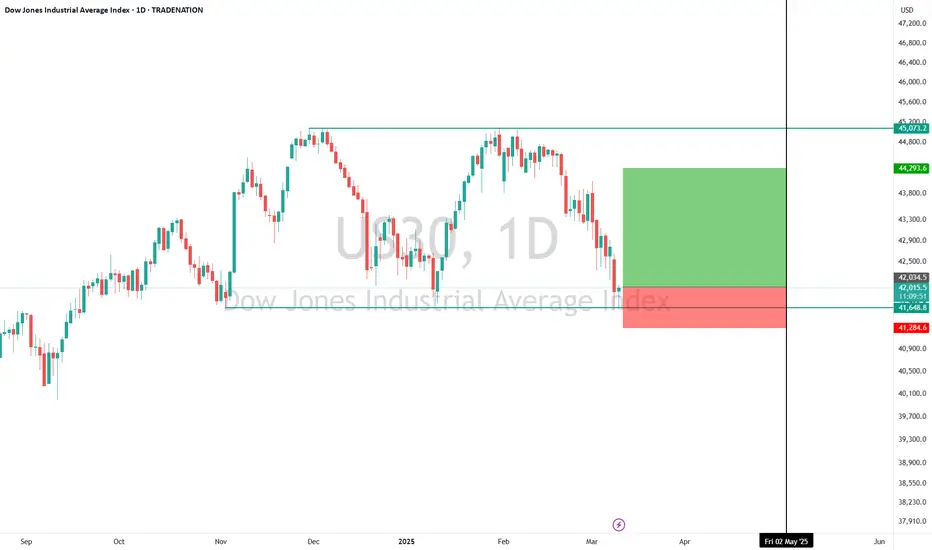
Dow Jones: A Make-or-Break Buy Setup with Smart Money BackingDow Jones Industrial Average - Buy Setup
Technical: U.S. markets have struggled recently due to uncertainty over tariffs imposed by President Trump. While the S&P 500 and NASDAQ have broken key support levels, the Dow remains resilient, holding the critical 41,648 support. A break below would confirm a large double-top pattern, signaling a bearish outlook. This is a pivotal moment. The rebound from overnight lows is encouraging, but with the U.S. CPI release tomorrow, caution is warranted. While speculative, COT and seasonal data favour a short-term move higher.
Fundamental: The latest Commitment of Traders (COT) Report shows increasing long interest in the Dow, suggesting "smart money" accumulation.
Seasonal: Historically, from March 12 – May 2, the Dow has posted gains 84% of the time, averaging +3.68% over the past 25 years.
Setup:
Entry: 41,800 – 42,000
Stop Loss: 41,285 (below the Nov 2024 low at 41,648)
Target: 44,290
Disclosure: I am part of Trade Nation's Influencer program and receive a monthly fee for using their TradingView charts in my analysis.
US Light Crude (WTI) - Buy SetupTechnical Analysis:
The overall trend remains bearish, but the price has stalled at a major support level of 6568.7, corresponding to the September 2024 lows. WTI has been rangebound for several months, with the upper end of the range at 8044.3. Yesterday's Doji candle signals indecision, and today’s early move higher suggests potential upside. While speculative, the risk/reward setup appears attractive.
Fundamental Analysis:
The latest Commitment of Traders (COT) Report indicates increasing long positions in Oil, suggesting that institutional investors ("Smart Money") may be accumulating around current levels.
Seasonal Trends:
Historically, between March 18 – May 21, Oil has delivered positive returns 76.47% of the time, with an average gain of 5.56% over the past 34 years.
Trade Setup:
Entry: 6630 – 6765
Stop Loss: 6462 (below the 2024 low at 6568)
Target: 8044 (upper end of the long-term range)
Disclosure: I am part of Trade Nation's Influencer Program and receive a monthly fee for using their TradingView charts in my analysis.
