COTIUSDT – One Bullet, Not All-InThe blue box looks like a solid area to risk 1R — but let’s keep our feet on the ground.
This isn’t about predicting tops or bottoms. It’s about testing structure with confirmation.
🟦 A single, well-managed attempt is okay — but in case a Q3 correction kicks in, this setup could still get stopped out. So instead of going heavy on leverage, I lean toward spot entries here. Spot buys also good!
All risk-on markets typically experience significant corrections in the third quarter of the year and struggle to recover from this correction until the end of the year.
🧭 Execution Flow
🔔 Alert on the blue box
🕐 Drop to 1H
📈 Look for breakout with rising CDV
✅ One controlled entry — no overexposure.
📌I keep my charts clean and simple because I believe clarity leads to better decisions.
📌My approach is built on years of experience and a solid track record. I don’t claim to know it all but I’m confident in my ability to spot high-probability setups.
📌If you would like to learn how to use the heatmap, cumulative volume delta and volume footprint techniques that I use below to determine very accurate demand regions, you can send me a private message. I help anyone who wants it completely free of charge.
🔑I have a long list of my proven technique below:
🎯 ZENUSDT.P: Patience & Profitability | %230 Reaction from the Sniper Entry
🐶 DOGEUSDT.P: Next Move
🎨 RENDERUSDT.P: Opportunity of the Month
💎 ETHUSDT.P: Where to Retrace
🟢 BNBUSDT.P: Potential Surge
📊 BTC Dominance: Reaction Zone
🌊 WAVESUSDT.P: Demand Zone Potential
🟣 UNIUSDT.P: Long-Term Trade
🔵 XRPUSDT.P: Entry Zones
🔗 LINKUSDT.P: Follow The River
📈 BTCUSDT.P: Two Key Demand Zones
🟩 POLUSDT: Bullish Momentum
🌟 PENDLEUSDT.P: Where Opportunity Meets Precision
🔥 BTCUSDT.P: Liquidation of Highly Leveraged Longs
🌊 SOLUSDT.P: SOL's Dip - Your Opportunity
🐸 1000PEPEUSDT.P: Prime Bounce Zone Unlocked
🚀 ETHUSDT.P: Set to Explode - Don't Miss This Game Changer
🤖 IQUSDT: Smart Plan
⚡️ PONDUSDT: A Trade Not Taken Is Better Than a Losing One
💼 STMXUSDT: 2 Buying Areas
🐢 TURBOUSDT: Buy Zones and Buyer Presence
🌍 ICPUSDT.P: Massive Upside Potential | Check the Trade Update For Seeing Results
🟠 IDEXUSDT: Spot Buy Area | %26 Profit if You Trade with MSB
📌 USUALUSDT: Buyers Are Active + %70 Profit in Total
🌟 FORTHUSDT: Sniper Entry +%26 Reaction
🐳 QKCUSDT: Sniper Entry +%57 Reaction
📊 BTC.D: Retest of Key Area Highly Likely
📊 XNOUSDT %80 Reaction with a Simple Blue Box!
📊 BELUSDT Amazing %120 Reaction!
📊 Simple Red Box, Extraordinary Results
📊 TIAUSDT | Still No Buyers—Maintaining a Bearish Outlook
📊 OGNUSDT | One of Today’s Highest Volume Gainers – +32.44%
📊 TRXUSDT - I Do My Thing Again
📊 FLOKIUSDT - +%100 From Blue Box!
📊 SFP/USDT - Perfect Entry %80 Profit!
📊 AAVEUSDT - WE DID IT AGAIN!
I stopped adding to the list because it's kinda tiring to add 5-10 charts in every move but you can check my profile and see that it goes on..
COTIUSDT

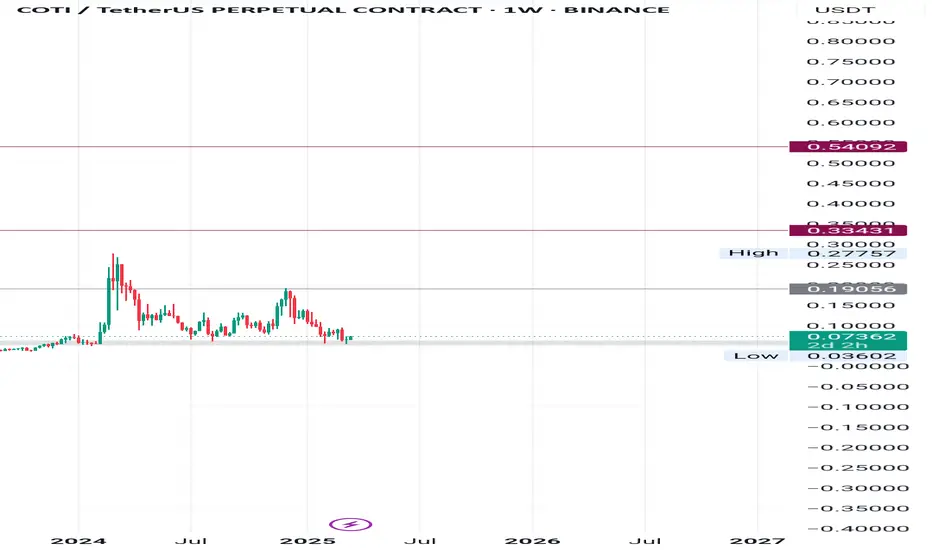
COTIUSDT Weekly Analysis Potential Reversal?📍 Current Price Position – On Top of Historical Support!
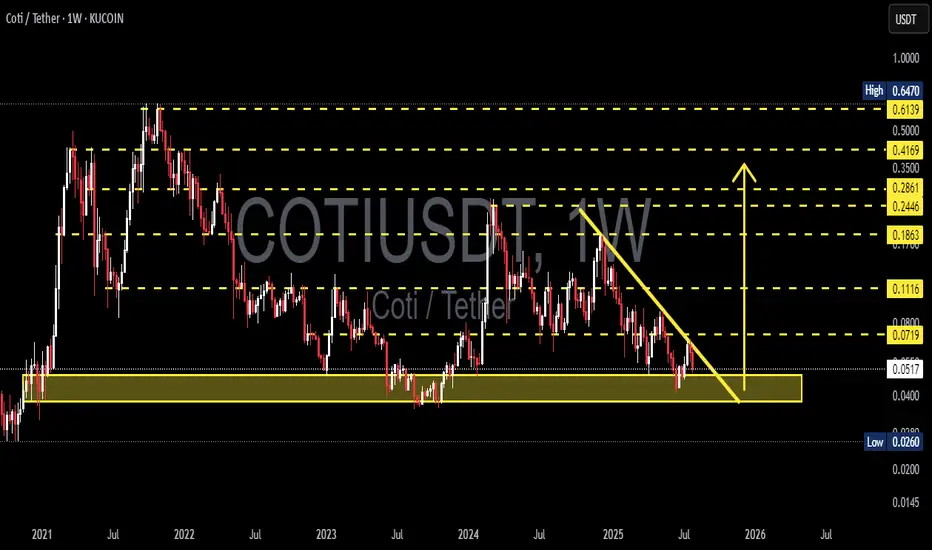
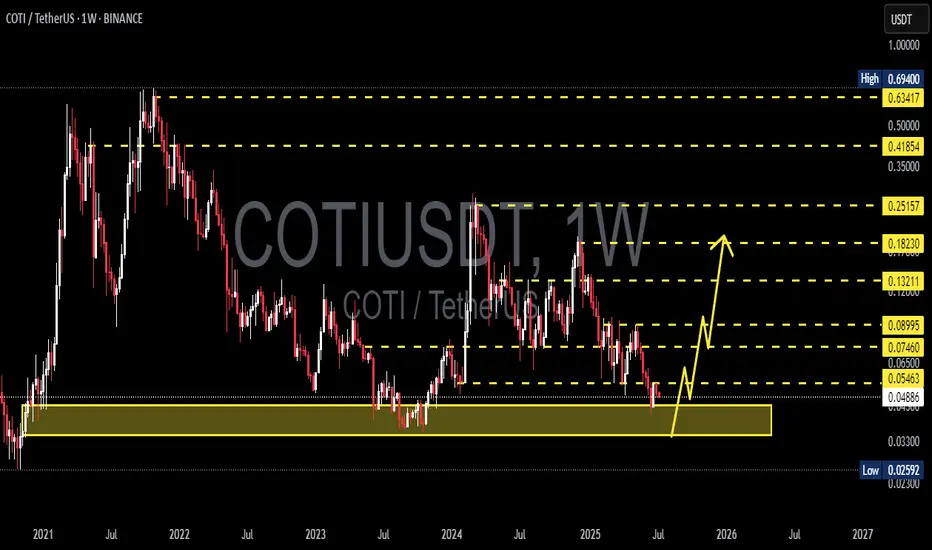
The COTI/USDT pair is currently testing a crucial support zone between $0.0400 – $0.0517, which has been a key demand zone since early 2021. This isn't just any support — it's a macro psychological area that has repeatedly triggered strong reversals in the past.
We are at a make-or-break level, where the next move could define the mid-term trend.
---
🧩 Price Structure and Pattern
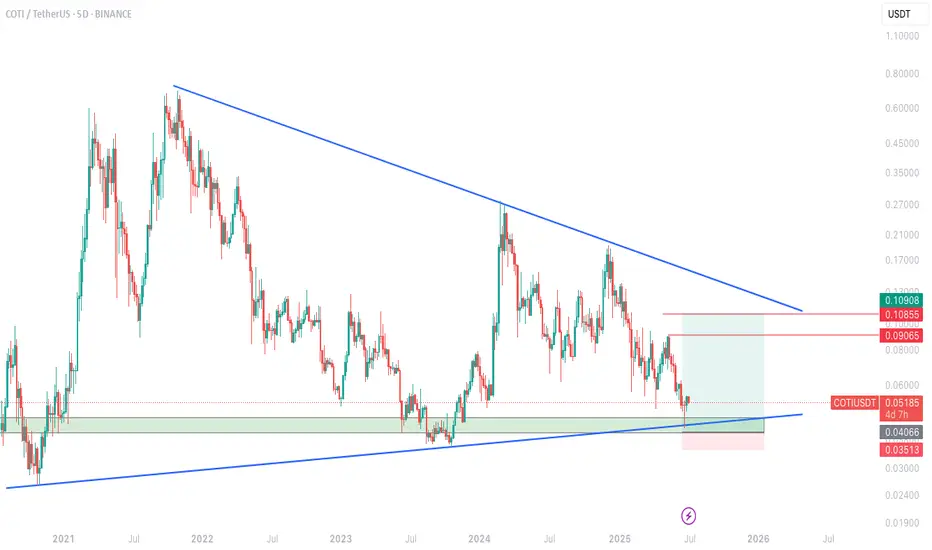
📐 The chart shows a descending triangle pattern with:
Consistently lower highs (marked by the downward yellow trendline),
Flat horizontal base around the major support zone.
This pattern can result in:
A powerful breakout if the trendline is broken, or
A sharp breakdown if the horizontal support fails.
---
📈 Bullish Scenario: Reversal Momentum Building?
If price:
Breaks above the descending trendline (~$0.0719), and
Closes a weekly candle above that resistance zone,
➡️ We could see a breakout move with targets at:
Resistance Level Target
Initial Target $0.1116
Mid-Term Target $0.1863
Strong Zone $0.2446 – $0.2861
Long-Term Bullish $0.35 – $0.4169
📌 A confirmed higher high and higher low structure above $0.11 would strengthen the bullish case.
---
📉 Bearish Scenario: Breakdown from Support
If:
Price fails to hold the $0.0517 – $0.0400 support area,
and prints a weekly close below this zone,
➡️ The next bearish targets could be:
Support Level Target
First Support $0.0260
Psychological Level $0.0200
Extreme Panic Zone $0.0150 – $0.0100
⚠️ This would indicate a capitulation phase, likely to trigger panic selling and deeper lows.
---
🧠 Strategy Notes for Traders
✅ For Position Traders:
The $0.040 – $0.0517 area is a prime watch zone for reversal setups with tight stop-loss below $0.040.
Excellent Risk:Reward potential if reversal confirms.
✅ For Swing Traders:
Breakout above the trendline offers a solid entry signal.
Targets up to $0.1863 look achievable with strong volume.
✅ For Conservative Traders:
Wait for breakout + retest confirmation before entering.
Avoid FOMO — let the weekly candle close guide your decision.
---
⚡️ Final Takeaway
> COTI/USDT is at a tipping point!
This long-standing support is the last line of defense for the bulls. A breakout can trigger a macro trend reversal, while a breakdown will extend the downtrend and invite heavier selling pressure.
Watch for the weekly close, trendline reaction, and volume behavior — the next major move is likely just around the corner.
#COTI #COTIUSDT #CryptoAnalysis #AltcoinWatch #DescendingTriangle #BreakoutTrading #SupportAndResistance #PriceAction #ChartPattern #WeeklyAnalysis
$COTI Breakout Alert COTI just broke out of its long-term downtrend with strong momentum.
If this breakout holds, it could rally toward $0.19443, over 200% upside.
Keep it on your radar.
DYOR, NFA

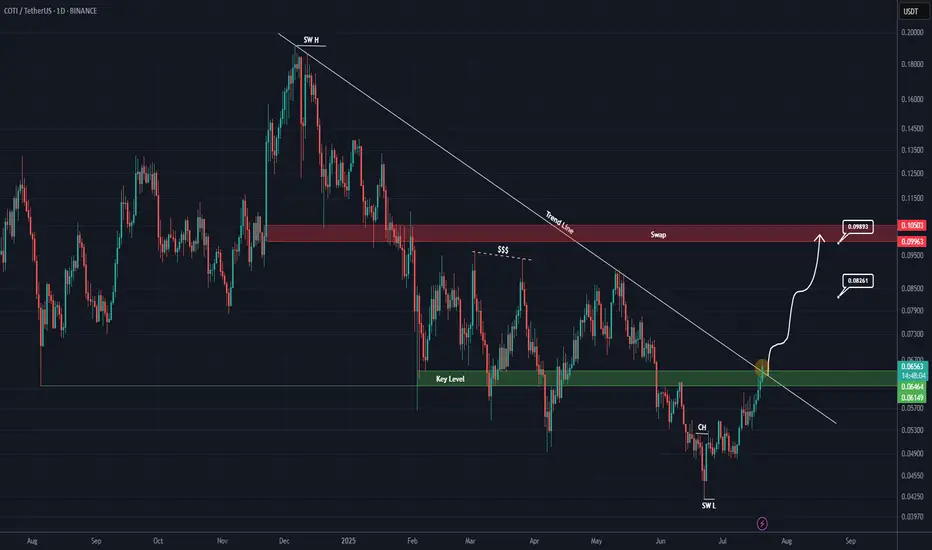
COTI Analysis (1D)The price is breaking out of an important trendline and is also reclaiming a key support zone.
⚠️ Make sure to wait for a daily candle to close above the trendline and the key level, and then enter a position on the pullback.
Targets are marked on the chart.
A daily candle close below the invalidation level will invalidate this analysis.
For risk management, please don't forget stop loss and capital management
Comment if you have any questions
Thank You
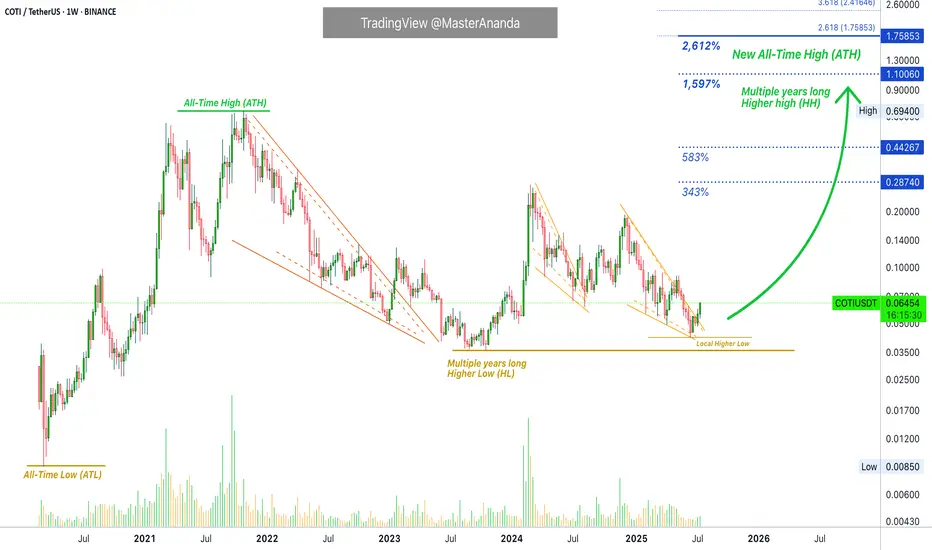
COTI Higher High (All-Time High) Confirmed · 2,612% Pot. ProfitsLet me remind you of one of the classic sayings, "higher lows will lead to higher highs —always."
While some charts are mixed; some projects produce shy lower lows and we don't know if this counts as a true lower low from a TA perspective; other pairs produce lower lows but still have potential for a new all-time high, some pairs produce double-bottoms and the situation becomes mixed; other pairs remain 100% clear. Here we have COTIUSDT with long-term higher lows.
The end of the bear market produced a bottom price that is many times higher compared to the start of the last bull market. A new all-time low (ATL) is simply not a question on this pair. The situation is 100% perfectly clear. Since we have an ultra-strong multiple-years long higher low, we can easily expect a higher high, which simply means a new all-time high (ATH) in the coming months. That's the beauty about TA and Crypto, you can predict the future if you know what to look for.
The easy targets here opens more than 580% profits potential.
COTIUSDT is trading with a full green candle today as it breaks out of a falling wedge pattern. The falling wedge is simply a downtrend. This downtrend is being broken.
On top of the long-term higher lows we have a local higher low, which is between June 2025 and October 2023. This is also long-term but not as long compared to the March 2020 market bottom and all-time low.
All this to say that market conditions are really good for this pair. The chart is super strong. This week we have a full green candle, trading at the top of the range and the session is about to close. When the session closes full green next week will be straight up. You will be witnessing the strongest action on this pair since early 2024 but with a big difference. It will be sustained. In early 2024 the big candles here only lasted three weeks. In 2025 you can have anywhere between 8-16 weeks straight up or even 24-32, etc. Whatever is needed for maximum growth to unravel. You won't be disappointed. You will be happy with the results.
Namaste.
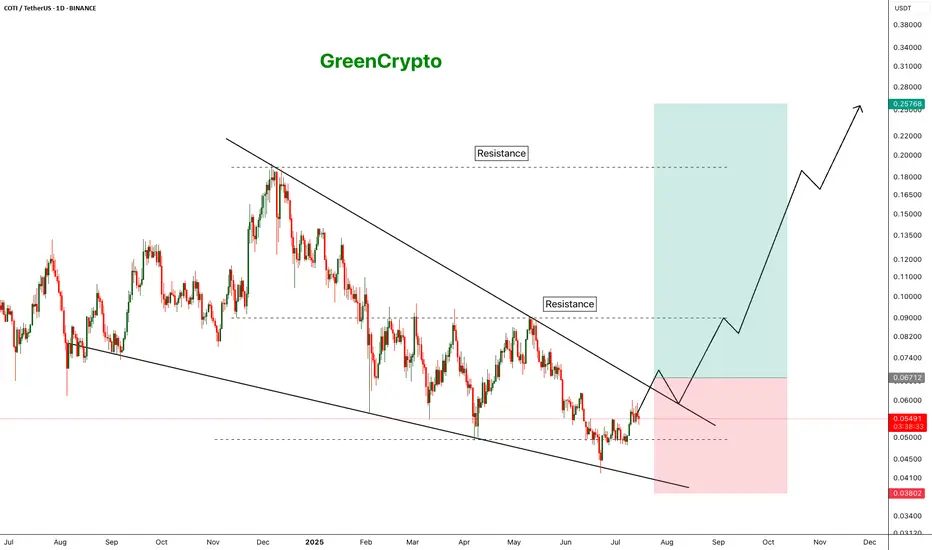
COTI - Crazy Breakout Soooooon- COTI is trading inside the falling wedge pattern
- Price is currently nearing the resistance trendline,
- A clear breakout of this trendline will push the price higher
- we will enter a long trade after the breakout
Entry Price: 0.06696
Stop Loss: 0.03793
TP1: 0.07746
TP2: 0.10366
TP3: 0.14599
TP4: 0.25150
Don't forget to keep stoploss
Cheers
GreenCrypto
COTI/USDT – Approaching Make-or-Break Zone | Multi-Leg Reversal📌 Overview:
COTI is currently at a critical inflection point in its long-term structure. After a prolonged distribution phase since 2021 and a steady decline throughout 2023–2025, price action is now testing a historical support zone that has repeatedly triggered strong reversals. This area could be the foundation of a macro bottom formation—or the gateway to further downside if broken.
🔍 Technical Breakdown & Key Price Zones:
🟨 Major Demand Zone (Support Block):
Range: $0.030 – $0.048
This is a historically significant support area, previously acting as a launchpad for bullish impulses.
There is a strong chance of forming a double bottom or even an Inverse Head & Shoulders pattern here on the weekly timeframe, which would hint at a trend reversal if confirmed.
📏 Layered Resistance Levels (Profit-Taking Zones):
1. $0.05600 – Minor resistance, first validation of bullish strength
2. $0.07460 – Previous structural resistance from early 2024
3. $0.08995 – Key breakout level that may trigger mid-term momentum
4. $0.13211 – $0.18230 – Medium-term targets on sustained breakout
5. $0.25157 – $0.41854 – Long-term targets if macro bullish trend forms
🟢 Bullish Scenario (Reversal Setup):
✅ If price holds the $0.030–$0.048 demand zone:
Expect gradual bullish momentum toward $0.05600, followed by confirmation above $0.08995.
Weekly breakout candle with strong volume would confirm reversal structure.
Mid-term price target could reach $0.132 – $0.182, or even higher during an altseason rotation.
🔴 Bearish Scenario (Breakdown Setup):
❌ If the support zone fails:
Price could break below $0.030, exposing $0.0259 or even $0.020 as next downside targets.
This would negate the potential reversal structure and resume the bearish continuation trend.
Traders should wait for a new base or re-accumulation signal before re-entering long positions.
📊 Pattern Focus:
Double Bottom / Inverse Head & Shoulders (Potential Formation)
Descending Channel breakout watch
Volume Drying Up = Possible prelude to trend reversal if volume spikes follow
💡 Trading Strategy:
Aggressive Long Entry: Buy within the yellow support zone, stop-loss below $0.030
Conservative Entry: Wait for breakout and successful retest above $0.056
Bearish Setup: If breakdown occurs, short-term shorts or sidelining recommended
📈 Momentum Outlook:
Weekly structure suggests seller exhaustion is setting in.
Swing reversal is likely if price holds above the support range for the coming weeks.
Gradual accumulation strategy is suitable for swing traders.
🧲 Key Takeaway:
> COTI is entering a golden zone for potential mid-term reversal. If the support holds and a reversal pattern forms, a 200%+ upside is realistic. However, failure to hold this zone could lead to a breakdown and deeper correction. Patience and confirmation are key.
#COTI #COTIUSDT #CryptoAnalysis #AltcoinSeason #DoubleBottom #SupportZone #TrendReversal #TechnicalAnalysis #WeeklyChart #BreakoutWatch
$COTI Approaching Key Long-Term Support!Price is testing a major trendline + demand zone that has held since 2021 👀
If this holds, a move toward $0.09 → $0.108 looks highly probable.
Invalidation below $0.04.
Risk-reward looks 🔥 for long-term swing traders.
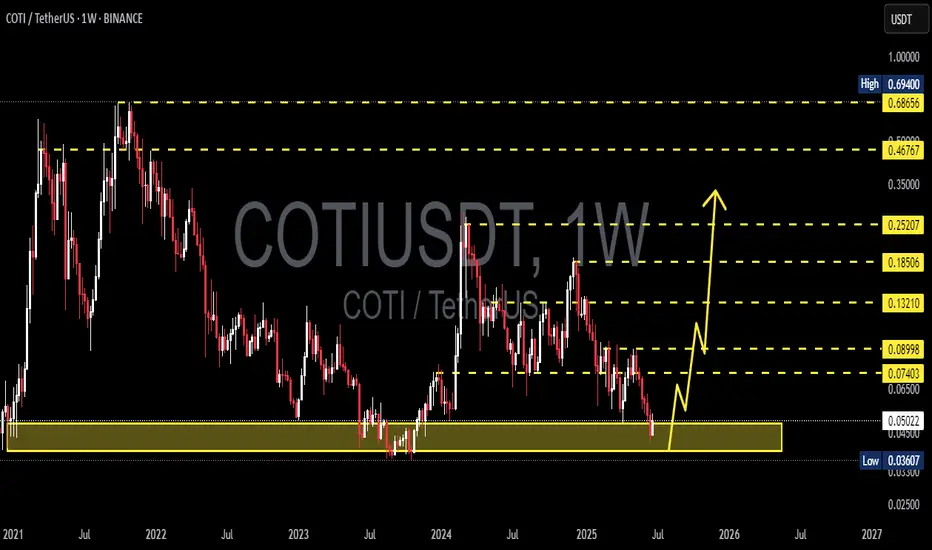
COTI/USDT Weekly Analysis – Potential Macro Reversal in PlayThe chart displays a long-term downtrend structure for COTI/USDT, yet a significant accumulation zone is forming around the $0.036–$0.045 range (highlighted in yellow). This area has acted as a key support level multiple times since 2021, suggesting strong demand and a potential bottoming pattern.
🔍 Key Observations:
Macro Support Zone:
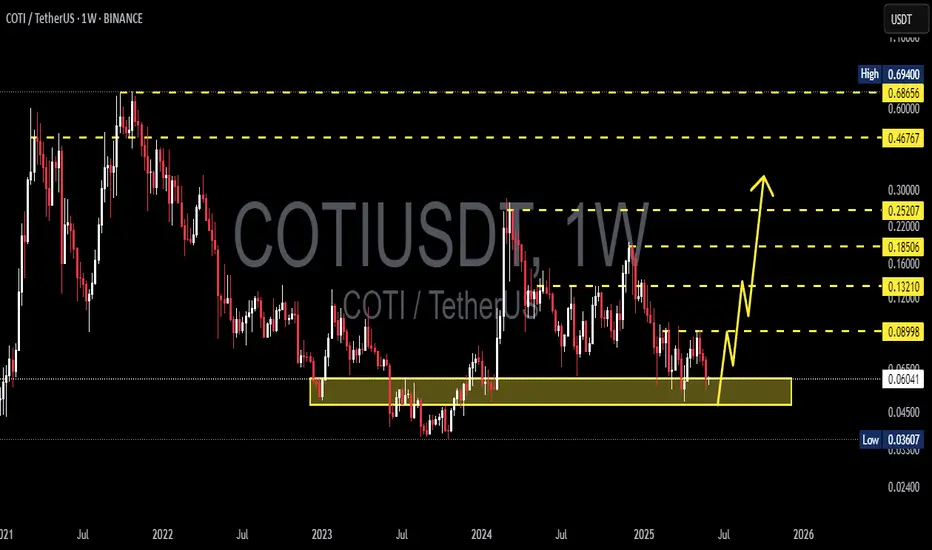
Price is currently trading within a strong historical support zone between $0.03607 (multi-year low) and $0.04500, where buyers have consistently stepped in over the past few years.
Potential Reversal Path:
The projected yellow path indicates a bullish scenario with a potential rally from current levels toward a series of resistance levels if a reversal is confirmed.
Major Resistance Levels to Watch:
$0.05046 – Minor local resistance
$0.06500 – Psychological resistance
$0.07403 – Structural level
$0.08998 – Previous rejection zone
$0.12000 – Psychological mid-range target
$0.13210 – Prior support turned resistance
$0.16000–$0.25207 – Key macro targets
$0.46767–$0.69400 – Long-term bullish targets if momentum continues
Bullish Breakout Triggers:
A confirmed breakout above $0.065–$0.074 may trigger momentum-based entries, especially if volume supports the breakout. Sustained price action above $0.12 would further validate the bullish trend reversal.
📉 Risk Management:
This setup is still speculative until a clear reversal structure forms on the weekly timeframe. Invalidation of the setup occurs if weekly candle closes decisively below $0.036.
Conclusion: COTI is currently at a pivotal zone. While the broader trend has been bearish, the current setup offers an attractive risk/reward for mid to long-term bulls if reversal confirmation appears. Watch for bullish weekly structure and volume expansion to validate the thesis.
COTIUSDT 1W AnalysisCOTI ~ 1W Analysis
#COTI Buy gradually from here if you still have confidence in this coin with a short term target of at least 15%+ from here.
COTIUSDT 1D AnalysisCOTI ~ 1D Analysis
#COTI Buy back gradually from here if you still have confidence in this coin with a short term target of at least 15%+ from here.

COTI WAVE 3 is coming COTI has completed its initial phases, Wave 1, 2 of Elliot waves and is preparing for Wave 3📈.
Also COTI V2, released recently, aims to revolutionize web3 privacy.
COTI’s market capitalization is $96 million, suggesting substantial potential gains during the upcoming bull market🚀.
This information is not financial advice. Conduct thorough research before making investment decisions.

COTIUSDT 1D AnalysisCOTI ~ 1D Analysis
#COTI Buy after successfully penetrating this resistant line with a short -term target of at least 10%+ from here.

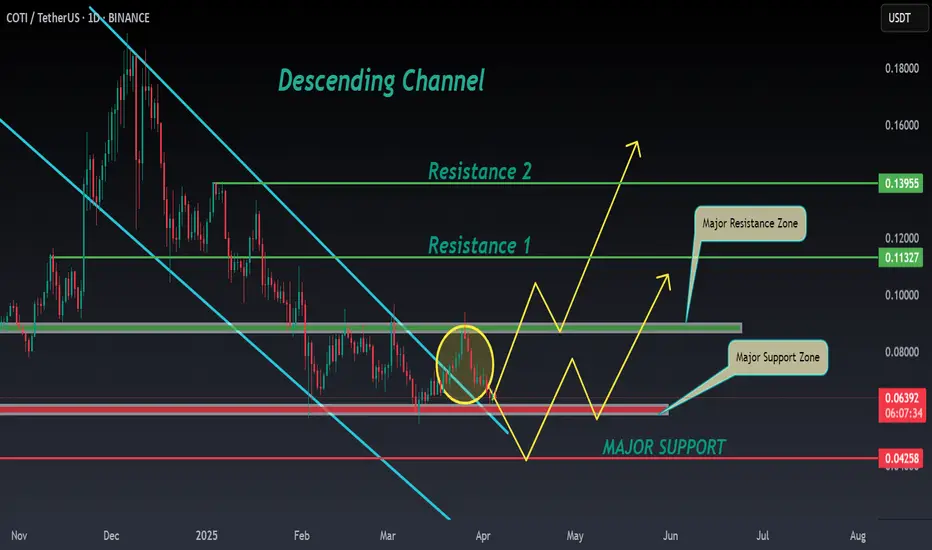
COTI ANALYSIS 📊 #COTI Analysis
✅There is a formation of Descending Channel Pattern in weekly time frame in #COTI.
Also there is a perfect breakout and retest. Now we can expect a bullish move from major support zone. If not the we will see more bearish move and then a reversal in #COTI.
👀Current Price: $0.06390
🎯 Target Price : $0.08660
⚡️What to do ?
👀Keep an eye on #COTI price action and volume. We can trade according to the chart and make some profits⚡️⚡️
#COTI #Cryptocurrency #Breakout #TechnicalAnalysis #DYOR
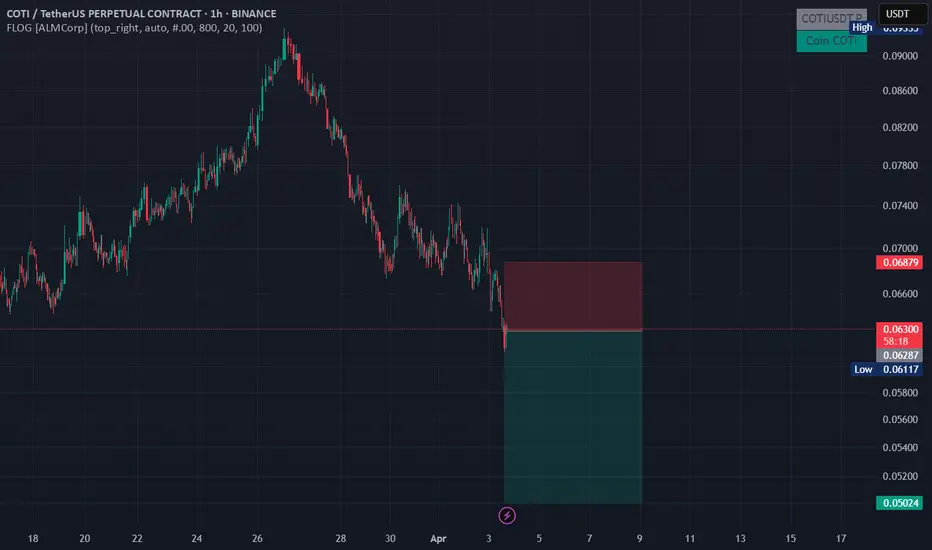
LIMIT ORDER - $COTI/USDTLIMIT ORDER - $COTI/USDT
Direction: #Short 🔴
Entry Price: 0.062870
Stop Loss: 0.068793
Target 1: 0.060344
Target 2: 0.057817
Target 3: 0.055291
Target 4: 0.052764
Target 5: 0.050238
#COTI/USDT#COTI
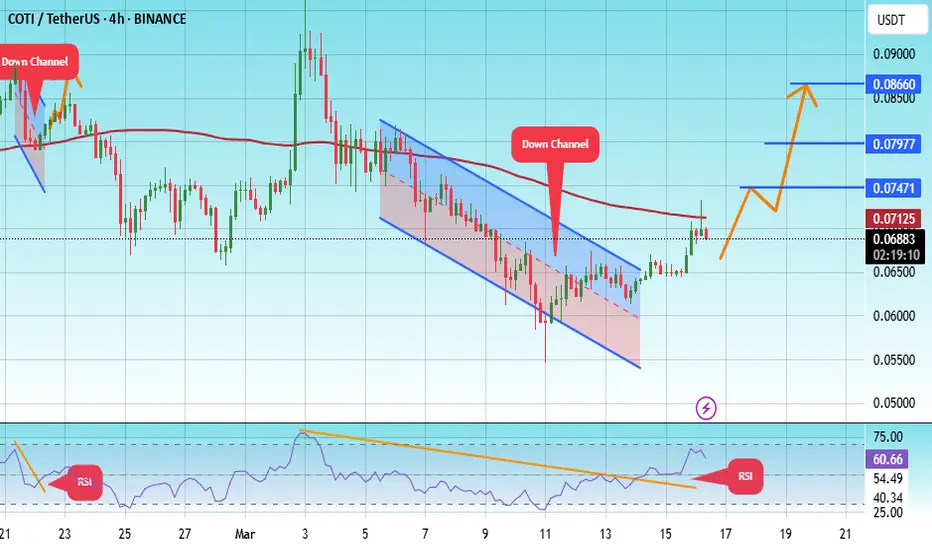
The price is moving within a descending channel on the 1-hour frame, adhering well to it, and is on its way to breaking it strongly upwards and retesting it.
We are seeing a rebound from the lower boundary of the descending channel, which is support at 0.06870.
We have a downtrend on the RSI indicator that is about to break and retest, supporting the upward trend.
We are looking for stability above the 100 Moving Average.
Entry price: 0.06870
First target: 0.07471
Second target: 0.09799
Third target: 0.08660
Eyes on this Cotiusdt can Pull a Massive MoveThis can pull a massive move.
Risking on this by buying DCA Spot.
This if holds and move can pull a massive move.
Targeting 0.2 and 0.3
Note: Not a Financial Advise.
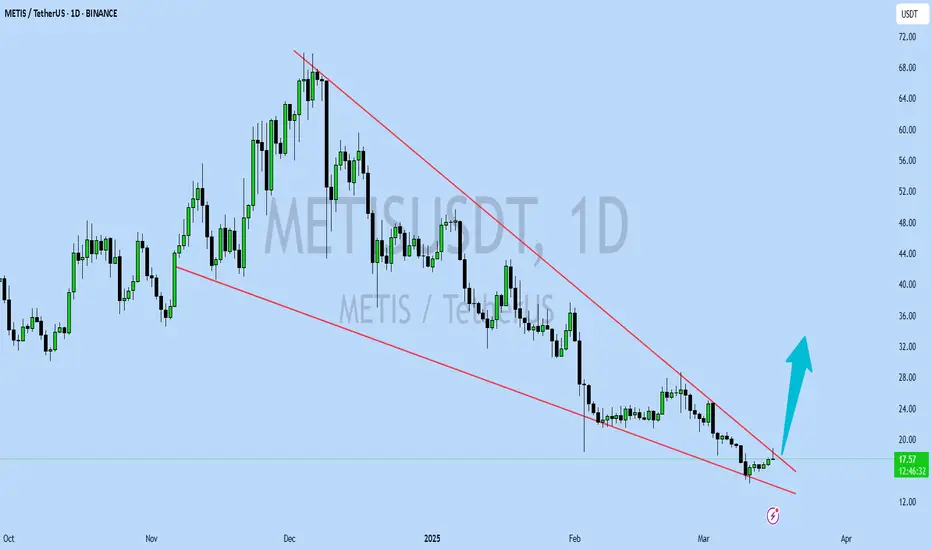
METISUSDT UPDATEMETISUSDT is a cryptocurrency trading at $17.57. Its target price is $32.00, indicating a potential 80%+ gain. The pattern is a Bullish Falling Wedge, a reversal pattern signaling a trend change. This pattern suggests the downward trend may be ending. A breakout from the wedge could lead to a strong upward move. The Bullish Falling Wedge is a positive signal, indicating a potential price surge. Investors are optimistic about METISUSDT's future performance. The current price may be a buying opportunity. Reaching the target price would result in significant returns. METISUSDT is poised for a potential breakout and substantial gains.
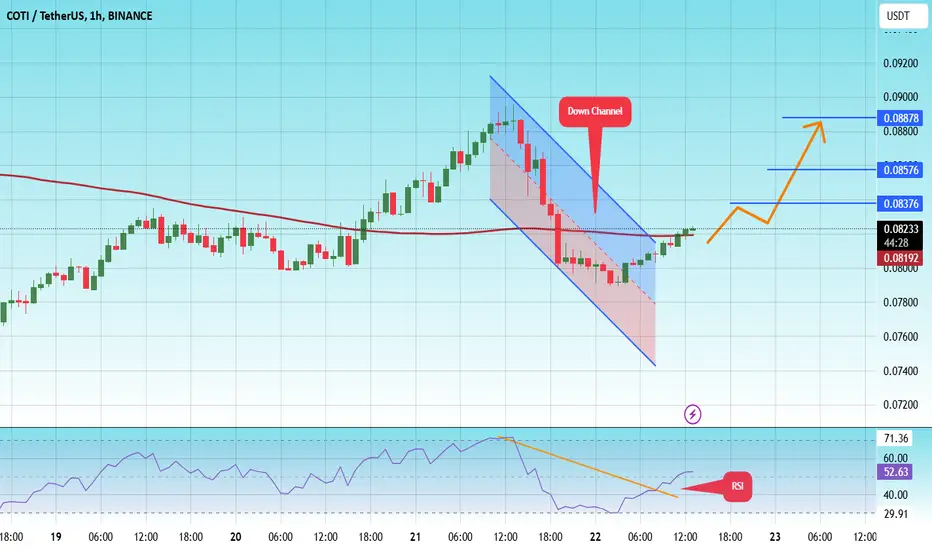
#COTI/USDT#COTI
The price is moving in a descending channel on the 1-hour frame and is expected to continue upwards
We have a trend to stabilize above the moving average 100 again
We have a descending trend on the RSI indicator that supports the rise by breaking it upwards
We have a support area at the lower limit of the channel at a price of 0.07800
Entry price 0.08236
First target 0.08376
Second target 0.08576
Third target 0.08878
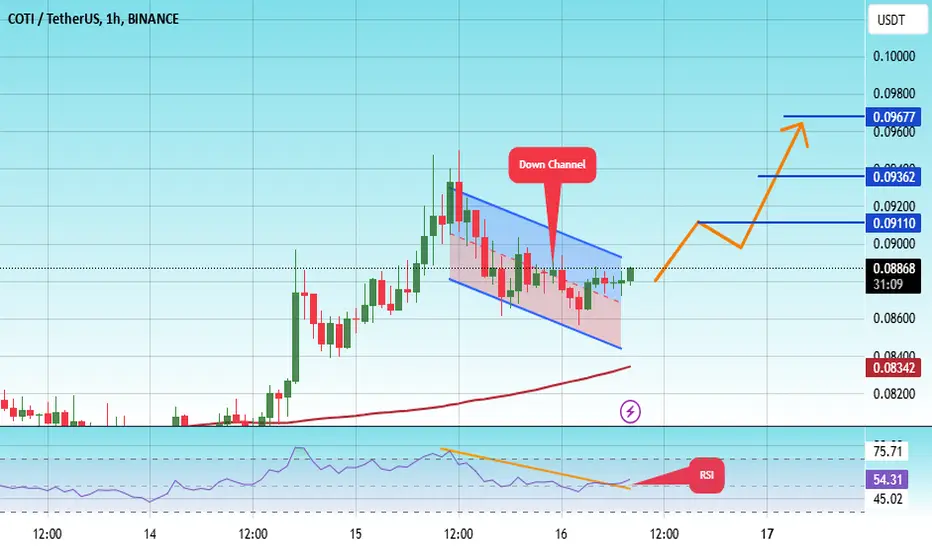
#COTI/USDT#COTI
The price is moving in a descending channel on the 1-hour frame and is adhering to it well and is heading to break it strongly upwards and retest it
We have a bounce from the lower limit of the descending channel, this support is at a price of 0.08530
We have a downtrend on the RSI indicator that is about to break and retest, which supports the rise
We have a trend to stabilize above the moving average 100
Entry price 0.08863
First target 0.09110
Second target 0.09362
Third target 0.09677
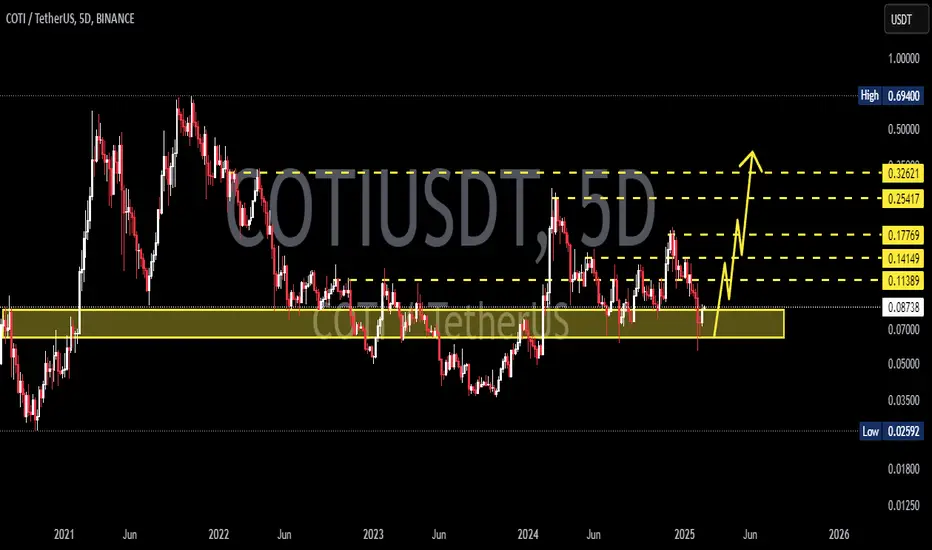
COTIUSDT 5DCOTI ~ 5D Analysis
#COTI Currently continuing to maintain this support block. Buy gradually from here if you still have a Conviction on this Coin with a minimum target of 15%+.
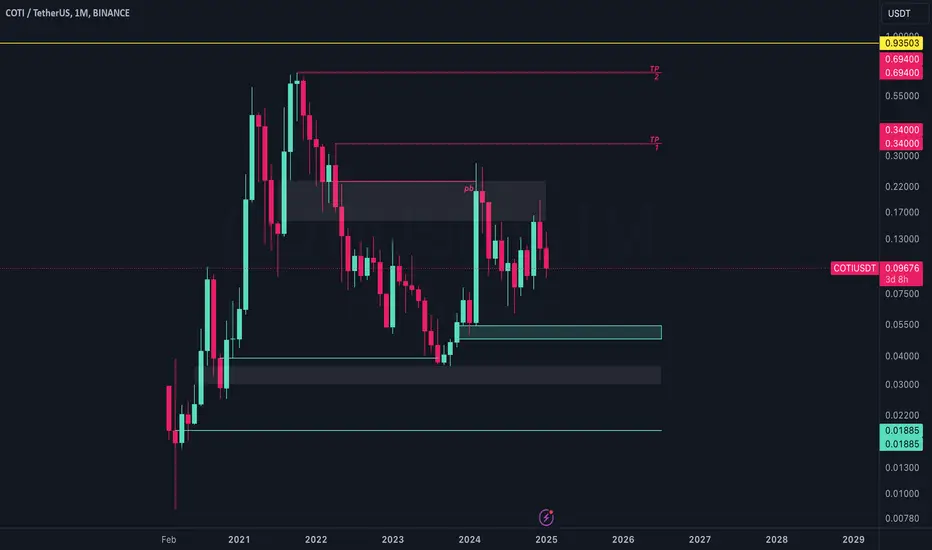
Coti Monthly AnalysisIn the monthly timeframe, the green box area is crucial for creating an upward trend to reach the specified targets on the chart.
If the closing price falls below the green box, there is a possibility of reaching $0.01885.
#COTI/USDT Ready to take off upwards#COTI
The price is moving in a descending channel on the 1-hour frame and is adhering to it well and is heading to break it strongly upwards
We have a bounce from the lower limit of the descending channel, this support is at a price of 0.06000
We have a downtrend on the RSI indicator that is about to be broken, which supports the rise
We have a trend to stabilize above the moving average 100
Entry price 0.08850
First target 0.1020
Second target 0.10810
Third target 0.1147
