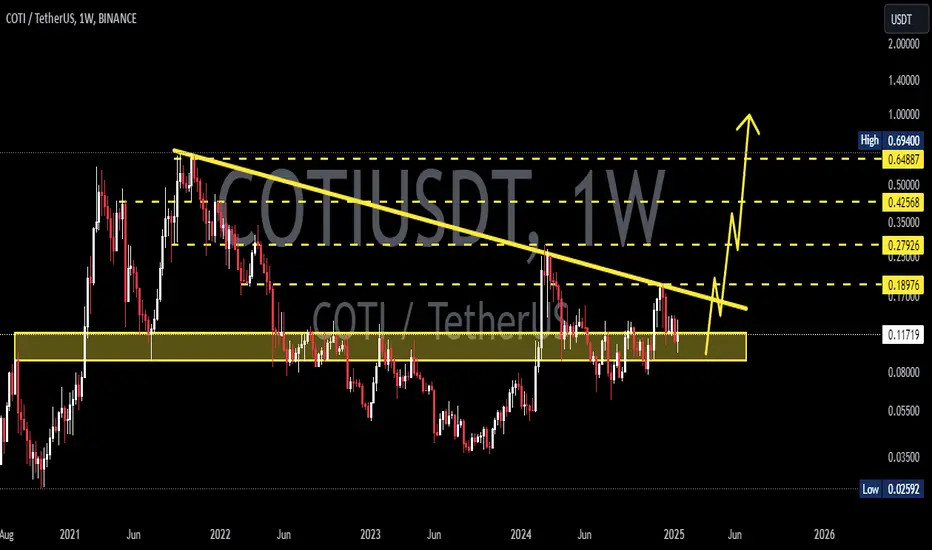
COTIUSDT Weekly Analysis Potential Reversal?📍 Current Price Position – On Top of Historical Support!
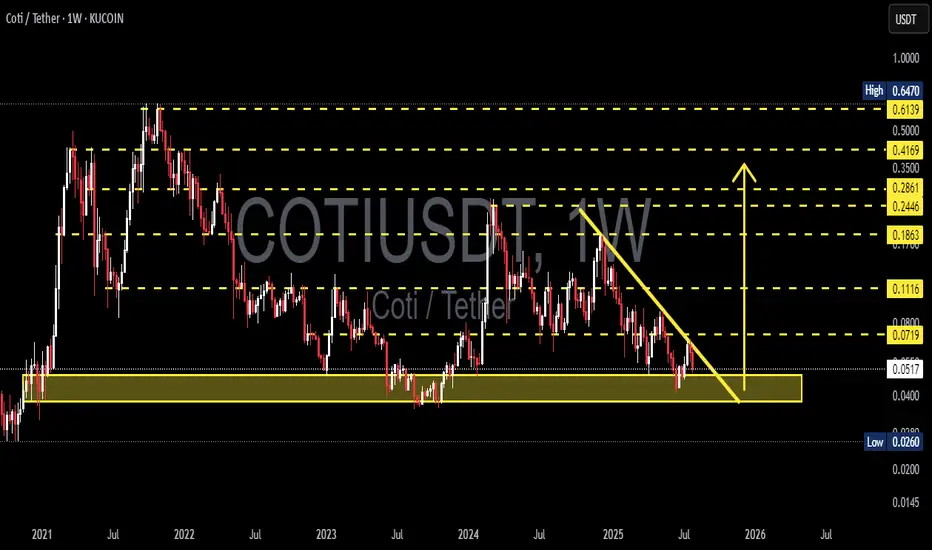
The COTI/USDT pair is currently testing a crucial support zone between $0.0400 – $0.0517, which has been a key demand zone since early 2021. This isn't just any support — it's a macro psychological area that has repeatedly triggered strong reversals in the past.
We are at a make-or-break level, where the next move could define the mid-term trend.
---
🧩 Price Structure and Pattern
📐 The chart shows a descending triangle pattern with:
Consistently lower highs (marked by the downward yellow trendline),
Flat horizontal base around the major support zone.
This pattern can result in:
A powerful breakout if the trendline is broken, or
A sharp breakdown if the horizontal support fails.
---
📈 Bullish Scenario: Reversal Momentum Building?
If price:
Breaks above the descending trendline (~$0.0719), and
Closes a weekly candle above that resistance zone,
➡️ We could see a breakout move with targets at:
Resistance Level Target
Initial Target $0.1116
Mid-Term Target $0.1863
Strong Zone $0.2446 – $0.2861
Long-Term Bullish $0.35 – $0.4169
📌 A confirmed higher high and higher low structure above $0.11 would strengthen the bullish case.
---
📉 Bearish Scenario: Breakdown from Support
If:
Price fails to hold the $0.0517 – $0.0400 support area,
and prints a weekly close below this zone,
➡️ The next bearish targets could be:
Support Level Target
First Support $0.0260
Psychological Level $0.0200
Extreme Panic Zone $0.0150 – $0.0100
⚠️ This would indicate a capitulation phase, likely to trigger panic selling and deeper lows.
---
🧠 Strategy Notes for Traders
✅ For Position Traders:
The $0.040 – $0.0517 area is a prime watch zone for reversal setups with tight stop-loss below $0.040.
Excellent Risk:Reward potential if reversal confirms.
✅ For Swing Traders:
Breakout above the trendline offers a solid entry signal.
Targets up to $0.1863 look achievable with strong volume.
✅ For Conservative Traders:
Wait for breakout + retest confirmation before entering.
Avoid FOMO — let the weekly candle close guide your decision.
---
⚡️ Final Takeaway
> COTI/USDT is at a tipping point!
This long-standing support is the last line of defense for the bulls. A breakout can trigger a macro trend reversal, while a breakdown will extend the downtrend and invite heavier selling pressure.
Watch for the weekly close, trendline reaction, and volume behavior — the next major move is likely just around the corner.
#COTI #COTIUSDT #CryptoAnalysis #AltcoinWatch #DescendingTriangle #BreakoutTrading #SupportAndResistance #PriceAction #ChartPattern #WeeklyAnalysis
Cotiusdtanalysis
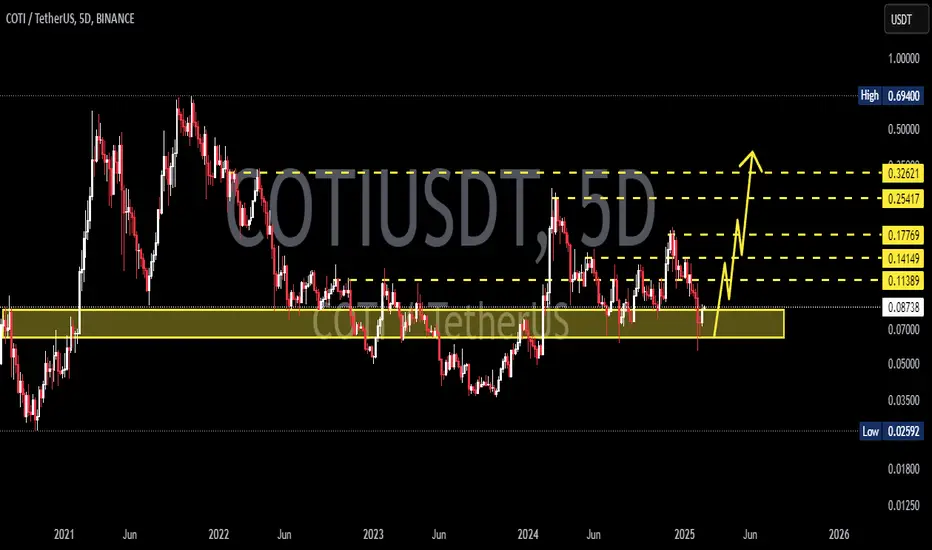
COTI/USDT – Approaching Make-or-Break Zone | Multi-Leg Reversal📌 Overview:
COTI is currently at a critical inflection point in its long-term structure. After a prolonged distribution phase since 2021 and a steady decline throughout 2023–2025, price action is now testing a historical support zone that has repeatedly triggered strong reversals. This area could be the foundation of a macro bottom formation—or the gateway to further downside if broken.
🔍 Technical Breakdown & Key Price Zones:
🟨 Major Demand Zone (Support Block):
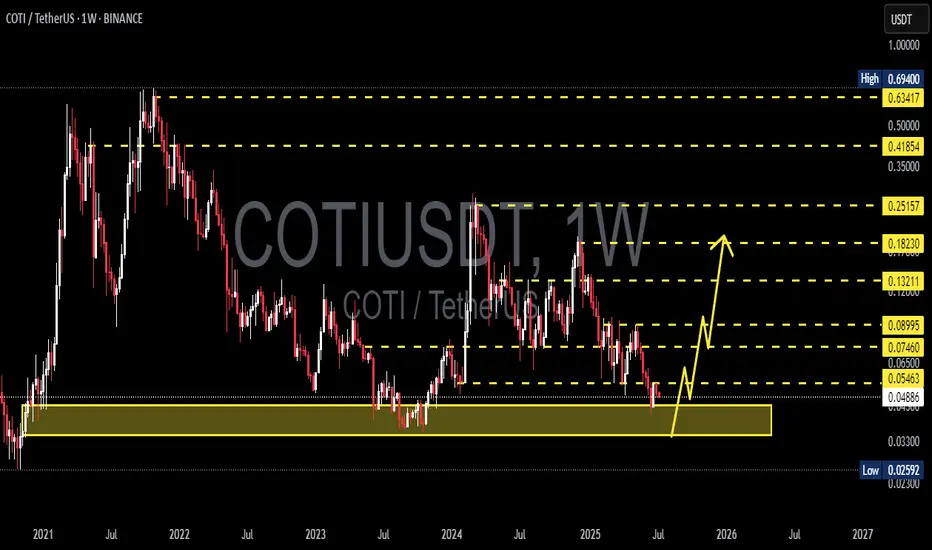
Range: $0.030 – $0.048
This is a historically significant support area, previously acting as a launchpad for bullish impulses.
There is a strong chance of forming a double bottom or even an Inverse Head & Shoulders pattern here on the weekly timeframe, which would hint at a trend reversal if confirmed.
📏 Layered Resistance Levels (Profit-Taking Zones):
1. $0.05600 – Minor resistance, first validation of bullish strength
2. $0.07460 – Previous structural resistance from early 2024
3. $0.08995 – Key breakout level that may trigger mid-term momentum
4. $0.13211 – $0.18230 – Medium-term targets on sustained breakout
5. $0.25157 – $0.41854 – Long-term targets if macro bullish trend forms
🟢 Bullish Scenario (Reversal Setup):
✅ If price holds the $0.030–$0.048 demand zone:
Expect gradual bullish momentum toward $0.05600, followed by confirmation above $0.08995.
Weekly breakout candle with strong volume would confirm reversal structure.
Mid-term price target could reach $0.132 – $0.182, or even higher during an altseason rotation.
🔴 Bearish Scenario (Breakdown Setup):
❌ If the support zone fails:
Price could break below $0.030, exposing $0.0259 or even $0.020 as next downside targets.
This would negate the potential reversal structure and resume the bearish continuation trend.
Traders should wait for a new base or re-accumulation signal before re-entering long positions.
📊 Pattern Focus:
Double Bottom / Inverse Head & Shoulders (Potential Formation)
Descending Channel breakout watch
Volume Drying Up = Possible prelude to trend reversal if volume spikes follow
💡 Trading Strategy:
Aggressive Long Entry: Buy within the yellow support zone, stop-loss below $0.030
Conservative Entry: Wait for breakout and successful retest above $0.056
Bearish Setup: If breakdown occurs, short-term shorts or sidelining recommended
📈 Momentum Outlook:
Weekly structure suggests seller exhaustion is setting in.
Swing reversal is likely if price holds above the support range for the coming weeks.
Gradual accumulation strategy is suitable for swing traders.
🧲 Key Takeaway:
> COTI is entering a golden zone for potential mid-term reversal. If the support holds and a reversal pattern forms, a 200%+ upside is realistic. However, failure to hold this zone could lead to a breakdown and deeper correction. Patience and confirmation are key.
#COTI #COTIUSDT #CryptoAnalysis #AltcoinSeason #DoubleBottom #SupportZone #TrendReversal #TechnicalAnalysis #WeeklyChart #BreakoutWatch
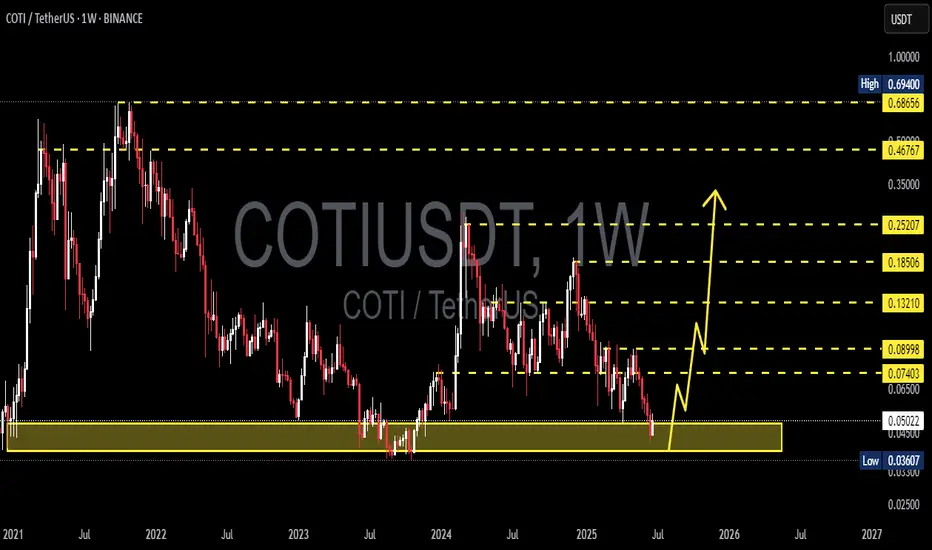
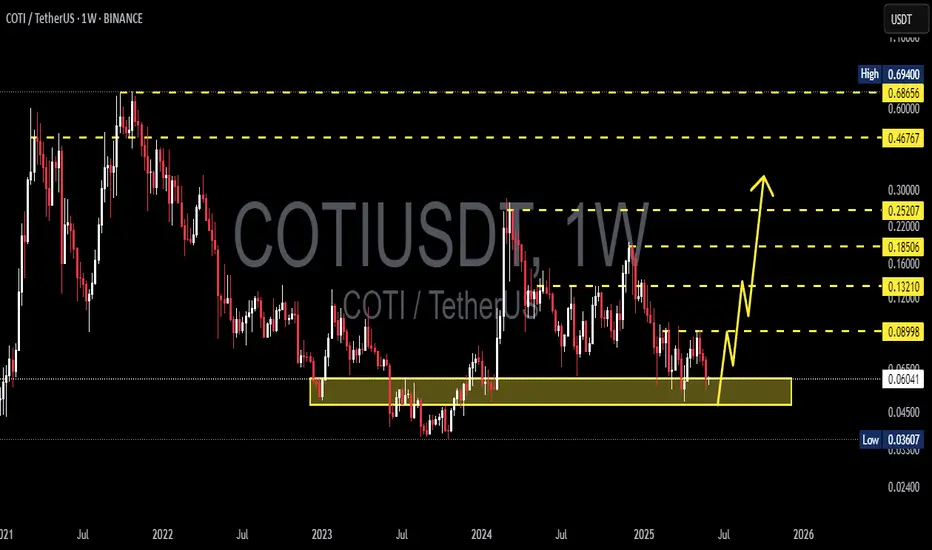
COTI/USDT Weekly Analysis – Potential Macro Reversal in PlayThe chart displays a long-term downtrend structure for COTI/USDT, yet a significant accumulation zone is forming around the $0.036–$0.045 range (highlighted in yellow). This area has acted as a key support level multiple times since 2021, suggesting strong demand and a potential bottoming pattern.
🔍 Key Observations:
Macro Support Zone:
Price is currently trading within a strong historical support zone between $0.03607 (multi-year low) and $0.04500, where buyers have consistently stepped in over the past few years.
Potential Reversal Path:
The projected yellow path indicates a bullish scenario with a potential rally from current levels toward a series of resistance levels if a reversal is confirmed.
Major Resistance Levels to Watch:
$0.05046 – Minor local resistance
$0.06500 – Psychological resistance
$0.07403 – Structural level
$0.08998 – Previous rejection zone
$0.12000 – Psychological mid-range target
$0.13210 – Prior support turned resistance
$0.16000–$0.25207 – Key macro targets
$0.46767–$0.69400 – Long-term bullish targets if momentum continues
Bullish Breakout Triggers:
A confirmed breakout above $0.065–$0.074 may trigger momentum-based entries, especially if volume supports the breakout. Sustained price action above $0.12 would further validate the bullish trend reversal.
📉 Risk Management:
This setup is still speculative until a clear reversal structure forms on the weekly timeframe. Invalidation of the setup occurs if weekly candle closes decisively below $0.036.
Conclusion: COTI is currently at a pivotal zone. While the broader trend has been bearish, the current setup offers an attractive risk/reward for mid to long-term bulls if reversal confirmation appears. Watch for bullish weekly structure and volume expansion to validate the thesis.
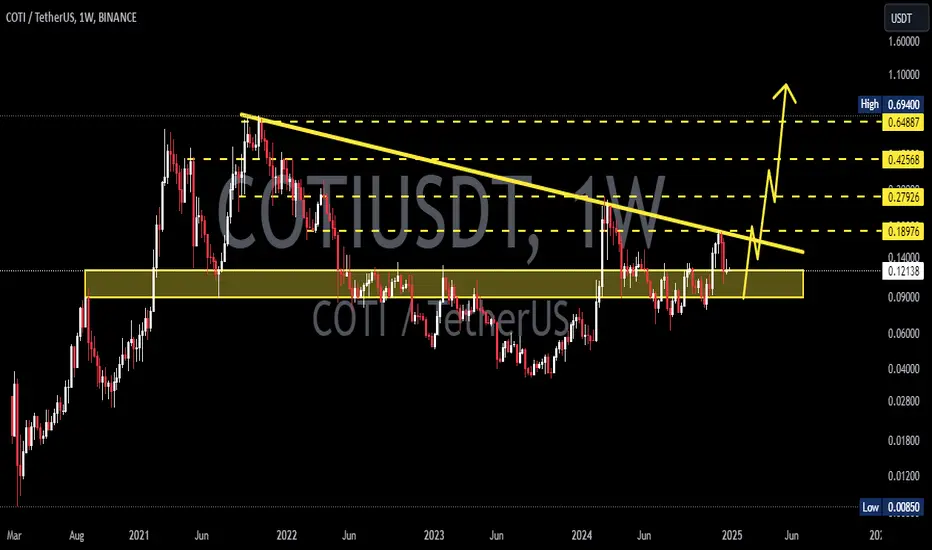
COTIUSDT 1W AnalysisCOTI ~ 1W Analysis
#COTI Buy gradually from here if you still have confidence in this coin with a short term target of at least 15%+ from here.
COTIUSDT 1D AnalysisCOTI ~ 1D Analysis
#COTI Buy back gradually from here if you still have confidence in this coin with a short term target of at least 15%+ from here.

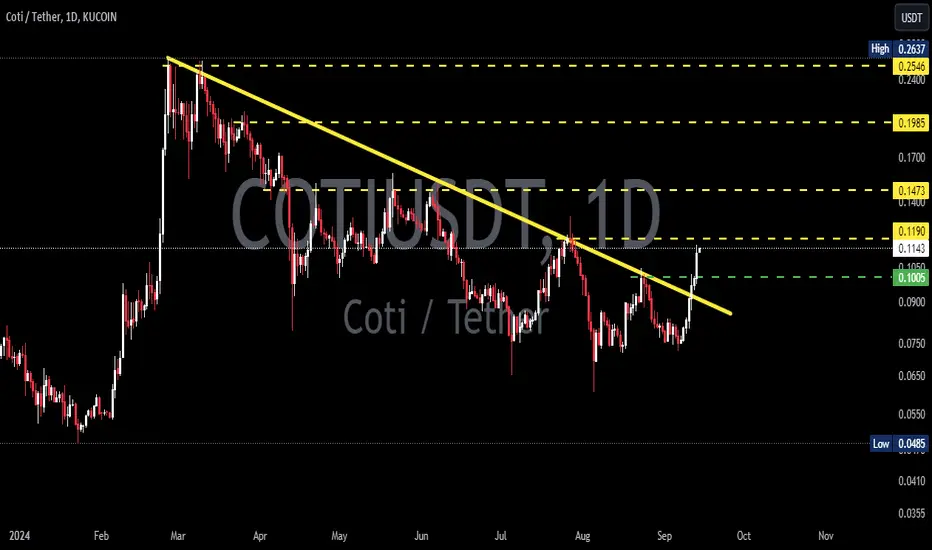
COTIUSDT 1D AnalysisCOTI ~ 1D Analysis
#COTI Buy after successfully penetrating this resistant line with a short -term target of at least 10%+ from here.

COTIUSDT 5DCOTI ~ 5D Analysis
#COTI Currently continuing to maintain this support block. Buy gradually from here if you still have a Conviction on this Coin with a minimum target of 15%+.
COTIUSDT 1WCOTI ~ 1W
#COTI If you still have Conviction on the coin,. this support block would be a very good buying place for now. buy in stages with a minimum target of 20%+
COTIUSDT 1WCOTI Update ~ 1W
#COTI If you still have Conviction on the coin,. this support block would be a very good buying place for now. buy in stages with a minimum target of 20%+
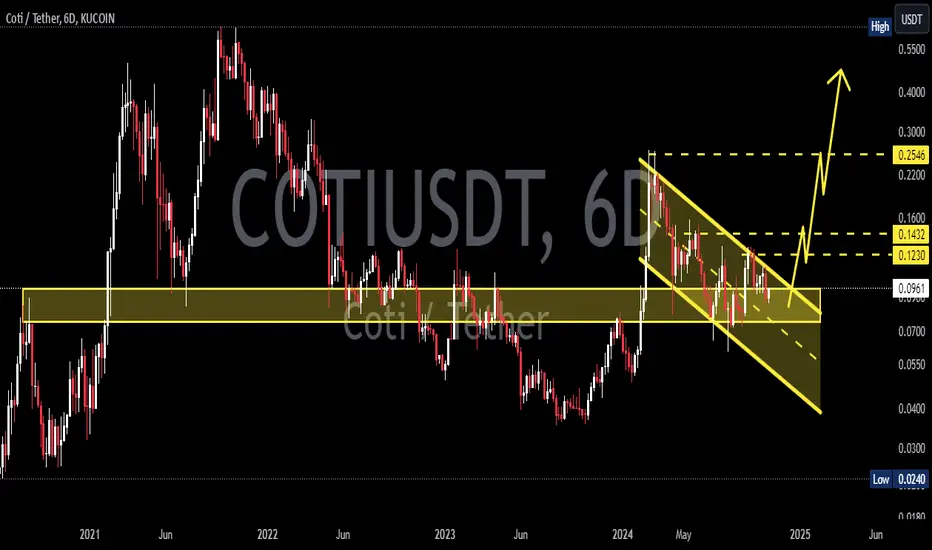
COTIUSDTCOTI ~ 6D
#COTI So far it continues to maintain this support block. if you have Conviction on this coin,. This support block would be a very good buy for now.
COTIUSDTCOTI ~ 1D ✅
#COTI Managed to break this descending resistance with strong volume. and now faced with local resistance here. If retesting occurs,. This would be a good opportunity for short-term buying.
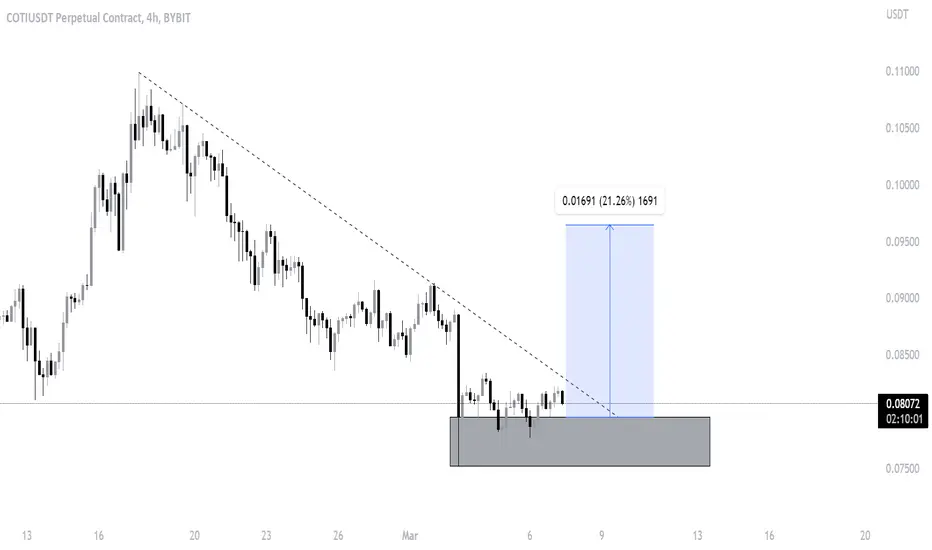
Is COTIUSDT About to Explode or Collapse? Read Now to Find Out!Yello, Paradisers! Have you been following #COTIUSDT's recent moves? Let's dive in.
💎#COTI has successfully reclaimed its support level, signaling bullish momentum. Currently, the price sits on this support after a failed breakout attempt of the descending resistance. A rebound at this support level is crucial. If COTI breaks out of the descending resistance, we could see a significant upward move toward our target resistance area.
💎However, if COTI fails to bounce and breaks down from the support area, the price may revisit the demand zone. This zone has large buy orders, and a hit here could lead to a significant rebound back upwards.
💎If COTI fails to sustain above the order block (OB) area of 0.65, a breakdown would invalidate the bullish outlook, potentially signaling a bearish trend with the price moving further downward and dipping.
If you want to be consistently profitable, you need to be extremely patient and always wait only for the best, highest probability trading opportunities.
MyCryptoParadise
iFeel the success🌴
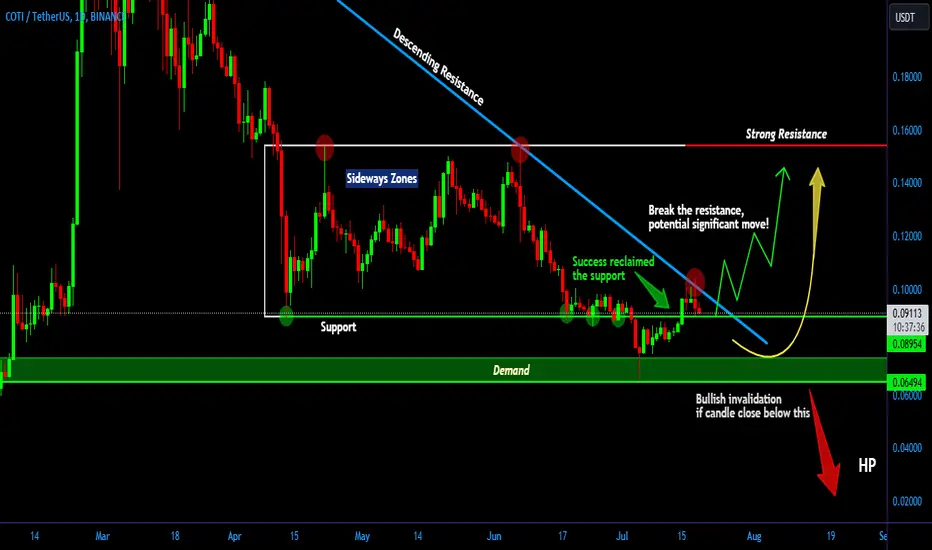
COTI/USDT Break Key Level, Bullish Momentum or false breakout? 💎 COTI has certainly piqued our interest. Having broken through a formidable resistance zone, COTI showcases potential bullish momentum, especially after spending 52 days in a sideways pattern within that range.
💎 Currently, COTI is in a retesting phase post its breakout from the strong resistance. A bounce in this region would pave the way for a continued upward trajectory.
💎 However, should COTI fail to maintain its position and close below the resistance zone, it might indicate a false breakout. In such a scenario, COTI could descend towards the nearby demand at $0.0415.
💎 A bounce at this point might lead to an upward retest of the resistance due to the false breakout, only to potentially decline again towards the demand at $0.039 or even approach the robust support zone.

COTI/USDT Analysis! LONG!COTI/USDT Has found a strong demand zone! expecting a breakout to the upside.
COTI left alot of liquidity above the current price, im buying!