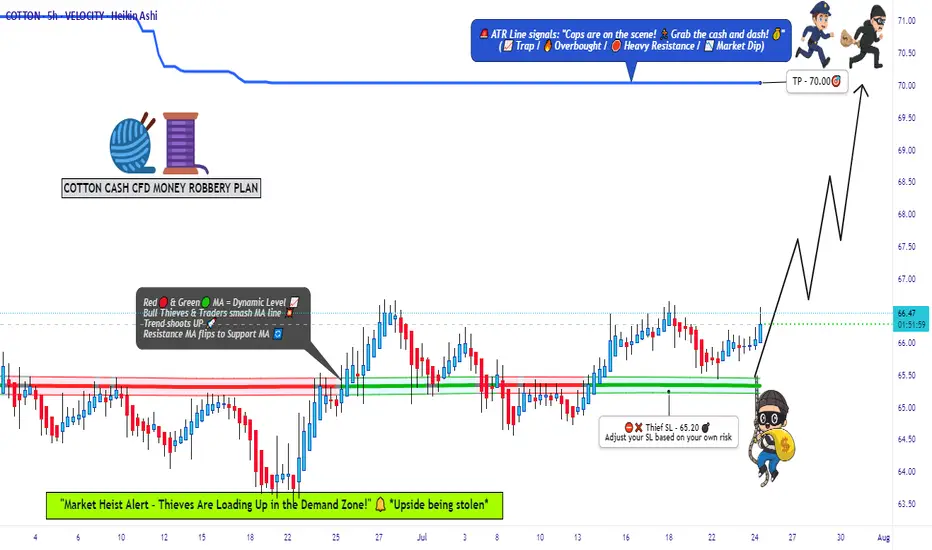
COTTON QUICK TRADE: Low Risk, High Reward Setup!🚨 COTTON HEIST ALERT: Bullish Bank Robbery in Progress! (CFD/Commodity Raid Plan) 🚨
Thief Trader’s Master Loot Strategy – Long Entry, Escape Before the Cops Arrive!
🌟 Greetings, Fellow Market Bandits! 🌟
Hola! Bonjour! Hallo! Marhaba! 🤑💸 Money Makers & Midnight Robbers, it’s time to execute the COTTON COMMODITY HEIST with precision. Based on 🔥Thief Trading Style Analysis🔥, this is your VIP invite to the biggest bullish swipe of the season.
🔓 THE VAULT IS OPEN – ENTRY PLAN (LONG RAID)
📈 "Break the Lock & Loot!"
Ideal Entry: Buy limit orders within 15-30min pullbacks (swing lows/highs).
Pro Thief Move: Layer your entries (DCA-style) for maximum stealth.
Aggressive Robbers: Charge in directly if liquidity is high.
🚨 STOP-LOSS (ESCAPE ROUTE)
🛑 "Hide Your Loot or Get Busted!"
Place SL below the nearest swing low (5H MA @ 65.20).
Adjust based on your risk tolerance & loot size (multiple orders = tighter escape).
🎯 TARGET: CASH OUT BEFORE THE COPS ARRIVE!
🏴☠️ Take Profit Zone: 70.00 (or escape earlier if the market turns shaky!)
Scalpers: Trailing SL = your best ally. Stick to LONG-ONLY quick hits!
Swing Bandits: Ride the wave but don’t get greedy—exit before the pullback trap!
🔥 WHY THIS HEIST WILL WORK (BULLISH CATALYSTS)
🧵 Cotton’s Price Surge Fueled By:
Supply Squeeze (Storage/Inventory Data 📉).
COT Report Shows Big Money Going Long 🏦.
Seasonal Trends + Macro Sentiment Shift ☀️📈.
Intermarket Signals Aligning (Commodity Supercycle?).
(Full analysis? Check the FUNDAMENTALS & KLICKK! 👉🔗)
⚠️ WARNING: NEWS TRAPS & VOLATILITY AHEAD
📰 "Cops (News Events) Can Crash the Party!"
Avoid new trades during high-impact news (liquidity dries up = slippage risk!).
Lock profits with trailing stops—don’t let the market reverse-steal your gains!
💥 BOOST THIS HEIST – STRONGER GANG = MORE LOOT!
💖 "Smash the 👍 LIKE button to support the crew!"
More boosts = more heist plans (next target: OIL? GOLD? STOCKS?).
Daily profit raids await—follow & stay tuned! 🤝
🚀 See you at the escape zone, bandits!💨
🎯 FINAL THIEF TRADER RULE:
"Steal Fast, Exit Faster—No Prison Trades!" 🏃♂️💨
Cottonbuy
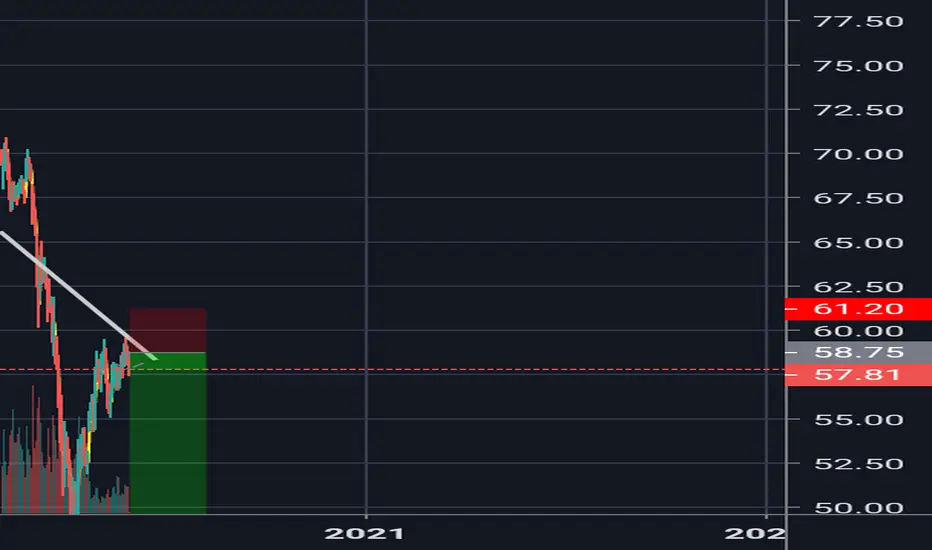
COTTON SELLWelcome . Great opportunity to sell. cotton. with a broken triangle. And re-test. With a very negative candle. servile entry for great sellers. Please do not miss the opportunity. Thank you NEXT LEVEL 78

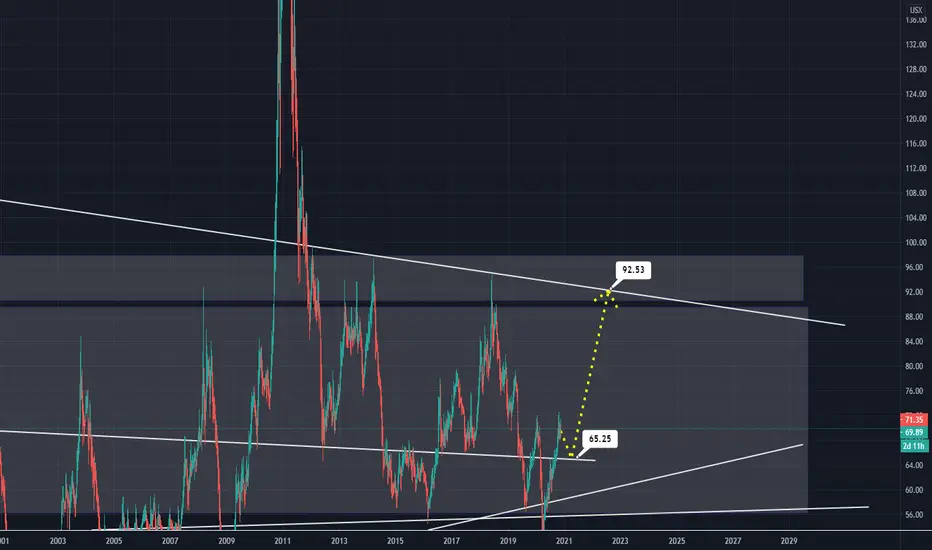
COTTON Nr.2 - Weekly; Buy it... for now.ICEUS:CT1!
It's a rocky road, so watch it!
Here is the Monthly;
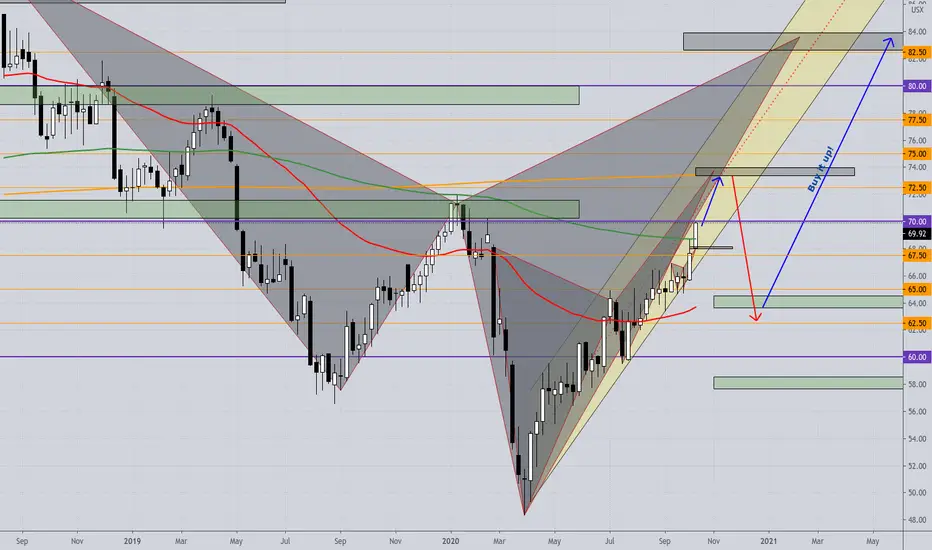
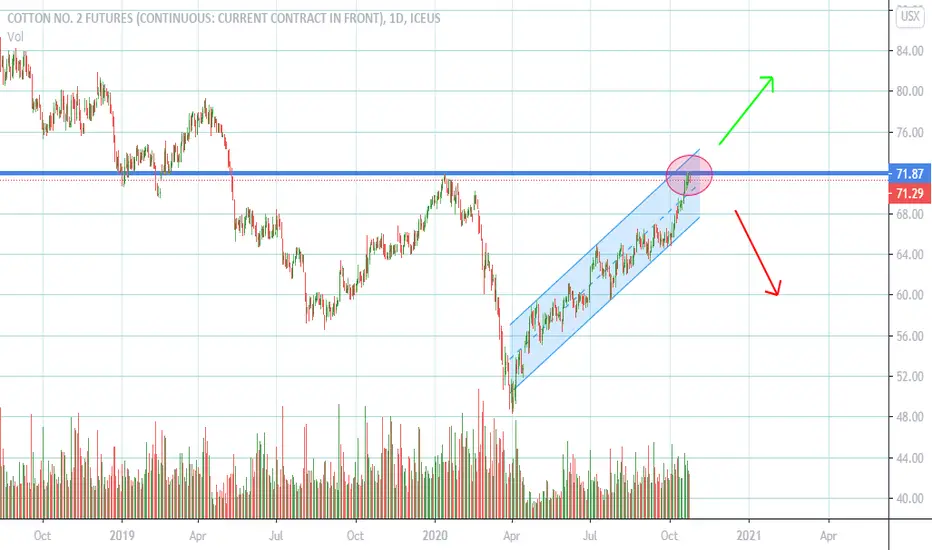
cotton (CT) in daily !!!Hi traders and investors , just waiting for the breaks of the resistance and the parallel channel
COTTON FUTURES (TT1!) DailyDates in the future with the greatest probability for a price high or price low.
The Djinn Predictive Indicators are simple mathematical equations. Once an equation is given to Siri the algorithm provides the future price swing date. Djinn Indicators work on all charts, for any asset category and in all time frames. Occasionally a Djinn Predictive Indicator will miss its prediction date by one candlestick. If multiple Djinn prediction dates are missed and are plowed through by same color Henikin Ashi candles the asset is being "reset". The "reset" is complete when Henikin Ashi candles are back in sync with Djinn price high or low prediction dates.
One way the Djinn Indicator is used to enter and exit trades:
For best results trade in the direction of the trend.
The Linear Regression channel is used to determine trend direction. The Linear Regression is set at 2 -2 30.
When a green Henikin Ashi candle intersects with the linear regression upper deviation line (green line) and both indicators intersect with a Djinn prediction date a sell is triggered.
When a red Henikin Ashi candle intersects with the linear regression lower deviation line (red line) and both indicators intersect with a Djinn prediction date a buy is triggered.
This trading strategy works on daily, weekly and Monthly Djinn Predictive charts.

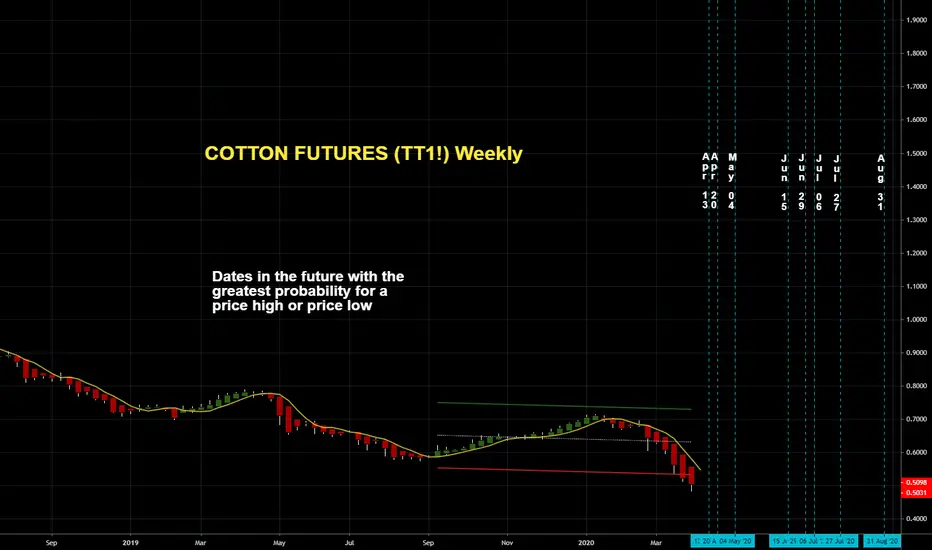
COTTON FUTURES (TT1!) WeeklyDates in the future with the greatest probability for a price high or price low.
The Djinn Predictive Indicators are simple mathematical equations. Once an equation is given to Siri the algorithm provides the future price swing date. Djinn Indicators work on all charts, for any asset category and in all time frames. Occasionally a Djinn Predictive Indicator will miss its prediction date by one candlestick. If multiple Djinn prediction dates are missed and are plowed through by same color Henikin Ashi candles the asset is being "reset". The "reset" is complete when Henikin Ashi candles are back in sync with Djinn price high or low prediction dates.
One way the Djinn Indicator is used to enter and exit trades:
For best results trade in the direction of the trend.
The Linear Regression channel is used to determine trend direction. The Linear Regression is set at 2 -2 30.
When a green Henikin Ashi candle intersects with the linear regression upper deviation line (green line) and both indicators intersect with a Djinn prediction date a sell is triggered.
When a red Henikin Ashi candle intersects with the linear regression lower deviation line (red line) and both indicators intersect with a Djinn prediction date a buy is triggered.
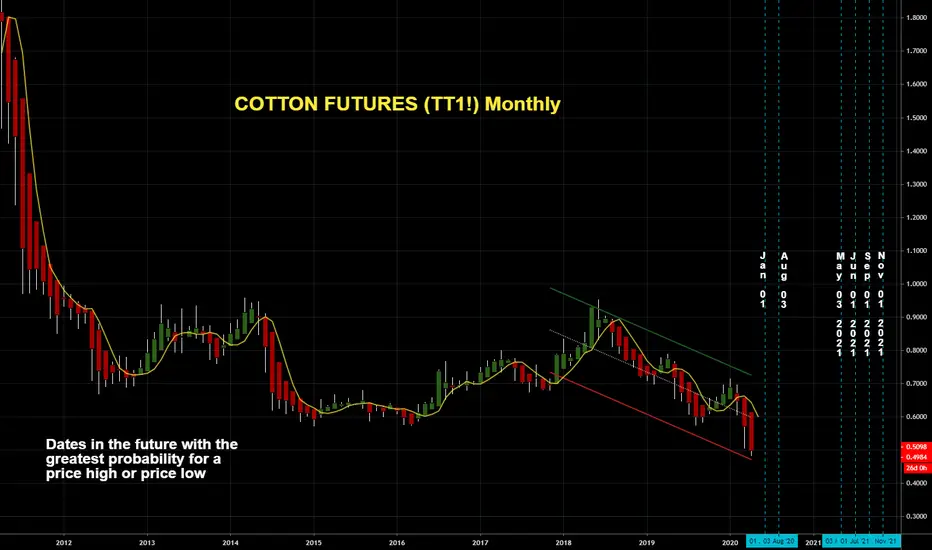
COTTON FUTURES (TT1!) MonthlyDates in the future with the greatest probability for a price high or price low.
The Djinn Predictive Indicators are simple mathematical equations. Once an equation is given to Siri the algorithm provides the future price swing date. Djinn Indicators work on all charts, for any asset category and in all time frames. Occasionally a Djinn Predictive Indicator will miss its prediction date by one candlestick. If multiple Djinn prediction dates are missed and are plowed through by same color Henikin Ashi candles the asset is being "reset". The "reset" is complete when Henikin Ashi candles are back in sync with Djinn price high or low prediction dates.
One way the Djinn Indicator is used to enter and exit trades:
For best results trade in the direction of the trend.
The Linear Regression channel is used to determine trend direction. The Linear Regression is set at 2 -2 30.
When a green Henikin Ashi candle intersects with the linear regression upper deviation line (green line) and both indicators intersect with a Djinn prediction date a sell is triggered.
When a red Henikin Ashi candle intersects with the linear regression lower deviation line (red line) and both indicators intersect with a Djinn prediction date a buy is triggered.
This trading strategy works on daily, weekly and Monthly Djinn Predictive charts.