COTTON QUICK TRADE: Low Risk, High Reward Setup!🚨 COTTON HEIST ALERT: Bullish Bank Robbery in Progress! (CFD/Commodity Raid Plan) 🚨
Thief Trader’s Master Loot Strategy – Long Entry, Escape Before the Cops Arrive!
🌟 Greetings, Fellow Market Bandits! 🌟
Hola! Bonjour! Hallo! Marhaba! 🤑💸 Money Makers & Midnight Robbers, it’s time to execute the COTTON COMMODITY HEIST with precision. Based on 🔥Thief Trading Style Analysis🔥, this is your VIP invite to the biggest bullish swipe of the season.
🔓 THE VAULT IS OPEN – ENTRY PLAN (LONG RAID)
📈 "Break the Lock & Loot!"
Ideal Entry: Buy limit orders within 15-30min pullbacks (swing lows/highs).
Pro Thief Move: Layer your entries (DCA-style) for maximum stealth.
Aggressive Robbers: Charge in directly if liquidity is high.
🚨 STOP-LOSS (ESCAPE ROUTE)
🛑 "Hide Your Loot or Get Busted!"
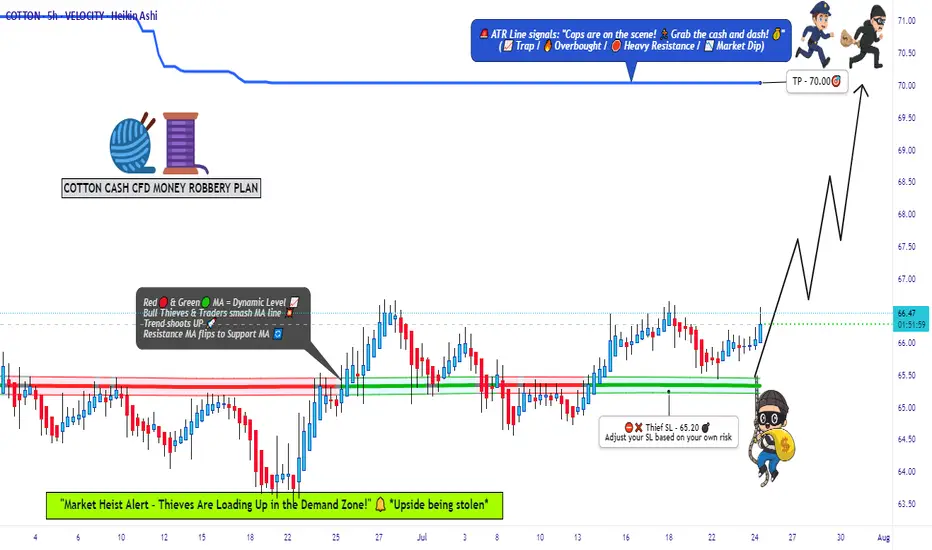
Place SL below the nearest swing low (5H MA @ 65.20).
Adjust based on your risk tolerance & loot size (multiple orders = tighter escape).
🎯 TARGET: CASH OUT BEFORE THE COPS ARRIVE!
🏴☠️ Take Profit Zone: 70.00 (or escape earlier if the market turns shaky!)
Scalpers: Trailing SL = your best ally. Stick to LONG-ONLY quick hits!
Swing Bandits: Ride the wave but don’t get greedy—exit before the pullback trap!
🔥 WHY THIS HEIST WILL WORK (BULLISH CATALYSTS)
🧵 Cotton’s Price Surge Fueled By:
Supply Squeeze (Storage/Inventory Data 📉).
COT Report Shows Big Money Going Long 🏦.
Seasonal Trends + Macro Sentiment Shift ☀️📈.
Intermarket Signals Aligning (Commodity Supercycle?).
(Full analysis? Check the FUNDAMENTALS & KLICKK! 👉🔗)
⚠️ WARNING: NEWS TRAPS & VOLATILITY AHEAD
📰 "Cops (News Events) Can Crash the Party!"
Avoid new trades during high-impact news (liquidity dries up = slippage risk!).
Lock profits with trailing stops—don’t let the market reverse-steal your gains!
💥 BOOST THIS HEIST – STRONGER GANG = MORE LOOT!
💖 "Smash the 👍 LIKE button to support the crew!"
More boosts = more heist plans (next target: OIL? GOLD? STOCKS?).
Daily profit raids await—follow & stay tuned! 🤝
🚀 See you at the escape zone, bandits!💨
🎯 FINAL THIEF TRADER RULE:
"Steal Fast, Exit Faster—No Prison Trades!" 🏃♂️💨
Cottonfutures
"COTTON CFD HEIST: Bullish Loot Before the Trap!"🔥 COTTON CFD HEIST: Bullish Loot & Escape Before the Trap! 🚨💰
🌟 Attention Market Robbers & Profit Pirates! 🌟
(Hola! Bonjour! Hallo! Marhaba!)
🔎 Strategy Based on THIEF TRADING ANALYSIS (Technical + Fundamental):
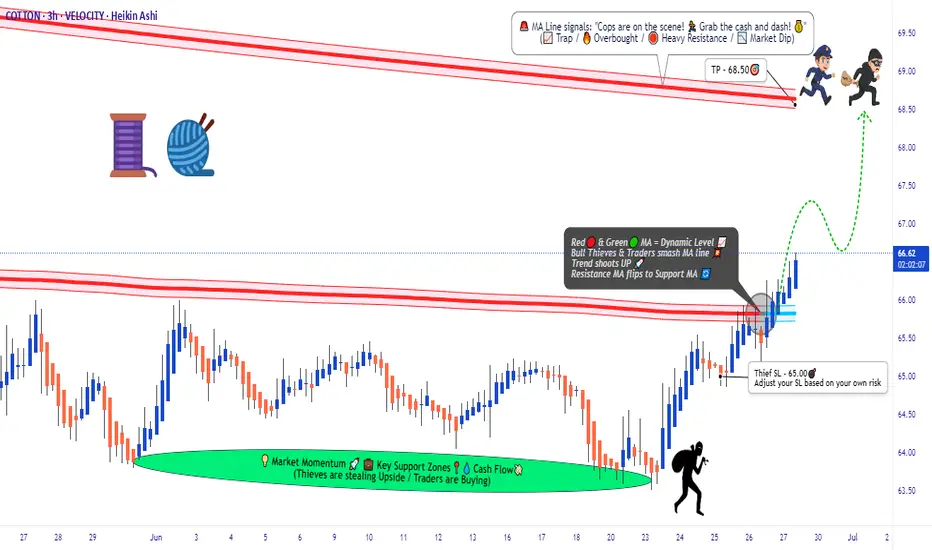
We’re staging a bullish heist on the 🧵 COTTON CFD market—time to grab the loot and exit before the bears ambush us near the Dangerous Red Zone (key resistance). Overbought? Maybe. A trap? Likely. But thieves don’t overstay—we escape with profits!
📌 ENTRY (Bullish Vault is Open!):
"SWIPE THE LOOT!" – Buy at current price OR set buy limits (15m/30m pullbacks).
Pro Tip: Strong hands enter now; cautious robbers wait for dips.
⛔ STOP LOSS (Safety Net):
Thief’s Rule: Set SL below nearest 4H swing low wick (~65.00).
Adjust based on your risk tolerance & position size.
🎯 TARGETS (Escape Routes):
Take Profit @ 68.50
Bail early if momentum fades! (Don’t be greedy—real thieves lock in gains.)
⚡ SCALPERS NOTE:
Longs only! Use trailing stops to protect profits.
No money? Join swing traders—this heist is teamwork!
📢 FUNDAMENTAL BACKUP:
Bullish drivers: COT Report, Macro Trends, Geopolitics, Seasonals.
Full analysis herre: 👉🔗 🌍📊
🚨 TRADING ALERTS:
News = Volatility! Avoid new trades during high-impact events.
Trailing SLs save heists. Lock profits before the market turns.
💥 BOOST THIS PLAN → STRONGER ROBBERY SQUAD → MORE GAINS!
(Like & Share to help us steal the market’s money daily! 🏴☠️💸)
Next heist coming soon—stay tuned, thieves! 🤫🚀
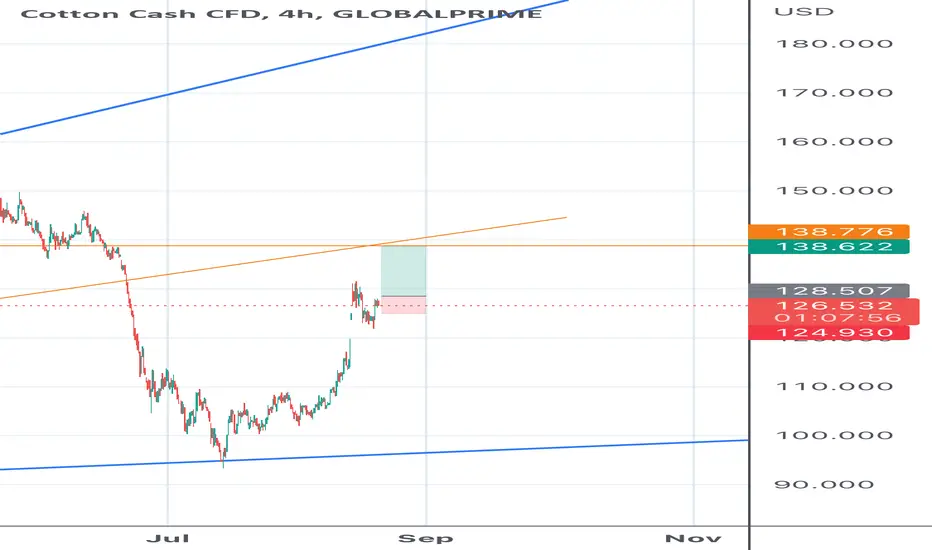
COTTON Cash CFD Commodities Market Bullish Heist Plan🌟Hi! Hola! Ola! Bonjour! Hallo!🌟
Dear Money Makers & Thieves, 🤑 💰🐱👤🐱🏍
Based on 🔥Thief Trading style technical and fundamental analysis🔥, here is our master plan to heist the COTTON Cash CFD Commodities Market market. Please adhere to the strategy I've outlined in the chart, which emphasizes long entry. Our aim is the high-risk Red Zone. Risky level, overbought market, consolidation, trend reversal, trap at the level where traders and bearish robbers are stronger. 🏆💸Book Profits wealthy and safe trade.💪🏆🎉
Entry 📈 : "The vault is wide open! Swipe the Bullish loot at any price - the heist is on!
however I advise placing Place Buy limit orders within a 15 or 30 minute timeframe. Entry from the most recent or closest low or high level should be in retest.
Stop Loss 🛑:
Thief SL placed at the recent / nearest low level Using the 2H timeframe (65.700) swing trade basis.
SL is based on your risk of the trade, lot size and how many multiple orders you have to take.
Target 🎯:
1st Target - 68.000 (or) Escape Before the Target
Final Target - 71.000 (or) Escape Before the Target
Scalpers, take note 👀 : only scalp on the Long side. If you have a lot of money, you can go straight away; if not, you can join swing traders and carry out the robbery plan. Use trailing SL to safeguard your money 💰.
📰🗞️Fundamental, Macro, COT, Sentimental Outlook:
COTTON Cash CFD Commodities Market is currently experiencing a bullish trend,., driven by several key factors.
🌳Fundamental Analysis
Supply and Demand: Global cotton production is expected to decline by 1.5% in 2024-25, while consumption is forecasted to increase by 2.5%.
Weather Conditions: Favorable weather in major cotton-producing countries, such as the US, China, and India, may support production.
🌳Macroeconomic Analysis
Global Economic Growth: The International Monetary Fund (IMF) forecasts global economic growth to slow down to 3.2% in 2024, which may impact cotton demand.
Trade Tensions: Ongoing trade tensions between the US and China may influence cotton trade and prices.
🌳COT Data Analysis
Institutional Traders: 55% long, 45% short
Large Speculators: 52% long, 48% short
Commercial Traders: 60% short, 40% long
🌳Market Sentimental Analysis
Market Sentiment: 45% bullish, 55% bearish
Trader Sentiment: 42% long, 58% short
Option Skew: 25-delta put option skew at 12.5
🌳Positioning Data Analysis
Bullish Trend: 40% likely.
Bearish Trend: 60% likely.
Neutral Trend: 10% likely.
🌳Overall Outlook
However, some analysts predict a bullish continuation, targeting 71.000. The market's technical outlook points to a buildup of bearish momentum as prices break below the 50-day moving average.
⚠️Trading Alert : News Releases and Position Management 📰 🗞️ 🚫🚏
As a reminder, news releases can have a significant impact on market prices and volatility. To minimize potential losses and protect your running positions,
we recommend the following:
Avoid taking new trades during news releases
Use trailing stop-loss orders to protect your running positions and lock in profits
📌Please note that this is a general analysis and not personalized investment advice. It's essential to consider your own risk tolerance and market analysis before making any investment decisions.
📌Keep in mind that these factors can change rapidly, and it's essential to stay up-to-date with market developments and adjust your analysis accordingly.
💖Supporting our robbery plan will enable us to effortlessly make and steal money 💰💵 Tell your friends, Colleagues and family to follow, like, and share. Boost the strength of our robbery team. Every day in this market make money with ease by using the Thief Trading Style.🏆💪🤝❤️🎉🚀
I'll see you soon with another heist plan, so stay tuned 🤑🐱👤🤗🤩

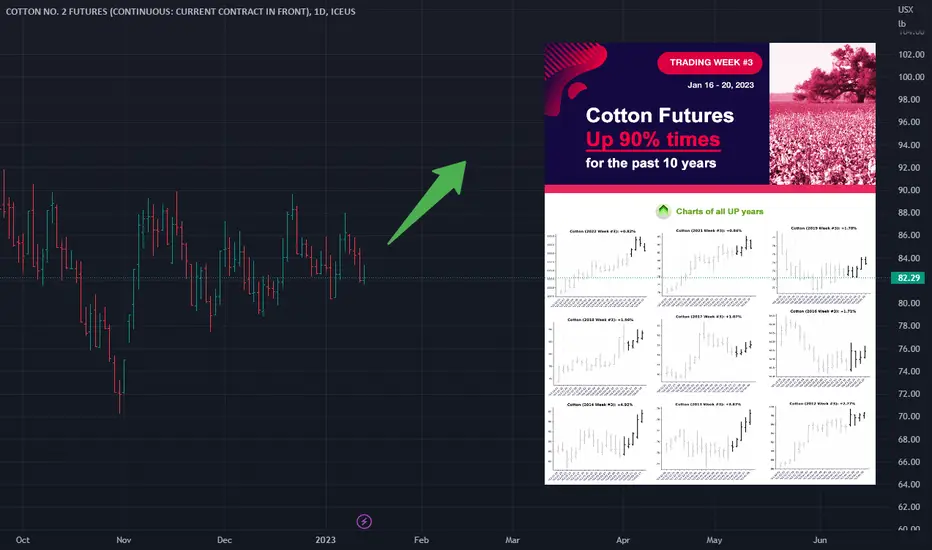
Trading Week #3, 2023: Cotton Futures Expected to be UPThis is Trading Week #3 (Jan 16-20) 2023.
Data from the past 10 years (2012-2022) shows that Cotton Futures was up 9 years (90%) of time.
Get ready to LONG on Monday!
U.S. 2022 Cotton Crop lowest since 2009
According to USDA’s August forecast of the 2022 cotton crop, U.S. production is projected at 12.6 million bales, considerably below last season’s final estimate of 17.5 million bales and the lowest crop estimate in 13 years. Compared with 2021, cotton harvested area is also forecast significantly (31 percent) lower, but a higher national yield limits a further production decline.
Based on the August forecast, 2022 cotton planted acreage is estimated at nearly 12.5 million acres—the area indicated in the June Acreage report and the highest in 3 years, as cotton prices heading into planting season were at historically high levels. However, drought conditions this season in the Southwest—the largest cotton region—is expected to reduce harvested area there dramatically. As a result, a substantially lower U.S. cotton harvested acreage estimate (7.1 million acres) is forecast, the smallest in over 150 years. However, the U.S. abandonment rate projection (43 percent) is the highest on record. The U.S. cotton yield is forecast at 846 pounds per harvested acre in 2022, slightly above the 3-year average.
Upland cotton production in 2022 is forecast at 12.2 million bales, 29 percent (5 million bales) below 2021 and the smallest crop since 2009. During the past 20 years, the August upland production forecast was above the final estimate 12 times and below it 8 times. Past differences between the August forecast and the final production estimates indicate a 2 out of 3 chance for the 2022 upland crop to range between 11 million and 13.3 million bales.
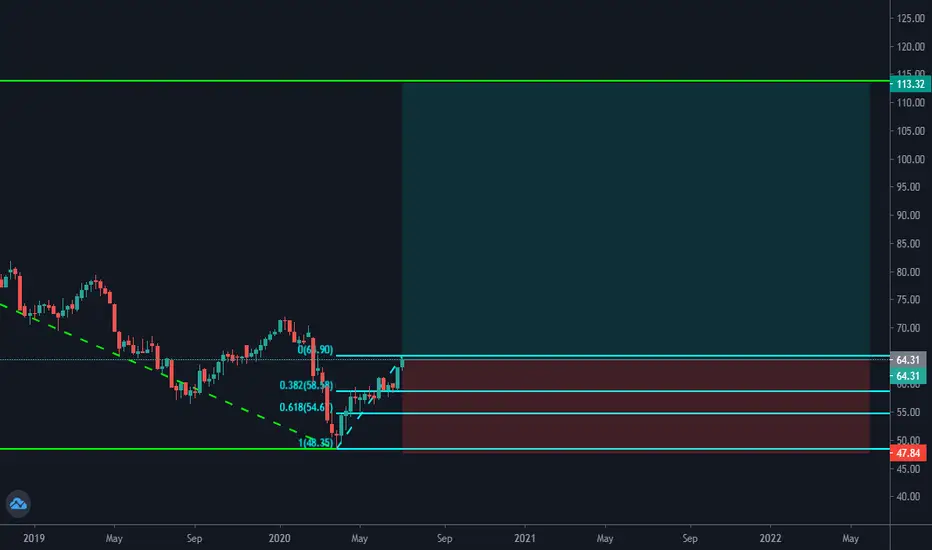
Optimal Short Entry For Cotton FuturesRisk/Reward here is insane. Optimal long-term short entry. This is the third time cotton has been at this level in 50 years. Use good risk management unless an anomaly occurs like it did in the 2011 spike. Don't risk more than 1 to 2 percent of your total account size.

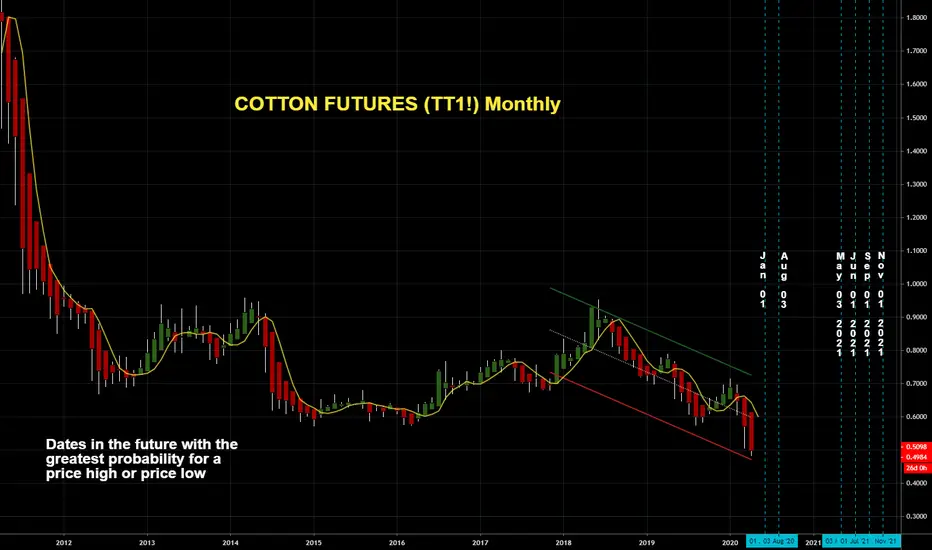
COTTON FUTURES (TT1!) DailyDates in the future with the greatest probability for a price high or price low.
The Djinn Predictive Indicators are simple mathematical equations. Once an equation is given to Siri the algorithm provides the future price swing date. Djinn Indicators work on all charts, for any asset category and in all time frames. Occasionally a Djinn Predictive Indicator will miss its prediction date by one candlestick. If multiple Djinn prediction dates are missed and are plowed through by same color Henikin Ashi candles the asset is being "reset". The "reset" is complete when Henikin Ashi candles are back in sync with Djinn price high or low prediction dates.
One way the Djinn Indicator is used to enter and exit trades:
For best results trade in the direction of the trend.
The Linear Regression channel is used to determine trend direction. The Linear Regression is set at 2 -2 30.
When a green Henikin Ashi candle intersects with the linear regression upper deviation line (green line) and both indicators intersect with a Djinn prediction date a sell is triggered.
When a red Henikin Ashi candle intersects with the linear regression lower deviation line (red line) and both indicators intersect with a Djinn prediction date a buy is triggered.
This trading strategy works on daily, weekly and Monthly Djinn Predictive charts.

COTTON FUTURES (TT1!) MonthlyDates in the future with the greatest probability for a price high or price low.
The Djinn Predictive Indicators are simple mathematical equations. Once an equation is given to Siri the algorithm provides the future price swing date. Djinn Indicators work on all charts, for any asset category and in all time frames. Occasionally a Djinn Predictive Indicator will miss its prediction date by one candlestick. If multiple Djinn prediction dates are missed and are plowed through by same color Henikin Ashi candles the asset is being "reset". The "reset" is complete when Henikin Ashi candles are back in sync with Djinn price high or low prediction dates.
One way the Djinn Indicator is used to enter and exit trades:
For best results trade in the direction of the trend.
The Linear Regression channel is used to determine trend direction. The Linear Regression is set at 2 -2 30.
When a green Henikin Ashi candle intersects with the linear regression upper deviation line (green line) and both indicators intersect with a Djinn prediction date a sell is triggered.
When a red Henikin Ashi candle intersects with the linear regression lower deviation line (red line) and both indicators intersect with a Djinn prediction date a buy is triggered.
This trading strategy works on daily, weekly and Monthly Djinn Predictive charts.