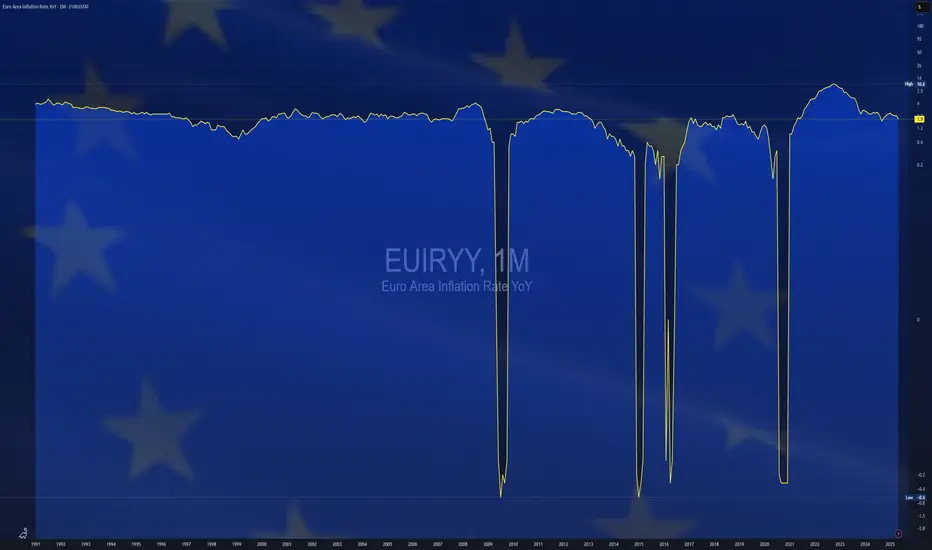
$EUIRYY -Europe CPI (July/2025)ECONOMICS:EUIRYY
July/2025
source: EUROSTAT
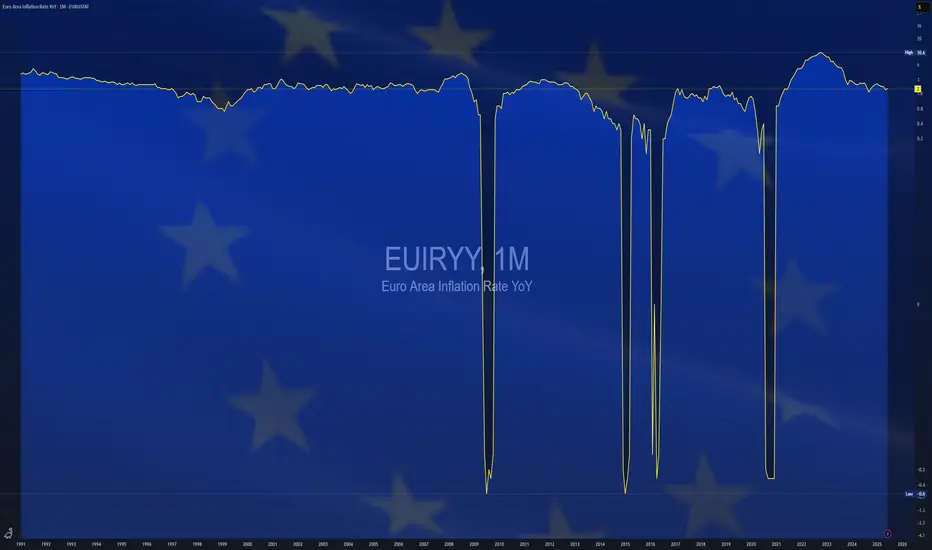
- Eurozone consumer price inflation held steady at 2.0% year-on-year in July 2025, unchanged from June but slightly above market expectations of 1.9%, according to preliminary estimates.
This marks the second consecutive month that inflation has aligned with the European Central Bank’s official target.
A slowdown in services inflation (3.1% vs 3.3% in June) helped offset faster price increases in food, alcohol & tobacco (3.3% vs 3.1%) and non-energy industrial goods (0.8% vs 0.5%).
Energy prices continued to decline, falling by 2.5% following a 2.6% drop in June.
Meanwhile, core inflation—which excludes energy, food, alcohol, and tobacco—remained unchanged at 2.3%, its lowest level since January 2022.
Cpidata
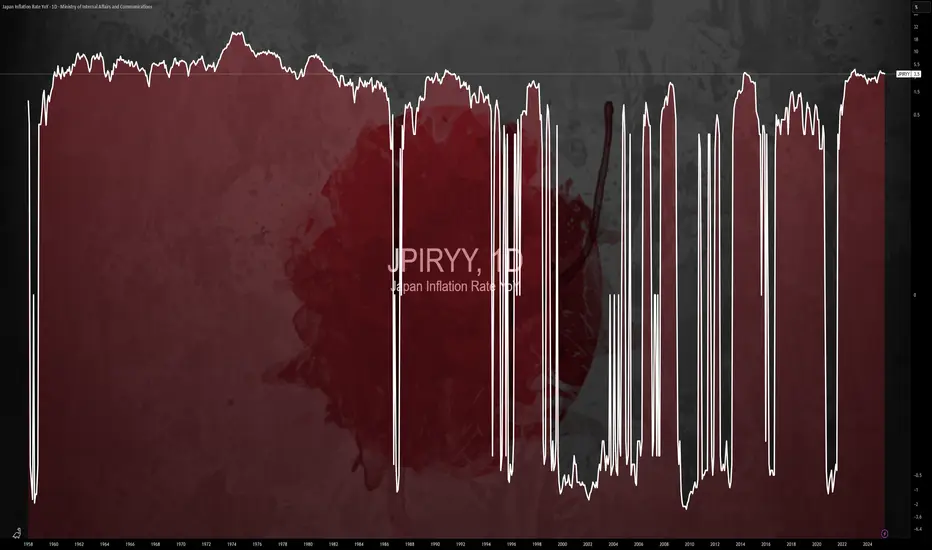
$JPIRYY -Japan Inflation Hits 7-Month Low (June/2025)ECONOMICS:JPIRYY 3.3%
June/2025
source: Ministry of Internal Affairs & Communications
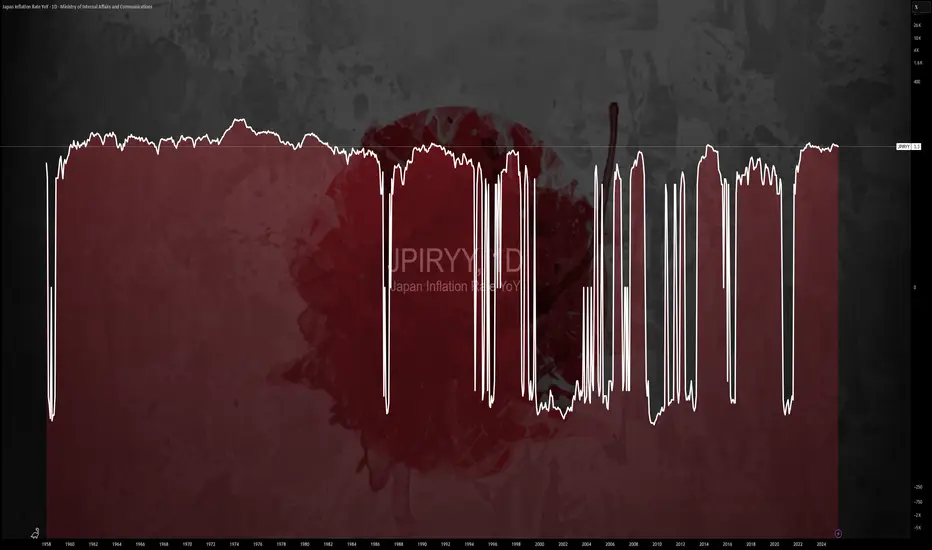
-Japan’s annual inflation rate eased to 3.3% in June 2025 from 3.5% in May, marking the lowest reading since last November, as a sharp slowdown in electricity and gas prices offset persistent upward pressure from rice.
Core inflation also matched the headline rate at 3.3%, pointing to a three-month low and aligning with expectations.
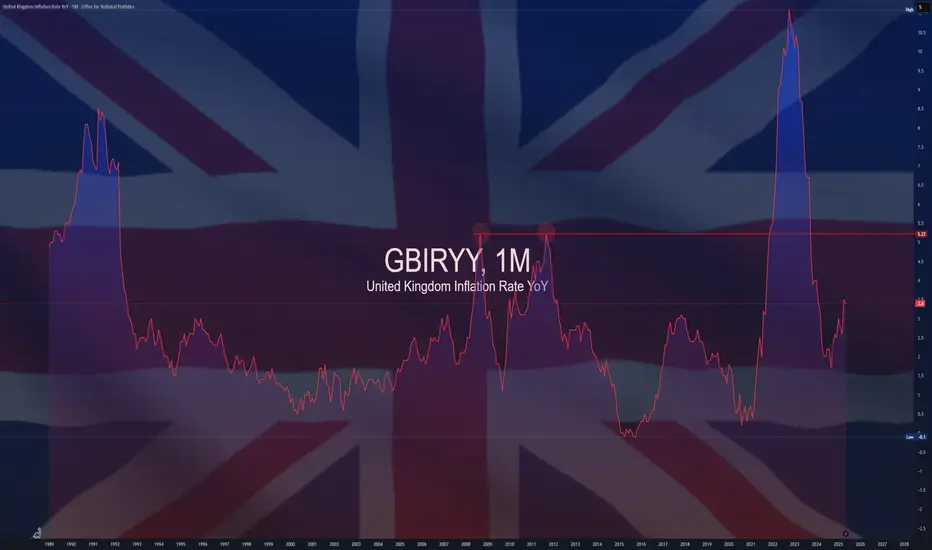
$GBIRYY - U.K Inflation Rises to a 2024 High (June/2025)ECONOMICS:GBIRYY
June/2025
source: Office for National Statistics
- The annual inflation rate in the UK rose to 3.6% in June, the highest since January 2024, up from 3.4% in May and above expectations that it would remain unchanged.
The main upward pressure came from transport prices, mostly motor fuel costs, airfares, rail fares and maintenance and repair of personal transport equipment.
On the other hand, services inflation remained steady at 4.7%.
Meanwhile, core inflation also accelerated, with the annual rate reaching 3.7%.

$USIRYY -U.S Inflation Rate Seen Rising for 2nd Month (June/2025ECONOMICS:USIRYY
June/2025
source: U.S. Bureau of Labor Statistics
- The annual inflation rate in the US likely accelerated for the second consecutive month to 2.7% in June, the highest level since February, up from 2.4% in May.
On a monthly basis, the CPI is expected to rise by 0.3%, marking the largest increase in five months.
Meanwhile, core inflation is projected to edge up to 3% from 2.8%. Monthly core CPI is also anticipated to climb 0.3%, up from 0.1% in May, marking its sharpest increase in five months.

1507 a bull trend back to Gold Hello traders,
Gold has returned back above EMAs on daily chart.
On 4h chart, there is a chance for it to break through last top level to make a new high up to 3438 .
Take a good use liquidity of CPI of US today.
You could get a great result of that.
GOOD LUCK!
LESS IS MORE!

$CNIRYY -China's Inflation Data (June/2025)ECONOMICS:CNIRYY
June/2025
source: National Bureau of Statistics of China
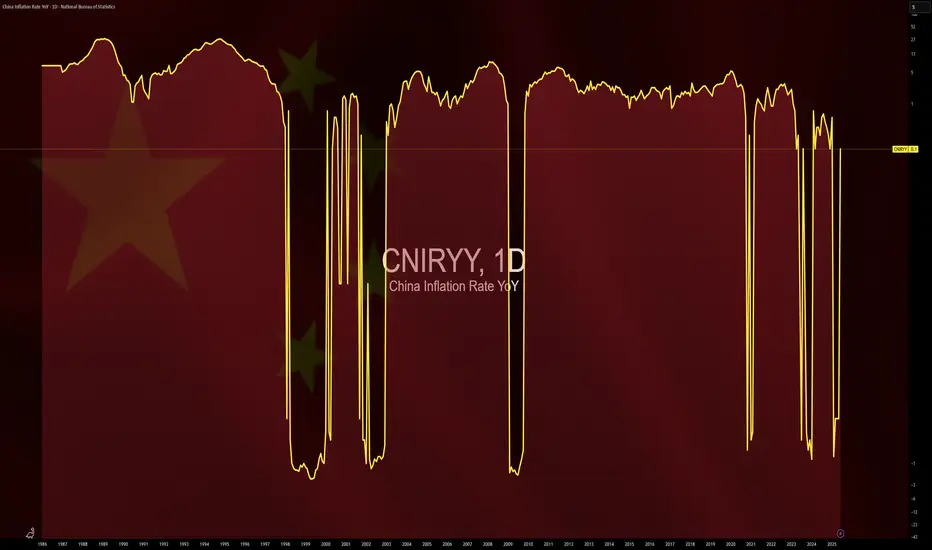
- China’s consumer prices rose by 0.1% yoy in June 2025,
reversing a 0.1% drop in the previous three months and surpassing market forecasts of a flat reading.
It marked the first annual increase in consumer inflation since January, driven by e-commerce shopping events, increased subsidies for consumer goods from Beijing, and easing trade risks with the U.S.
Core inflation, which excludes volatile food and fuel prices, rose 0.7% yoy, marking the highest reading in 14 months and following a 0.6% gain in May.
On a monthly basis, the CPI fell 0.1%, after May's 0.2% drop, pointing to the fourth monthly decline this year.
$EUIRYY - Europe CPI (June/2025)ECONOMICS:EUIRYY 2%
June/2025
source: EUROSTAT
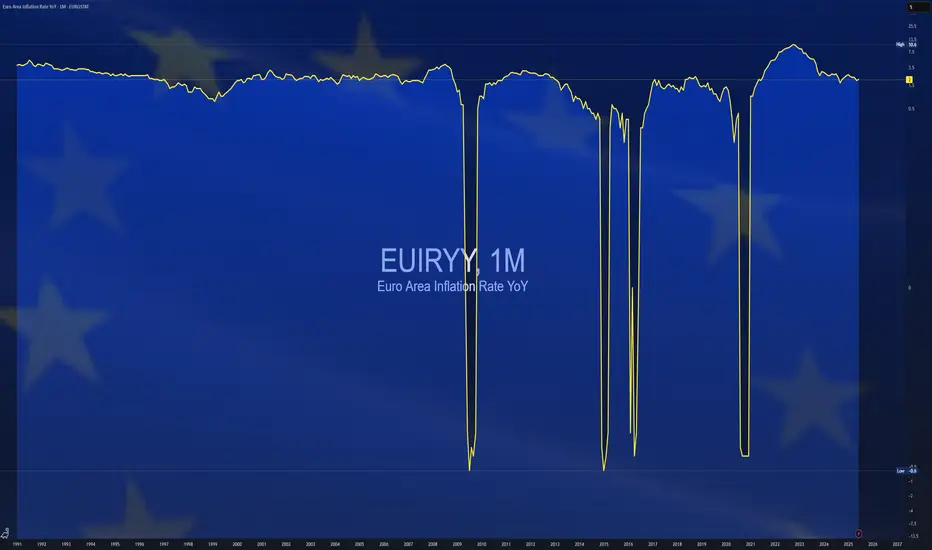
- Eurozone consumer price inflation rose slightly to 2.0% year-on-year in June 2025, up from May’s eight-month low of 1.9% and in line with market expectations, according to a preliminary estimate.
The figure aligns with the European Central Bank’s official target.
Among major economies, inflation in Germany unexpectedly declined, while France and Spain saw modest increases and Italy’s rate held steady.
$JPIRYY -Japan CPI (May/2025)ECONOMICS:JPIRYY
May/2025
source: Ministry of Internal Affairs & Communications
- Japan's annual inflation rate edged down to 3.5% in May 2025 from 3.6% in the previous two months, marking the lowest level since November.
Price growth eased for clothing (2.6% vs 2.7% in April), household items (3.6% vs 4.1%), and healthcare (2.0% vs 2.2%), while education costs fell further (-5.6%). In contrast, inflation held steady for transport (2.7%) and miscellaneous items (1.3%), but accelerated for housing (1.1% vs 1.0%), recreation (3.0% vs 2.7%), and communications (1.9% vs 1.1%).
Meanwhile, prices of electricity (11.3% vs 13.5%) and gas (5.4% vs 4.4%) remained elevated.
On the food side, prices increased by 6.5%, staying at the slowest pace in four months, though rice prices soared over 100%, underscoring the limited impact of government efforts to rein in staple food costs.
Meanwhile, the core inflation accelerated to 3.7% from 3.5% in April, reaching its highest level in over two years, ahead of the summer election.
Monthly, the CPI rose 0.3%, after a 0.1% gain in April.
GBIRYY - U.K Inflation (May/2025)ECONOMICS:GBIRYY
May/2025
source: Office for National Statistics
-The annual inflation rate in the UK edged down to 3.4% in May 2025 from 3.5% in April, matching expectations.
The largest downward contribution came from transport prices (0.7% vs 3.3%), reflecting falls in air fares (-5%) largely due to the timing of Easter and the associated school holidays, as well as falling motor fuel prices.
Additionally, the correction of an error in the Vehicle Excise Duty series contributed to the drop; the error affected April’s data, but the series has been corrected from May.
Further downward pressure came from cost for housing and household services (6.9% vs 7%), mostly owner occupiers' housing costs (6.7% vs 6.9%).
Services inflation also slowed to 4.7% from 5.4%. On the other hand, the largest, upward contributions came from food and non-alcoholic beverages (4.4% vs 3.4%), namely chocolate, confectionery and ice cream, and furniture and household goods (0.8%, the most since December 2023).
Compared to the previous month, the CPI rose 0.2%.
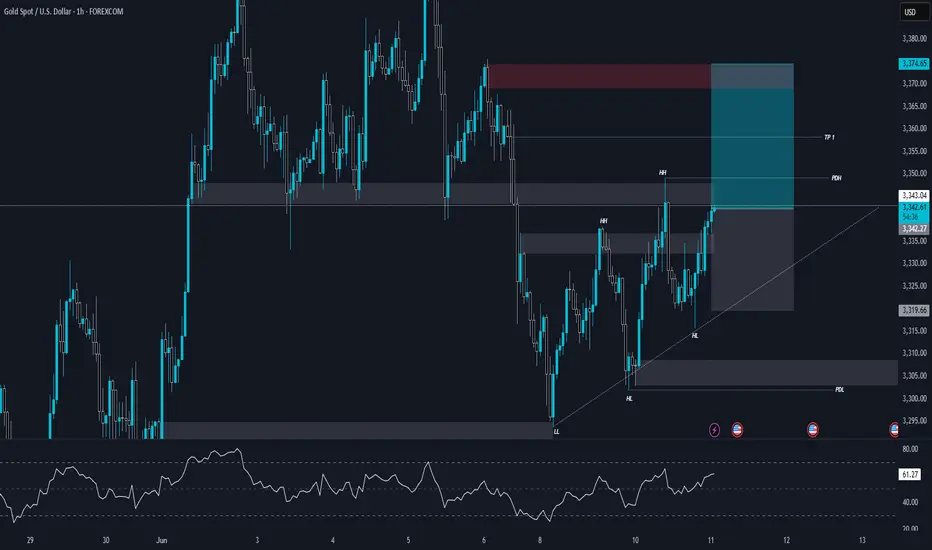
XAUUSD | 1H Chart Analysis | Uptrendurrently, Gold (XAUUSD) is showing bullish momentum after breaking previous market structure to the upside. Price has formed a clear Higher Low (HL) and Higher Highs (HH), indicating that short-term structure has shifted into an uptrend.
🔼 Key Technical Observations:
The previous LL (Lower Low) got broken, and price created a new HL, showing buyer pressure.
The bullish structure is supported by an ascending trendline.
Price is currently trading near PDH (Previous Day High) and approaching a key supply/resistance zone (highlighted in red).
RSI is still not in extreme zones but steadily climbing, showing strength in the current bullish move.
📊 Current Market Structure:
Shift from previous downtrend into short-term uptrend.
Formation of clear HL & HH.
Price respecting trendline support.
Clean bullish break of internal resistance levels.
📌 Potential Scenarios:
Scenario 1 (Bullish Continuation):
If price holds above the PDH and supply zone gets broken, we may see continuation toward TP1 and higher.
Scenario 2 (Rejection & Short-term Pullback):
If price faces strong rejection from the current supply zone, short-term retracement is possible toward the previous demand zones or trendline support.
Possible pullback zones: 3340 → 3320 → 3310 area.
✅ Bias: Short-Term Bullish
As long as price holds above the HL zone and trendline, bulls are in control. But keep an eye on price reaction around current supply zone for any signs of weakness or reversal.
$EUIRYY - Europe CPI below 2% Target (May/2025)ECONOMICS:EUIRYY 1.9%
May/2025
source: EUROSTAT
- Eurozone CPI eased to 1.9% year-on-year in May 2025,
down from 2.2% in April and below market expectations of 2.0%.
This marks the first time inflation has fallen below the European Central Bank’s 2.0% target since September 2024, reinforcing expectations for a 25 basis point rate cut later this week and raising the possibility of additional cuts.
A key driver of the deceleration was a sharp slowdown in services inflation, which dropped to 3.2% from 4.0% in April, its lowest level since March 2022.
Energy prices continued to decline, falling by 3.6% year-on-year, while inflation for non-energy industrial goods held steady at 0.6%.
In contrast, prices for food, alcohol, and tobacco accelerated, rising 3.3% compared with 3.0% the previous month.
Meanwhile, core inflation, which excludes volatile food and energy components, slipped to 2.3%, the lowest reading since January 2022. source: EUROSTAT
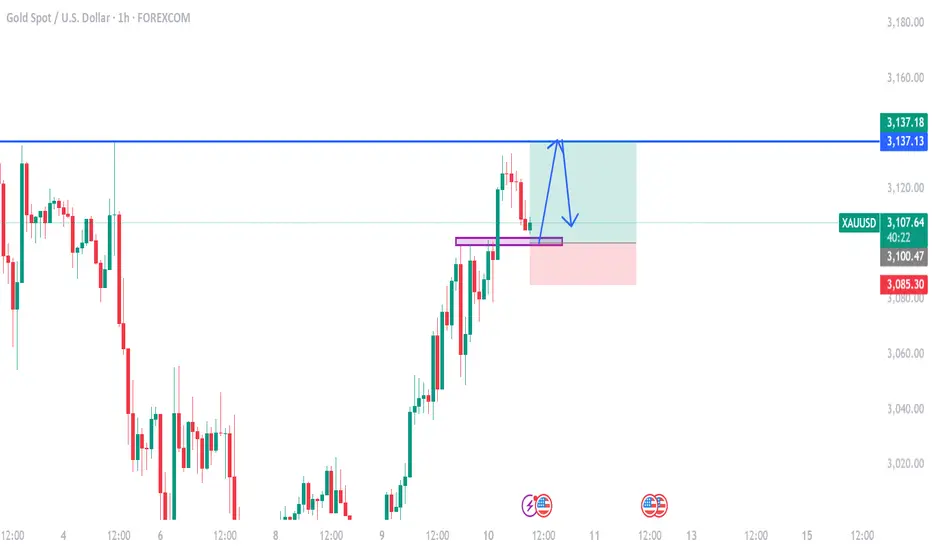
gold on buy till 3137#XAUUSD price have breakout 3100 once more now its will reach the ATH which will decline again on sell.
Firstly we buy at the rectangle 3100-3102 on multiple breakout first, target 3137 TP, SL 3085.
Above 3137 have bearish decline which will drop the price back but multiple breakout above 3137 will reach the ATH.
GOLD 1H CHAR ROUTE MAP & TRADING PLAN FOR THE WEEKGOLD 1H Chart – 12th Feb 2025
Dear Traders,
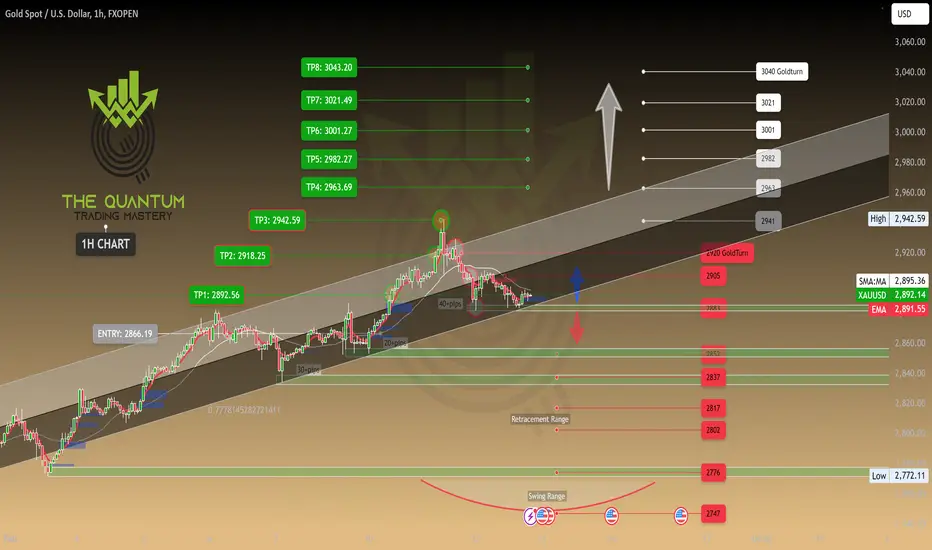
Here’s the latest 1H chart analysis, outlining key levels and targets for the week.
Gold is currently trading between two critical levels, with a gap above 2905 and below 2883. A confirmed EMA5 crossover and lock above or below these levels will indicate the next price direction. Until then, expect price fluctuations as these levels are tested repeatedly.
Keep in mind that Inflation and CPI data are due today and tomorrow. While fundamental analysis plays a role in predicting gold's movement, our advanced technical analysis is essential for precise entry and exit points during these volatile geopolitical times.
Our strategy remains focused on buying dips and monitoring key levels to identify potential bounce opportunities. Stay sharp!
Resistance Levels: 2905, 2920, 2942, 2963, 2982, 3001, 3021, 3043
Support Levels: Gold Turn Levels : 2883, 2852, 2837, 2817,
Retracement Range: 2802 - 2817
Swing Range: 2747
EMA5 (Red Line) Analysis:
* Currently fluctuating between 2886 and 2905
* EMA5 positioning will be crucial in determining the next trading direction.
Bullish Targets:
EMA5 cross and lock Above 2905 → will open the following bullish Target 2920 ✅Done
EMA5 cross and lock Above 2920 → will open the following bullish Target 2942 ✅Done
EMA5 cross and lock Above 2942 → will open the following bullish Target 2963
EMA5 cross and lock Above 2963 → will open the following bullish Target 2982
EMA5 cross and lock Above 2982 → will open the following bullish Target 3001
EMA5 cross and lock Above 3001 → will open the following bullish Target 3021
EMA5 cross and lock Above 3021 → will open the following bullish Target 3043
Bearish Targets:
EMA5 cross and lock Below 2883 → will open the following bearish Target 2852
EMA5 cross and lock Below 2852 → will open the following bearish Target 2837
EMA5 cross and lock Below 2837 → will open the following bearish Target 2817
EMA5 cross and lock Below 2817 → will open the following bearish Target 2802 (Retracement Range)
EMA5 cross and lock Below 2802 → will open the following bearish Target 2747 (Swing Range)
Trading Plan:
* Stay bullish and buy pullbacks from key levels.
* Avoid chasing tops—focus on buying dips.
* Use smaller timeframes for entries at Goldturn levels.
* Aim for 30–40 pips per trade for optimal risk management.
* Each level can yield 20–40+ pips reversals.
Trade with confidence and discipline. Stay tuned for our daily updates! Please support us with likes, comments, and follows to keep these insights coming.
📉💰 The Quantum Trading Mastery
Post CPI Update: NAS still very well behaved in this range🎯 As previously mentioned, we were expecting the bearish imbalance to be the magnetic area. Price in this chart is behaving just as it should. As well with bearish imbalance or FVG, we expect price to find it as a trend continuation point.
If we do not get a bullish close over the previous day, we will expect a swift attack of the lows in the coming PA.
Share this with a friend who's learning 🧠

XAUUSD Trade Log
🚨 XAUUSD Long Zones: High-Probability Entries 🚨
Gold has been on a strong move, but smart money doesn’t chase— TDV traders wait for prime entries.
🔴 First Long Entry: A swing long opportunity where I’ll get in but move to break-even fast. Why? The real opportunity is lower.
🔴 Bad Boy Entry: This is where I’ll scale in aggressively, with:
✅ Daily discount level
✅ Weekly Break of Structure (BOS)
✅ Confluence of daily & hourly levels
For risk:
⚡ 2% for prop traders
⚡ 5% for personal equity accounts
This is how TDV plays the game—strategic, calculated, and ahead of the herd.

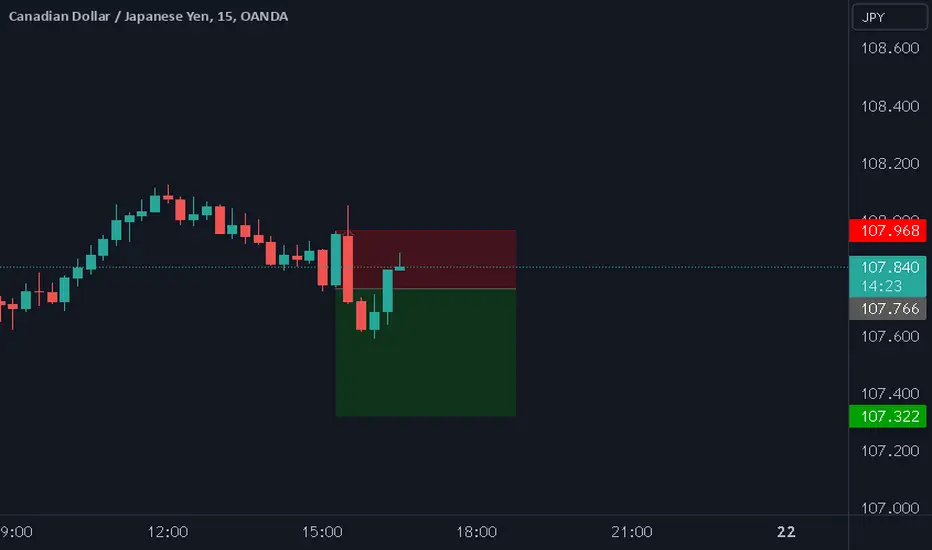
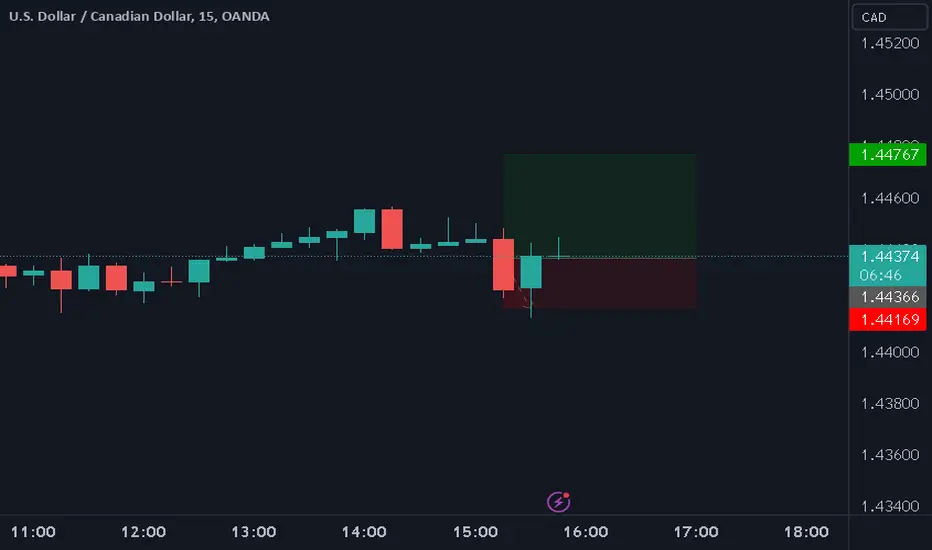
CADJPY SHORT: CAD CPI ON TAPCanada December CPI 1.8% y/y versus 1.9% expected.
Due to the above result, we are looking to sell the CADJPY due to the potentially weaker Canadian dollar.
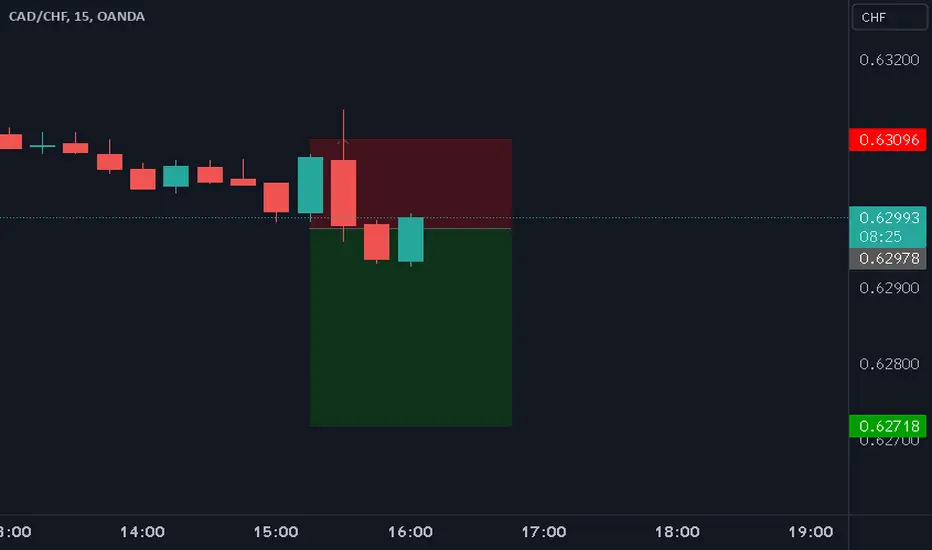
CADCHF SHORT: CAD CPI ON TAPCanada December CPI 1.8% y/y versus 1.9% expected.
Due to the above result, we are looking to sell the CADCHF due to the potential weaker Canadian dollar.
USDCAD LONG: CAD CPI ON TAP Canada December CPI 1.8% y/y versus 1.9% expected.
Due to the above result, we are looking to buy the USDCAD due to potential weaker Canadian dollar.
BTC: QUICK UPDATE AND CPI EFFECT!!🚀 Hey everyone! 👋
If you’re loving this analysis, smash that 👍 and follow for more high-value trade setups that actually deliver! 💹
BTC Update:
Bitcoin is currently forming a symmetrical triangle while holding the $90k support like a champ! 🚀 It’s bounced back strongly so far and is trading within the triangle—but the next big move hinges on the CPI data.
📊 Here’s what to watch for:
Bullish Scenario: If CPI data is favorable, we could see a breakout from this triangle, potentially driving BTC to a new all-time high (ATH)! 🌕
Bearish Scenario: If CPI data disappoints, BTC could revisit the $90k support. A break below $90k might take us to $85k or even lower levels.
💡 Key takeaway: Stay cautious and wait for the CPI data to give us a clear direction.
🔥 What’s your take? Are we heading for a new ATH or dipping below $90k first? Let us know your thoughts in the comments!
Let’s navigate this market together—stay tuned for updates! 🚀

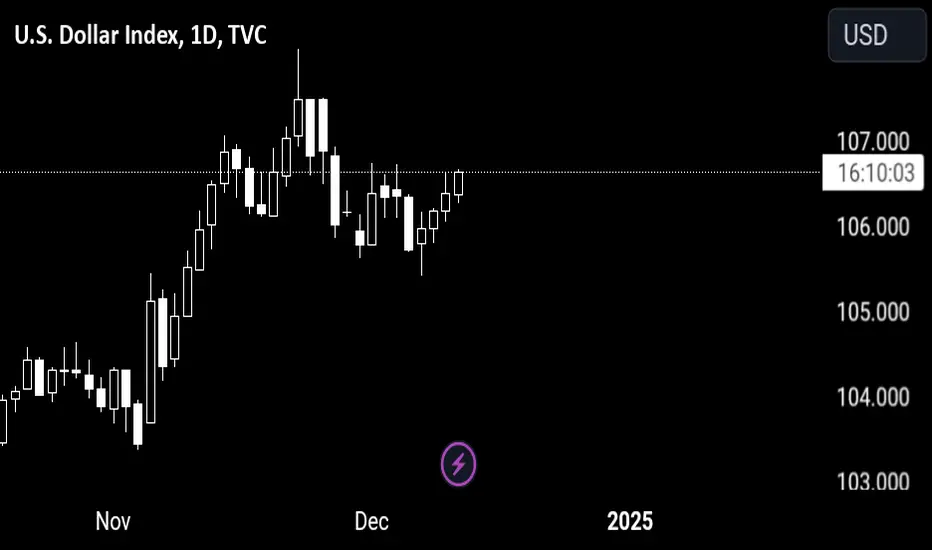
US CPI, WHERE WILL THE DOLLAR GO NEXTTrading Plan
BASELINE
C urrent Short-Term Sentiment Bias :
- The market is currently focused on the upcoming US inflation report and its implications for Federal Reserve policy.
- There is an 86% probability priced in for a 25-basis-point rate cut by the Fed later this month⁵.
- The dollar index is steady around 106.3, reflecting cautious sentiment ahead of the inflation data.
SURPRISE
Outcome That Will Surprise the Markets Based on the Baseline:
- Lower-than-expected inflation data : This would likely lead to USD selling as markets fully price in the anticipated rate cut. A good trade in this scenario would be GBP/USD longs, leveraging the pound's net long positions and the USD's net short positions.
- Higher-than-expected inflation data : This would likely result in USD strength as investors adjust their rate cut expectations. A good trade in this scenario would be EUR/USD sells, based on stronger USD institutional positioning compared to the EUR.
BIGGER PICTURE
Does This Outcome Change the Larger Macro-Fundamental Bias?
- Lower-than-expected inflation : Reinforces the expectation of continued easing by the Fed, aligning with the current macro-fundamental bias of a dovish Fed aiming to support economic growth and achieve its 2% inflation target.
- Higher-than-expected inflation : Could shift the macro-fundamental bias towards a more cautious Fed, potentially delaying further rate cuts and maintaining a tighter monetary policy stance to combat persistent inflation⁷⁸.
Notes
- Macro-fundamental bias: The market expects the Fed to continue easing monetary policy to support economic growth and achieve its inflation target. This expectation is based on the Fed's dual mandate and recent economic indicators.
- Short-term sentiment bias: The market is currently focused on the upcoming US inflation report and its potential impact on Fed policy, as well as interest rate decision.
EURNZD Short: Eurozone CPI +2.3% vs +2.3% y/y expEurozone November preliminary CPI +2.3% vs +2.3% y/y expected.
This is in line with estimates which is a short due to no surprises.

BTC: What's Ahead After the CPI Data?BITSTAMP:BTCUSD Bitcoin is up 0.52%, trading at $61,317.96 after the CPI data, which slightly exceeded expectations. Despite the minor increase, the overall trend shows continued sidelined behavior, reflecting the pattern of the past months. Here's a breakdown of the technical indicators:
1D Timeframe
Oscillators: Mixed signals, with the Relative Strength Index (14) at 45.86 (neutral), but Momentum (10) and Commodity Channel Index (20) indicate buying potential. However, MACD Level signals sell.
Moving Averages: Most short- and mid-term moving averages suggest a sell, while the 200-period Simple Moving Average remains bullish at $60,020.79, suggesting long-term support.
2H Timeframe
Oscillators: Mostly neutral, but Momentum (10) gives a buy signal. The MACD Level and Moving Averages are in sell mode, reflecting short-term weakness.
Moving Averages: Clear sell signals dominate across the board, with only the Simple Moving Average (10) giving a buy at $60,868.83.
30-Minute Timeframe
Oscillators: The shorter timeframe shows mixed signals, with a buy from the MACD Level (12, 26) and Simple Moving Average (20), while Momentum (10) and Bull Bear Power remain bearish.
Moving Averages: Short-term moving averages are providing conflicting signals, showing that there may be a short-term consolidation phase.
Summary:
The indicators reflect a market still in consolidation with minor price recovery. Despite occasional buy signals on short-term charts, the overall trend remains cautious. Traders should keep an eye on potential breakouts from this sidelined range, but aggressive entries should be avoided for now.
Disclaimer: This is not financial advice. Always do your own research before making any investment decisions.
