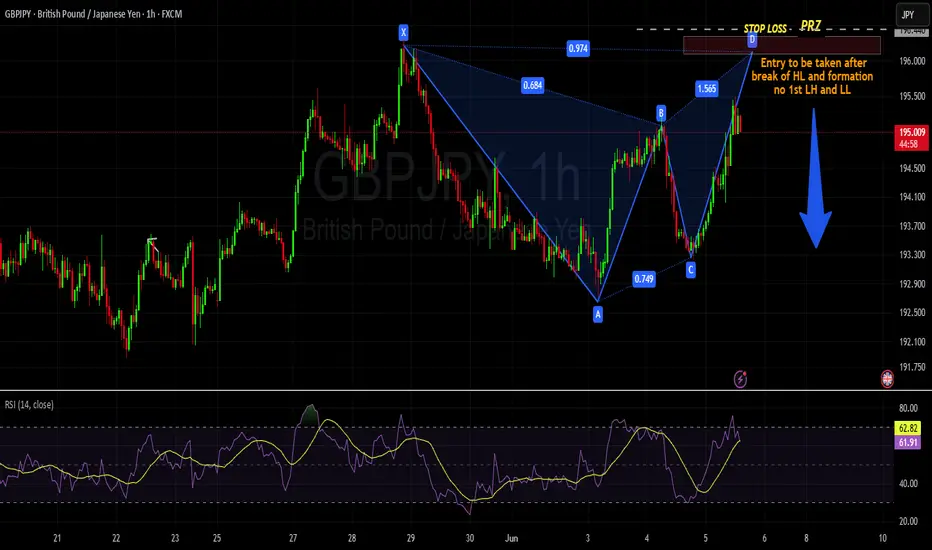
GBPJPY - Bullish CRAB / BAT reversal pattern formation Either the market break the X point of remain under the X :
if the market breaks the X point and reaches FIB level of 1.618 then its a CRAB pattern, otherwise if the market remain below the X point with fib levels 0.886 then its a BAT pattern.
Nonetheless, both pattern depict reversal and we expect our entry after confirmation from followed by series of LH and LL.
Entry and SL points are mentioned.
Crabharmonicpattern
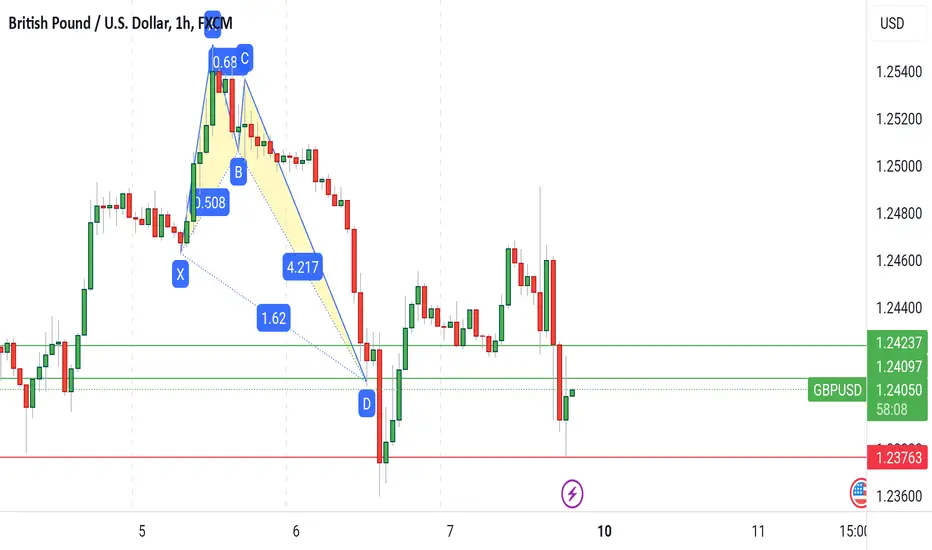
GBPUSD BULLISH CRABHarmonic Pattern Trading Strategy:
1. Combine patterns with 2-3 confirmations (e.g., MA, BB, RSI, Stoch) for increased accuracy.
2. Implement proper risk management.
3. Limit exposure to 3% of capital per trade.
4. Exercise caution: Not every Harmonic Pattern presents a good trading opportunity.
5. Conduct thorough diligence and analysis before trading.
Disciplined approach = Enhanced edge.
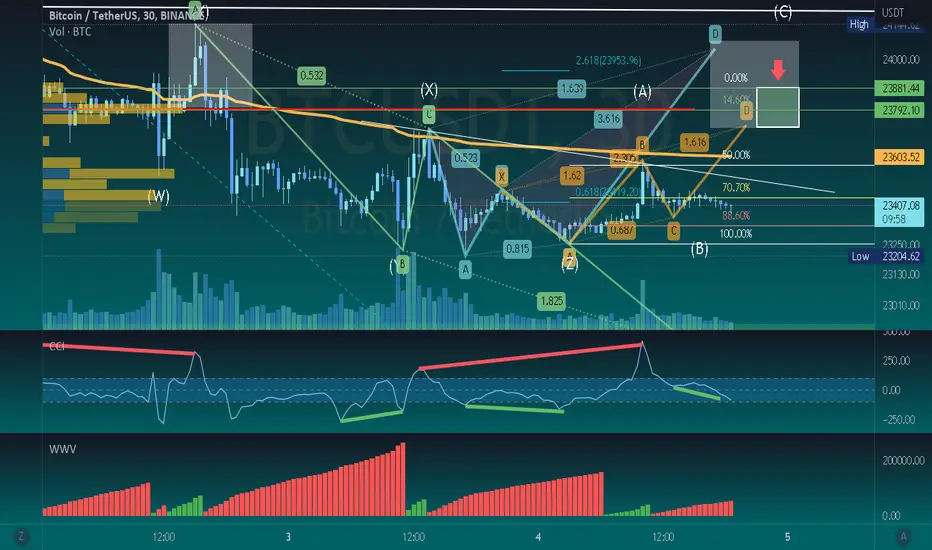
BTCUSD Pullback to Neckline Accomplished. 50% drawdown expectedSigns of reversal, market structure choppy. Flat correction in consecutive double three zig-zags on the upper boundary of a macro diagonal after an complete impulsive wave; lower highs with decrease of volume, showing lack of confidence by the buyers-side, as shown on Weis Wave Volume indicator; overbought condition.
Harmonic patterns: potential bearish Crab leading to supply. If price action don't reach this area breaking volume POC, a least a back-test to VWAP from the higher high can be occur, leading by an 3-Drives pattern. High possibility of a POC back-test @ preferencial 14,6% Fibonacci retracement zone. Plus AB=CD bearish projection leading to the micro demand zone.
Strong hidden bearigh divergence on CCI oscillator.
Short position swing perspective: if price broke weekly pivot level @ 21009 with strength, possible intermediary target @ 18229 support. The price can retrace to the pivot.
MACRO
Weekly price action: the price made a strong bearish candlestick pattern Harami Cross.
The price is trading in a broadening structure like a ending diagonal formation.
Weekly scenario: price pulled back to neckline from the major Head and Shoulders back-testing the VWAP from ATH. In a potential fractal from the 1st test of this VWAP, in which the same Harami Cross performed in an overbought condition, showing that a strong supply was reached.
In addiction to the fractals, I've selected the local choppy structure and calculated the pivots by the sum of high+low+close:3, resulting in a key level exposed, in which price retraces before continue the decline in an impulsive bearish leg-Down.
Expectation: possible lower low if a throw-over occurs in a breaking of the expanding diagonal structure. this can be lead price to touch the same 88,6% Fibonacci level as occurred historically in all corrections. Therefore, a drawndown of 50% to the 11k level seems strongly possible,
---------------------
Bitcoin is about to complete it's first Wave 1 Grand Super Cycle bull run, in which actual point seems to be forming a ending diagonal of 5th impulse wave.