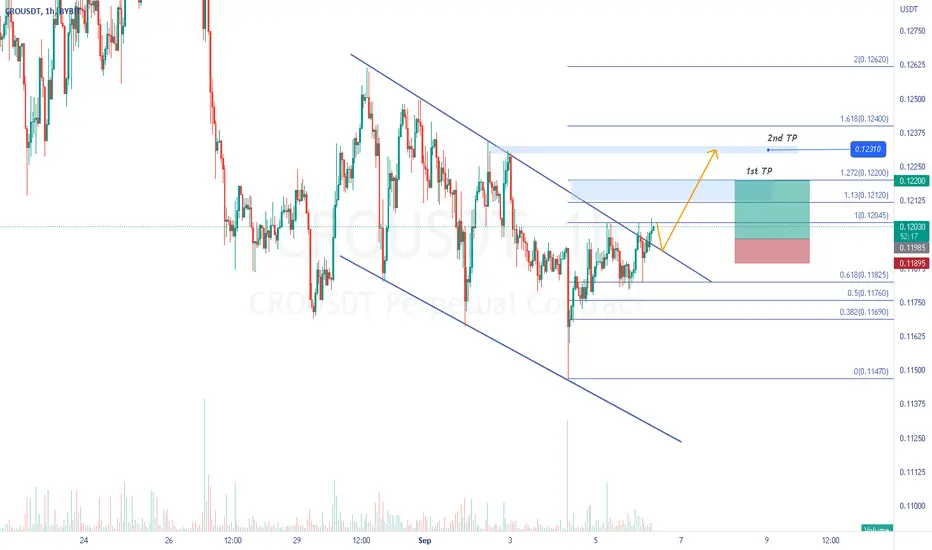
CRO - Buying SignalBYBIT:CROUSDT
1H time frame
-
CRO already boke out the downtrend line, there are two candles with long lower shadow, which stand for good supoort for CRO.
Try to long it when retest the upper downtrend line and we can target 0.1212, 0.122, 0.1231
Stop loss if hit 0.11895
CROUSDT

CRO - You Know Nothing Bears Analysis:
- Support & Resistance
- Order Block Flow
- Supply & Demand
- Trend Line
T1: Target 1
T2: Target 2
T3: Target 3
Red Arrow: Minor Correction
Green Arrow: Continuation Bounce
Opinion:
CRO has finished its correction and will now start its bull run

CRO / USDT Short on 1H IntervalHello everyone, let's take a look at the 1H CRO to USDT chart as you can see the price is moving below the local uptrend channel.
Let's start by setting goals for the near future that we can consider:
T1 = $ 0.1548
T2 = $ 0.1555
T3 = $ 0.1560
T4 = $ 0.1566
and
T5 = $ 0.1573
Now let's move on to the stop loss in case of further market declines:
SL1 = $ 0.1541
SL2 = $ 0.1533
SL3 = $ 0.1525
SL4 = $ 0.1521
and
SL5 = $ 0.1516
Looking at the CHOP indicator, we can see that in the 1H range we have very little energy and the MACD indicator shows a local downward trend.

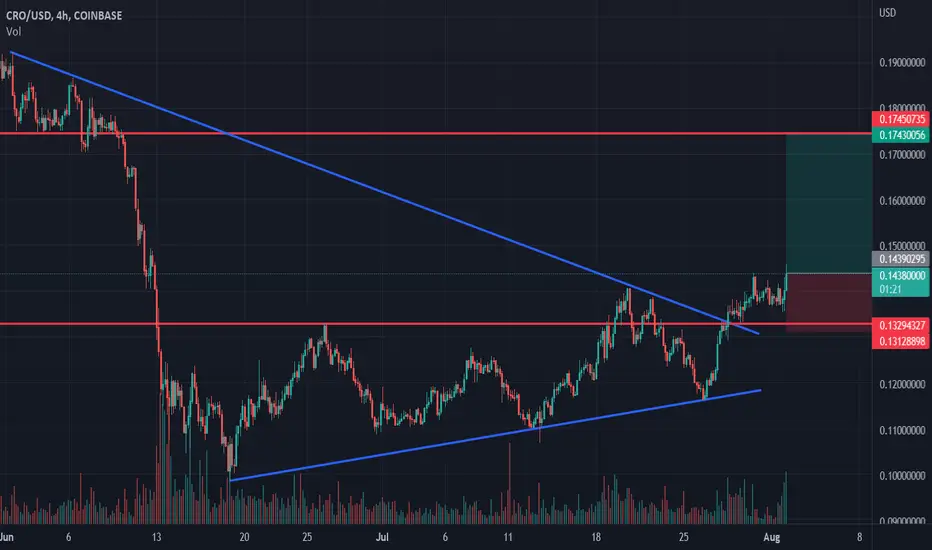
Cronos longCronos broke trough the resistance level. Asset broke trough the descending trendline. Bullish movement to resistance level at 0.1743 is possible.
CRO - 4H Reversal The CRO price is now on the top of the channel, which could be strong resistance. As you see, there is a long candle at the end of the bull run, so that it could be an exhaustion gap.
The price trend has been reversed three times by this pattern in this channel.

CRO/USDT Short Daily with good targets Hello everybody, I'm not Boris but lets talk about my new ideas
So CRO in daily is bearish
My first target is 0.09
The second target is 0.078
And the last one , small chance 0.050-0.066
Thanks and enjoy
Hasta la vista, baby
CRO short Entry Range, Take Profits and Stop LossCRO/USDT short
Entry Range: $0.11 - 0.13
Price Target 1: $0.10
Price Target 2: $0.08
Price Target 3: $0.06
Stop Loss: $0.14
the CRO short

FTM continues the local uptrend.Hello everyone, let's take a look at the 1D CRO to USDT chart as you can see that the price has returned above the local uptrend despite its decline.
Let's start by setting goals for the near future that we can consider:
T1 = $ 0.1081
T2 = $ 0.1109
T3 = $ 0.1140
and
TT4 = $ 0.1181
Now let's move on to the stop loss in case of further market declines:
SL1 = $ 0.1061
SL2 = $ 0.1046
SL3 = $ 0.1031
SL4 = $ 0.1011
and
SL5 = $ 0.0984
Looking at the CHOP indicator, we can see that in the 1D range most of the energy has been used, while the MACD indicator shows a local upward trend.

CRO re-testing the support line before breaking itCRO has the opportunity to stay in the uptrend if it doesn't;t break the support line, otherwise it will need more time before to break the possible ascending triangle.
CROUSDT ANALYSISThe price range of the specified range
Broken face up⬆️
Specified prices are expected
The target is CRO✅

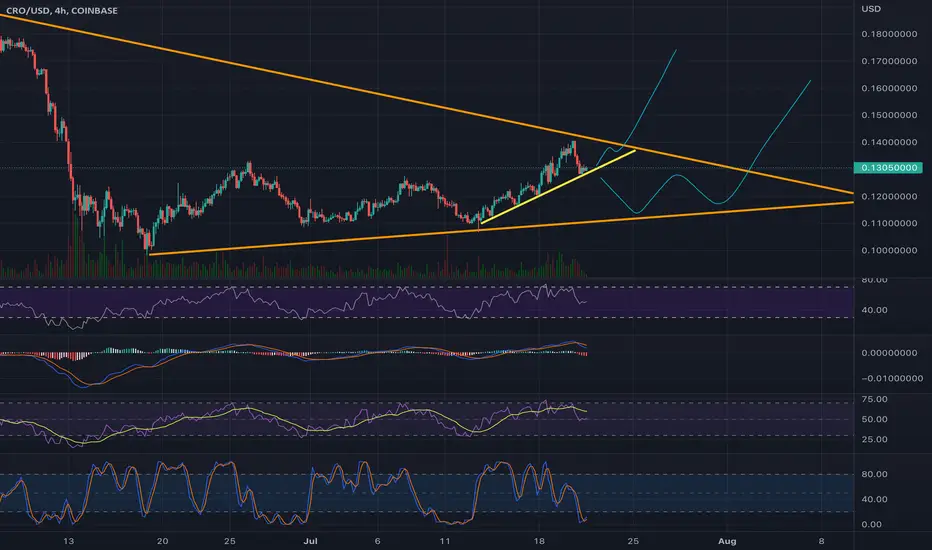
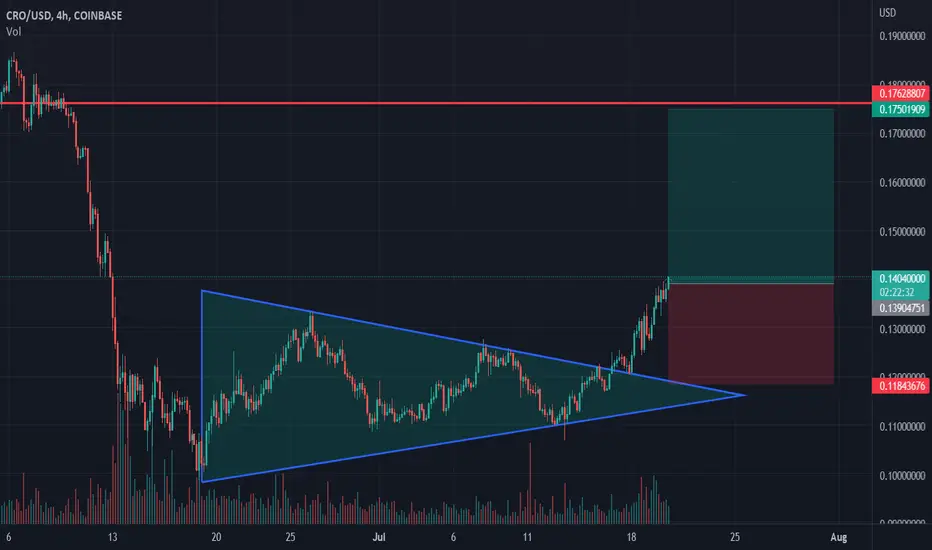
CRONOS longSymmetrical triangle on CRONOS chart is broken up. Bullish movement to resistance level at 0.175 is expected to happen.
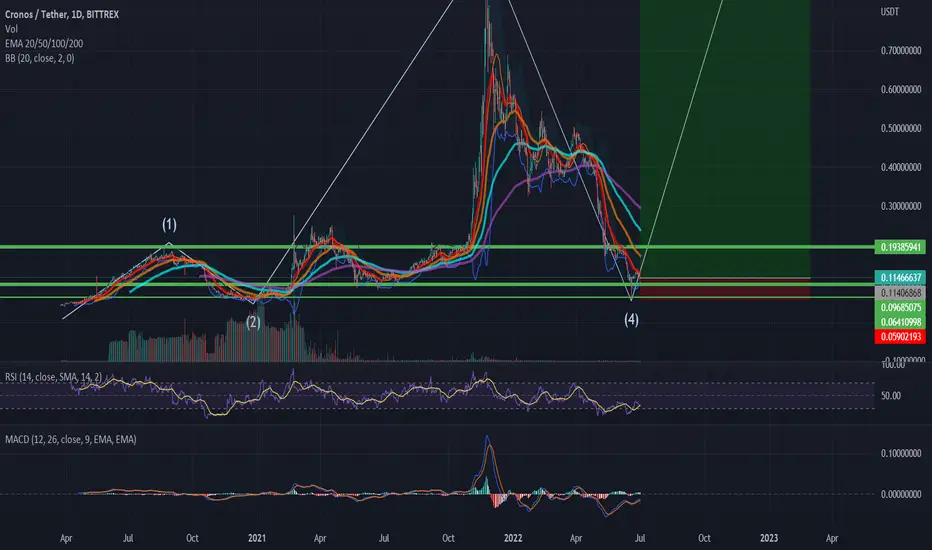
CRO/USDTesting/tracking elliot wave theory. Please do not trade off idea without S/L. Not financial advice.
RR: 25
Possible upside: 1200%
Possible downside: 48%
The bottom for CRO is in. 99.99% sure.
If you take a look at the wave (4) bottom it touched the price around 0.06. It went a bit under the support line. This is a prime example of what I meant by getting stop hunted. When they are looking to take out players who places stop losses on support lines they will go a bit right under to trigger your stop loss.
The stop loss I have placed on this chart goes a bit further than that. 0.055
Wave 2 bottomed around 0.048
0.06 is really close to 0.048 so I'm 99.99% sure the bottom for CRO is in. If we go anywhere near 0.048 this chart is invalid.
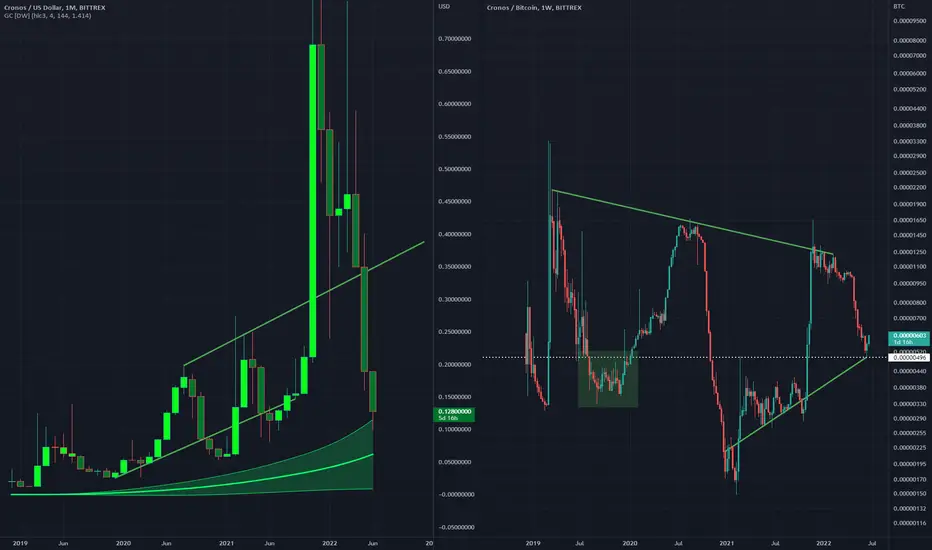
CRO AnalysisOn the left we an see price hitting 0.5 fib which has been previously seen as a support area, also aligning well with the green uptrend line
On the right the Gaussian Channel indicator shows the middle band as a point of support, price on this BTC pair is just above this Middle Band right now

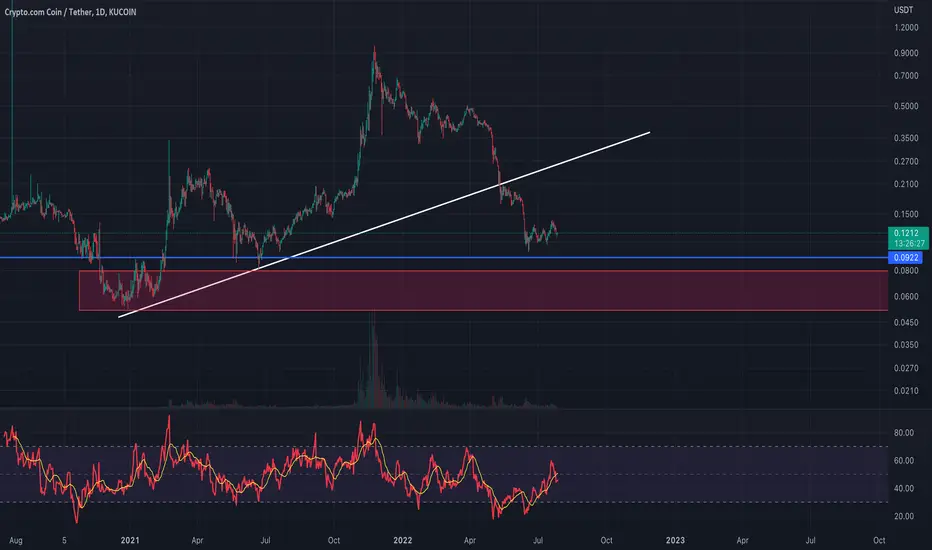
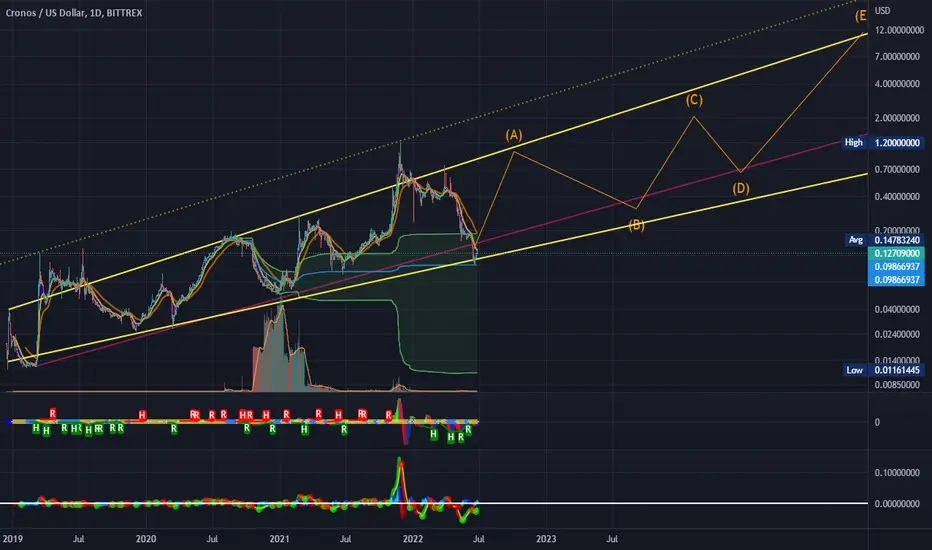
CRO following prior path along long term support lines. Hello you beautiful trader you!
Copied the Elliot wave forward and outlined some long term channels. Excess bleeds to either side, but here's to hopium eh?!
This is until crypto either depegs from the US Stock Market or BTC finds a functional bottom.
CRO - Gaussian Upper BandCROUSD chart on left, CROBTC chart on right
The USD pair can be seen to be touching the top of the channel, this provides a possible bounce and recovery point
While the BTC pair has poised itself right in the middle of a seemingly triangle structure, which has some fair supports (shown in the green box and along the white line)
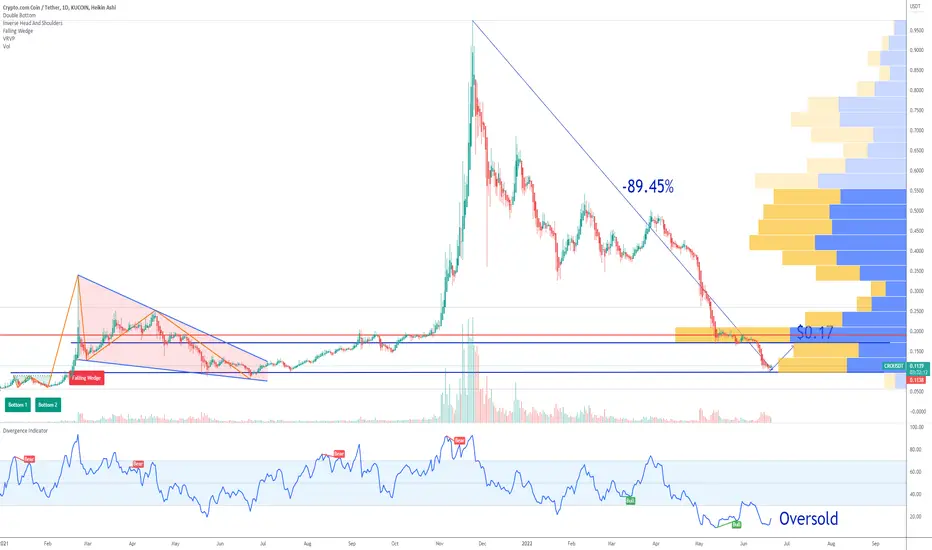
CRO Oversold at SupportIf you haven`t sold CRO at the top:
Then you should know that it has retraced 89.45% and is now oversold at a support level.
I expect a bounce to the $0.17 resistance before heading lower this year.
Looking forward to read your opinion about it.
LOCAL REFUND OF THE PRICE CROHello everyone, let's take a look at the 4H CRO to USDT chart as you can see the price is moving below the local downtrend line.
Let's start with setting targets for the near future that we can take into account:
T1 = $ 0.1081
T2 = $ 0.1109
T3 = $ 0.1140
and
T4 = $ 0.1181
Now let's move on to the stop loss in case of further market declines:
SL1 = $ 0.1061
SL2 = $ 0.1046
SL3 = $ 0.1031
SL4 = $ 0.1011
and
SL5 = $ 0.0984
Looking at the CHOP indicator, we can see that at the 4H interval, the energy slowly begins to increase, while the MACD indicator indicates a local upward trend.

CRO LongHello Traders, here is the full analysis for CRO , let me know in the comment section below if you have any questions.
The ellipse could represent a possible zone with good risk/reward to accumulate long position.
Please note that all the information and publications hera are not meant to be, and do not constitute, financial, investment, trading, or other types of advice or recommendations. What you will find here, are only views of a Cat passionate about Finance.

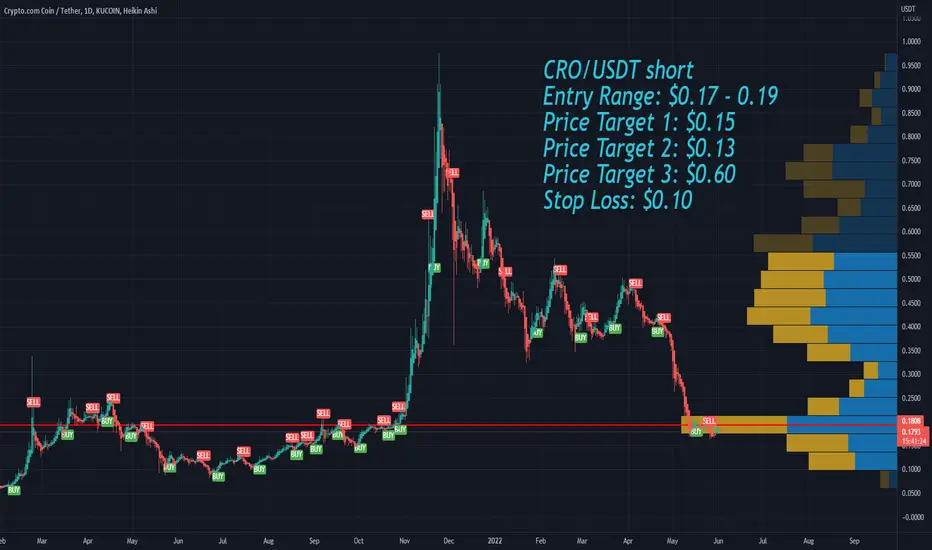
CRO short Entry Range, Take Profits and Stop LossCRO/USDT short
Entry Range: $0.17 - 0.19
Price Target 1: $0.15
Price Target 2: $0.13
Price Target 3: $0.60
Stop Loss: $0.10
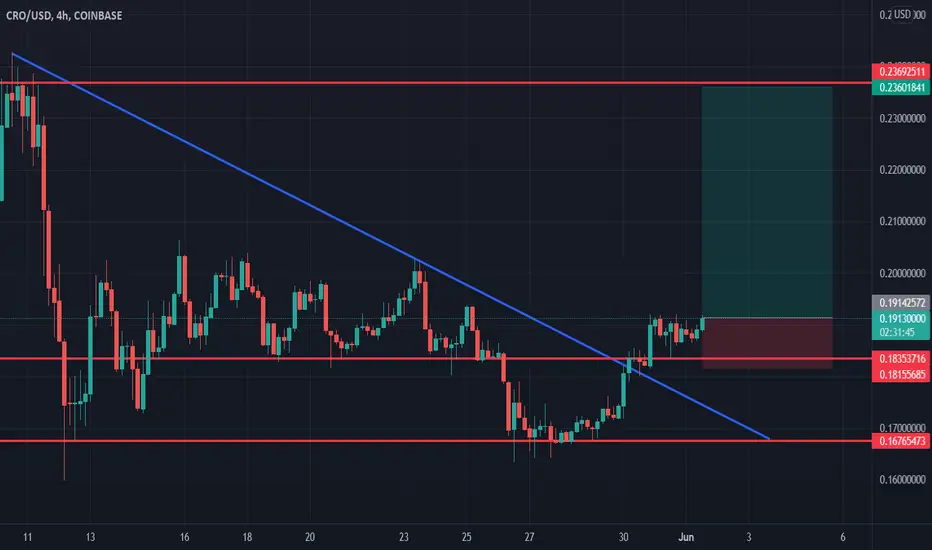
Cronos longCronos broke trough the descending trendline. Asset broke trough the resistance level. Bullish movement to resistance level at 0.236 is expected to happen.
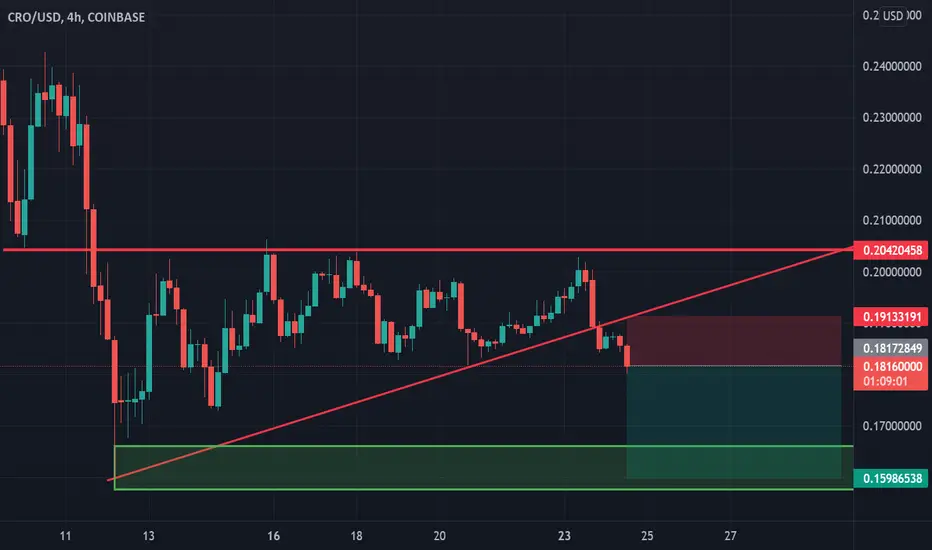
short CRO$CRO broke through the ascending trendline. Bearish trend is expected to continue and reach the support level at 0,1913$
CRO - 1D4H chart for CRO
support zones & resistance zones
Information purposes only
Like if u like chart
@Cringeego
