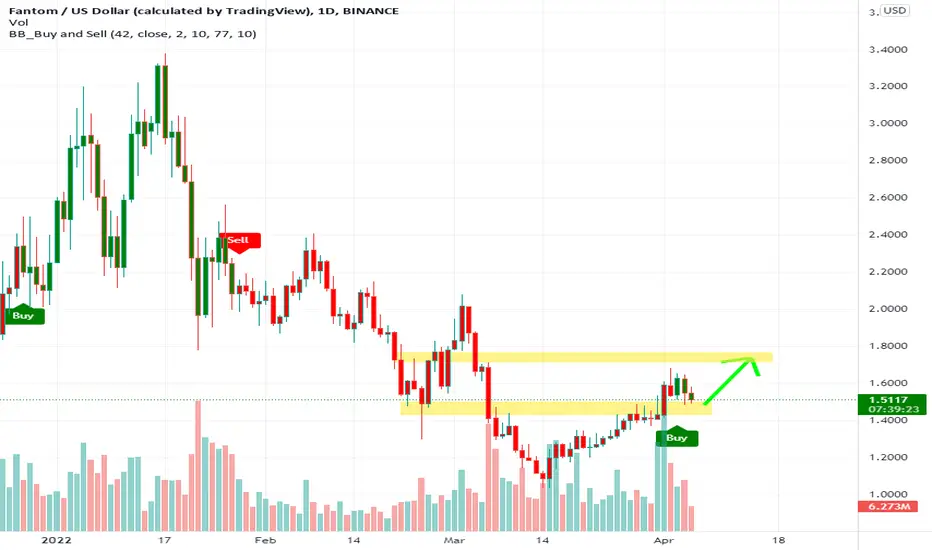
Fantom GOING BULLISH!! 🚀🚀💣💣BINANCE:FTMUSD
Fantom will provide you significant gains these coming months!! 🚀 🚀 🚀
For a steady profit set your take profit limit @ 15% on your entry
Don't follow others advice but follow technical based analysis!
- David van Delden
Next Level Quantum Trading - www.financeimperial.weebly.com
CRPTOCURRENCY
XRP trapped between a rock and a hard placeXRP is trapped inside a wedge/pennant/flag and is also squeezed betwen the 200 EMA and the 50 EMA.
Interestingly if we look at the daily time frame the price is above the 50 EMA and below the 200 EMA but if we switch to the H4 time frame the price is above the 200 EMA but below the 50 EMA.
So what does this potentially mean?
The 200 EMA on the H4 time frame is strong support and suggests that price will climb from current levels and take out the 50 EMA.
SHould it do that then we should see the price on the daily time frame take out the 200 EMA which it did last week but couldn't stay there.
Overall the picture looks BULLISH and I expect XRP to head north from these levels.
There are barriers ahead but if the price can take out the 200EMA on the daily then I expect price to break north of the flag and this could be an explosive move.
this could open up a path to the 1.0000 handle over the next few days and weeks.

XRP Wide view update Signals are looking bullish on the weekly, green buy signal on the Cypher, low RSI, historical trendline bottomed out, and we are coming to end of the consolidation triangle/ end of cup and handle, previous feed in yellow shows very familiar pattern from 2017/2018 run up.
Bearish views are sell signal on monthly, and long term downtrend yet to be broken.
i.d say that 35% chance of going down and 65% for the up if no news affects it..
Let me know your thoughts or if I missed something.

XYO Coin have high potential of breaking ATHThe indicator and chart pattern of this coin have high chance of breaking ATH and higher. We have seen this coin gone up and back down. It is about time for this coin to make its move in a few days or week. Big buy is coming in today.

Big Whale!! Pumping New ATH???Weekly Time-frame
The largest Canadian Bitcoin ETF is hitting back-to-back all-time highs with respect to its BTC holdings as inflows intensified. Bullish news. We are still holding the area of supply zone. If we turn it to demand zone we can rally again in the following days.
1D Time-frame
We are going to have some correction today or might be the beginning of the drop base drop. Crypto greed and fear index is now at #51. AO is still bullish and RSI is still bullish. We are still in the supply area if we turn this to base the we can rally again next week.
4H Time-frame
AO is bullish and is currently correcting. RSI is bullish. Tanken Sen is now supporting the candle. Next support is in Kijun Sen at $43,000.
We will discuss more on the possibility on our Live. Stay tune and check with us!
Want more insights before US market open? Hit Like, Share, and Subscribe for more daily trading tutorial & cryptocurrency news
Trade Scholar, the best cryptocurrency educational community online!
Find the content above difficult to understand?
Feeling lost about how to trade?
Want to learn how to do your Own Price Prediction?
We endeavour to share you our investment knowledge & experience in order to help you starting your path to financial freedom. Follow, Subscribe & Join our Community to trade together!
Disclaimer: Above Technical Analysis is pure educational information, not Investment Advice. The information provided on this post does not constitute investment advice, financial advice, trading advice, or any other sort of advice and you should not treat any of the website's content as such. Do conduct your own due diligence and consult your financial advisor before making any investment decisions. [/i

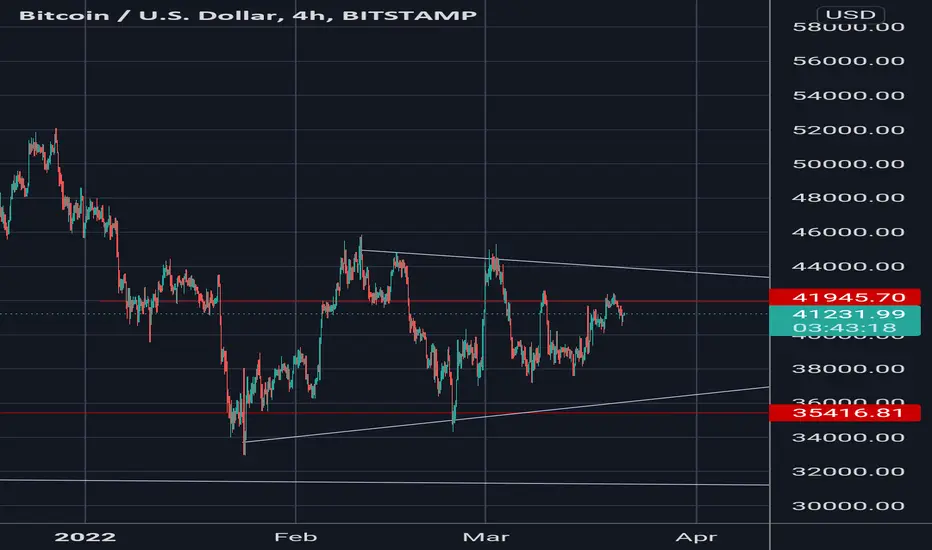
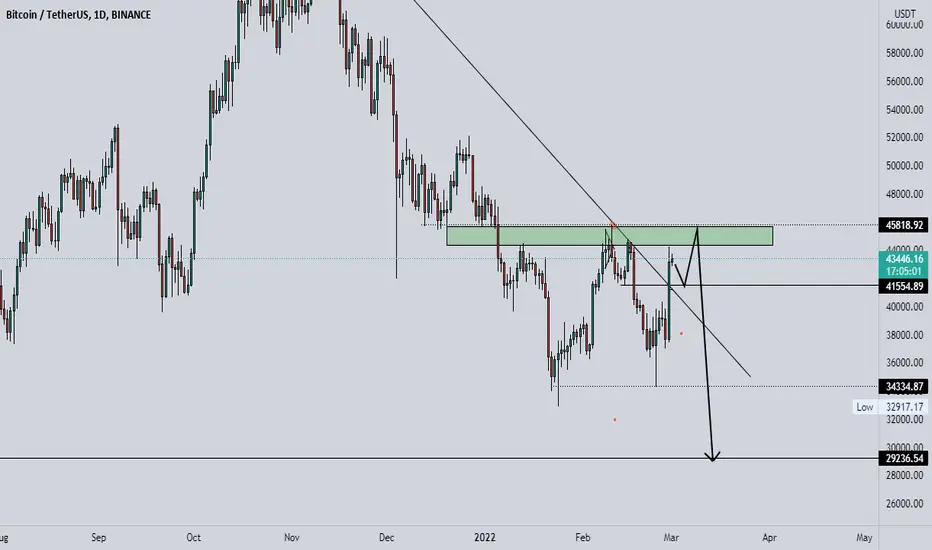
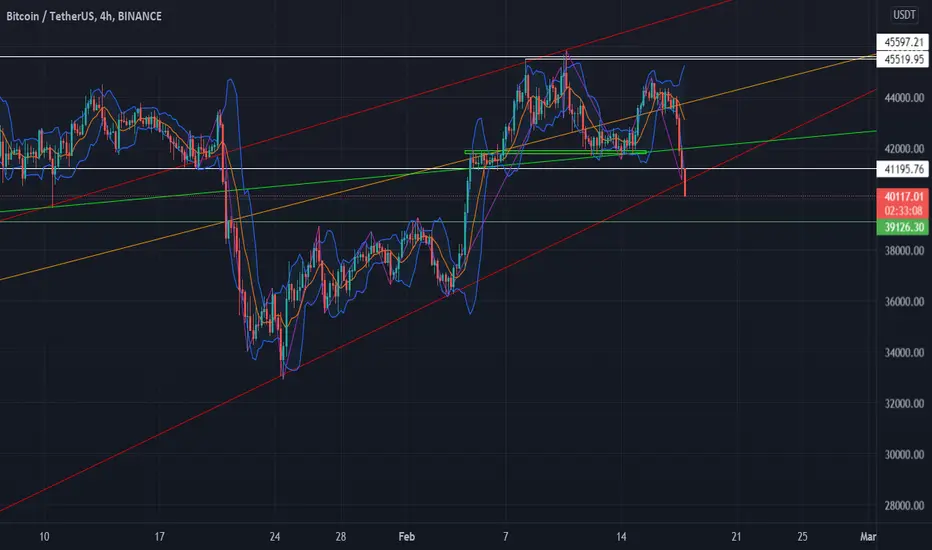
BTC - AFTER THE 44K TRENDHello trading friends,
Since the last trends, BTC did increase to 44K + and at the same time, this zone is a split zone.
Into the before update we did add about the whale protection trend on the 42K zone.
All markets have uptrends and downtrends, for this reason, follow always the last market trend if you are a daytrader or short-term trader.
with following last trends data - you will be at last following a model that changes as the markets do.
If the trend gets a positive trend - we could hit the coming time 45400+ as an important power line. but at the same time check always the last trends on BTC - as it can get unexpected.
waiting to see or BTC will go to the blue trend line as the chart shows, that would make it more positive for BTC.
In short words: We are now still into uptrend depending on live data - and at the same time it's the split zone - further risk management should be high if the trend returns back.
Have a great time.
# This is not a trading call - trade only depending on your setups.

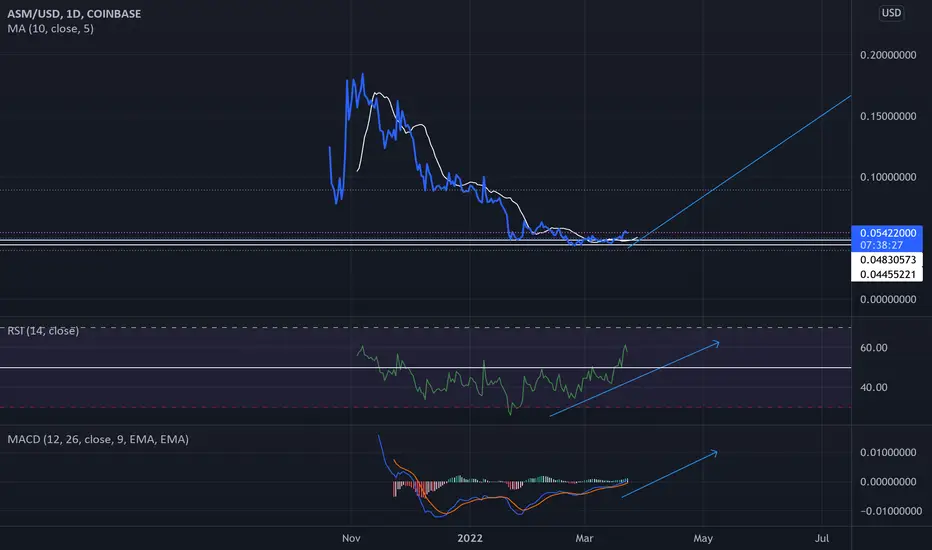
ASM Analysis BullishASM been taking a drop for a while now. The reason why this coin have potential is because it's been holding resistants for a few months at .04 cent. ASM have a low market cap and only 1.5billion coins. Its a faster mover then BTC. Few days ago it just broke higher high and moving uptrend. We may say this coin hit .30 and possible $1 this year.
BitcoinMarket ranging around Trendline,wait and see which one market breakout,up or down?once breakout,we have direction
BTC Major Drop To 30k!!! Sold at 41500Monthly, Weekly, Daily price action points lower towards 30k then 25K. I expect BTC to hit those targets this week

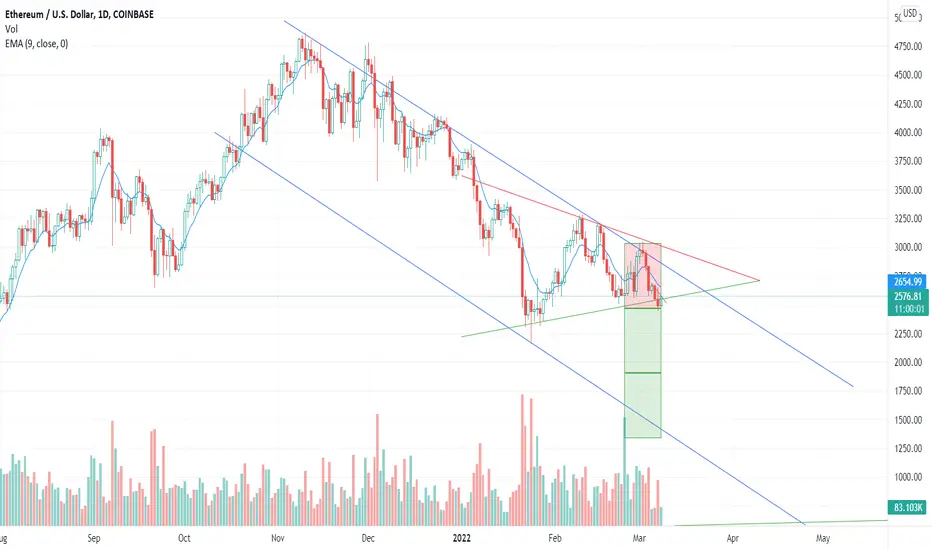
Ethereum Descending Triangle Channel Reversal Set up.Ethereum is looking to trade lower along with the SP500.
Channel Reversal.
Joe Bidens Cryptocurrency executive order may play a large role on tax's which could be very bearish for Crypto.
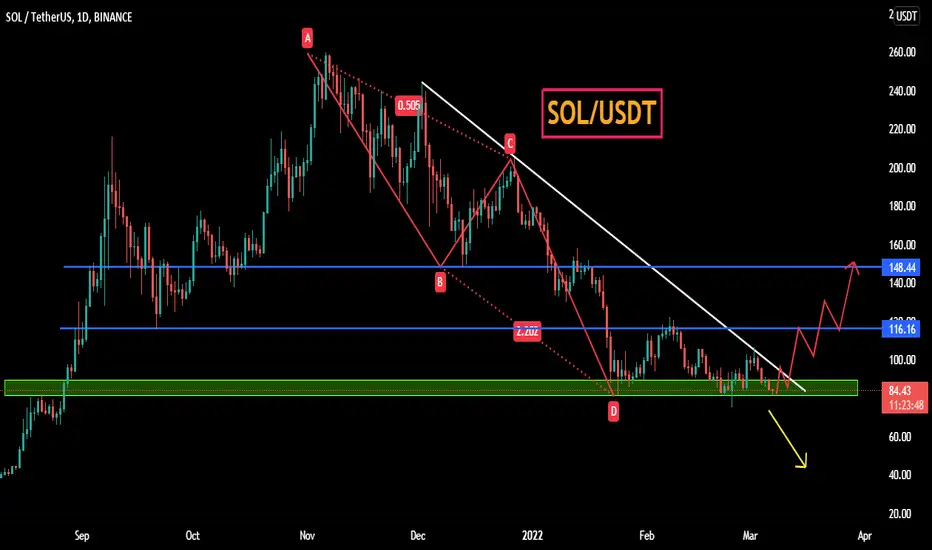
SOLUSDT - SETUPSOLUSDT price has reached a major support area where it needs to hold this area at any cost otherwise we could see a major drop towards 65 $ level. If bulls find this area attractive they can react and pull the price towards falling trendline.
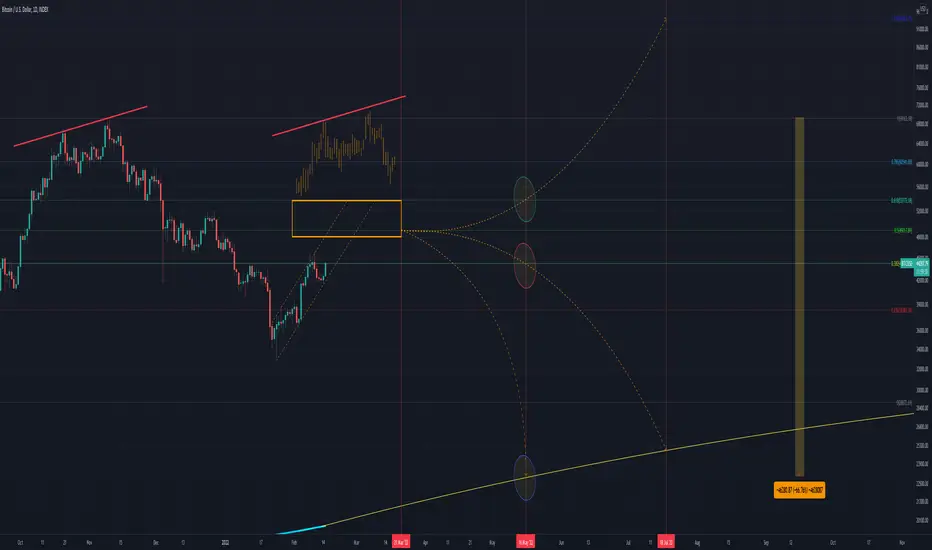
Bear Market RoadmapThe bear market has been underway for a while now ever since the top in April 12th 2021 I believe we have been in a bear market and in a distribution phase, even though we did make a higher high later on the year I still have come to the conclusion that we are indeed in a bear market.
The TA i posted a while back “The satoshi Prophecy” while still not technically invailded because in that TA my thesis is that May 2022 is the top for the cycle based on a Fibannaci time sequence of Chain Link, I still think it will eventually it will be invalided coming May 2022 as not the cycle top but as the bottom of the bear market ,you can check that out below.
As soon as we lost the 8/1 Gann on Bitcoin I new things were about to get rocky but I still pushed and thought we were in a bull market because I kept finding things that backed my May 2022 cycle top case for example I posted the blue fibonacci log theory which you can check below .
Weeks later we would break the blue fib log after that there was no case for the bulls anymore , historically breaking the blue fibonacci log confirms a bear market.
In reality breaking the 8/1 Gann and not holding as support should have been the line but I was so focused on the Chain Link Fibonacci count that I did not see things coming, check out below on how we broke support the week of new year.
Normally to trigger a Bull market or continue an uptrend we hold 8/1 as support and break higher like below in 2020.
So what comes next, well looking at the golden multiplier trend lines we can see whenever Bitcoin follows below the last orange line we enter a bear market , right now we have been under it for a while now.
Once below Bitcoin normally bottoms on an average of about 120days and breaks above the orange line in an average of 270 days which would put us in September to break out and amazingly May 2022 for a bottom , amazing that it lines up with May 2022 So what can we expect is a retest of the orange line at one point that ends up in a failed rally happens every time in history in a bear market
2011
2015
2018
Present Day
Showing a possible outcome for this year 2022
So now we come to the most important piece of evidence that we are in a bear market and that would be the June 2018 bear market fractal that has played out 1:1 almost perfectly .
Present Day with June 2018 Fractal
June 2018 pattern
Also cover this in the TA below
It is a mirror pattern , mind blowing stuff and during June 2018 we also had a MACD bearish cross on the monthly which has happened now as well!
So if the June 2018 bear market fractal plays out we retest 33k and create a double bottom sometime in the next 10days maybe and then have a rally to the orange line we talked about before which more or less lines with the 0.618 you can see that in the main chart above . There is this 3/1 Gann which I have been following for a while that Bitcoin can’t seem to break take a look at the TA below .
I believe Bitcoin will most likely fail to break this gann line until we form that double bottom and finally to finish off volume , we had no capitulation volume come in , every time we have a major bottom or top there is a huge spike in volume.
So how I think 2022 plays out
1- Revisit 33k form double bottom
2- Rally to 0.618 or orange line(Golden Multiplier) anywhere from 45k-56k to Mid-late March 2022
3-Get nuked down into May maybe capitulation wick down to 25/27k before closing at 30k
4- Come out of Bear market September 2022
5-Cycle Top June 2023
BITCOIN UPDATEBTC pushed up a lot higher than originally anticipated and took us out for a breakeven on our short after securing profit at 3/4 TPs.
My bearish bias remains the same looking for a push up to the weekly supply identified before we can drop to lower TF and look for re entries to short.
Bitcoin Event May 2022May 2022 is the month to watch out , possible head and shoulders idea that can play out to the 200 weekly moving average.

Bitcoin Price Action Day trade SetupHello as we seen bitcoin price dropped of on 32950$ level then we have seen a bullish sentiment on the market price action and it push to 45850$ and got rejected and it dropped again
39490$ area which we can consider it as correction of that bullish sentiment. So i am accepting that the price of Bitcoin will push up again to the previous area and it may breakup this time to the next resistance area. So i decided to go long for next couple of days until it hit my Take profit or Stop loss zone.
What do you guys think let me know on comment below.
Thank and we will see you all again on my next trade.

Bitcoin Dump on the 4 HourHello hello hello, yes I am only everyday and so far this is no change to my chart. Okay so on to pressing matters, Price has dumped below the uptrend seller limit I had set and there is a potential chance that it will make it's way to the next supply zone. However, I find that to be highly unlikely due to price not having touched the lowest trend line in ages. Being that the trend line was in charge of the initial buyer flow before it had initially taken off to the new highest high point, it will be a challenge for sellers to break past such a solid line because there are players out there ready to stop the flow. HOWEVER, the dump is particularly strong and on the 1 hour time frame, sellers had broken through the previous floor with no retaliation from the buyers side. There is something I will like to mention, there is a small seller candle with a short wick on the upwards section at Feb. 17, 2022 19:00 which confirms buyer presence and price seems to have slowed down right underneath the current trend line which shows there is a potential chance for things to slow down and consolidate. I would not trade at this point due to how volatile bitcoin is now but I would like to say that on the RSI section of things, price had hit a floor there that has shown good bounce backs. There was one event where price had oversold on January 21st and the 22nd for a few hours but had shot back out after trying to find itself. I do feel as if this is the limit for the dump but if not, there is a possibility that the next level will be the previous supply zone which is set around $39,000. I would suggest waiting this storm out and seeking a buyer candle confirmation and a small retest of the zone to see if it is actually as consistent as I make it out to be. Happy trading and once again I did not proof read this. If you found clarity using my ideas then enjoy and I wish you the best. Please do not over trade due to stress and economic disparity because you will be in a worse position if you trade now and screw yourself. What's 3 hours or so to you? Take a nap and your cash will still be there or don't and lose the cash and your despair will be worse. Pick and choose. The masters can trade on the shorter time frames and utilize the harmonics indicator and Bollinger bands + RSI to get a perfect entry but please don't do that now because anything can happen. A perfect setup could appear but bitcoin could do the exact opposite and just nuke itself the other way and take all of your cash. Anyways, no more parenting for me haha. Patience and wait for retests always. Price always repeats itself, just like war and games. It's all the same.
Capitulation down to the 200 weeklyI think this week has been a very important week for Bitcoin and I have not seen anyone talk about the fact that the 200 weekly moving average is now at the previous all time high at 20k.
This is a very important thing to take note of because we have never closed a weekly candle under the 200 week moving average in Bitcoins history it has been a hard bottom for Bitcoin in bear markets and even the Covid crash 2020 , take a look below
Also found something interesting in this chart and that is the last time the 200 weekly hit the previous all time high in December 2017 it was the top of that current cycle, just something to keep in mind.
So there are three projections I'm currently following right now , take a quick look at my previous TA to get an idea on where I come from with this TA.
Any price action under the 0.5 or 0.618 Fib means nothing , until we close and hold 0.618 as support we are still in a setup for a much larger distribution leg down. The leg down will most likely find a bottom at the 200 weekly moving average which as of right now is at 20k but if we quick estimate we find the 200 weekly would be somewhere around 23k-24k by May 16th 2022.
So I have laid out three different outcomes I'm following right now .
Green Circle - This would be the lowest probability outcome out of the three ,come May 16th price breaks 0.618 and the bull market resumes.
Red Circle - This would be the highest probability outcome , come May 16th major pivot for a huge leg down to the 200 weekly.
Blue Circle- I would say this one is somewhere in the middle , come May 16th price will find a new cycle bottom at 23-24k at the 200 weekly.
It all comes down to how price reacts in this orange box ,if we do get any sort of rejection of this area or a double top pattern forming that would be the confirmation that the red or blue circle will play out.
We already had two 55% draw downs , whats one more to the 200weekly at 65%? historically it would be the best time to buy Bitcoin , one thing is for sure if we do hit 200 weekly you can expect OTC outflow to hit all time high.
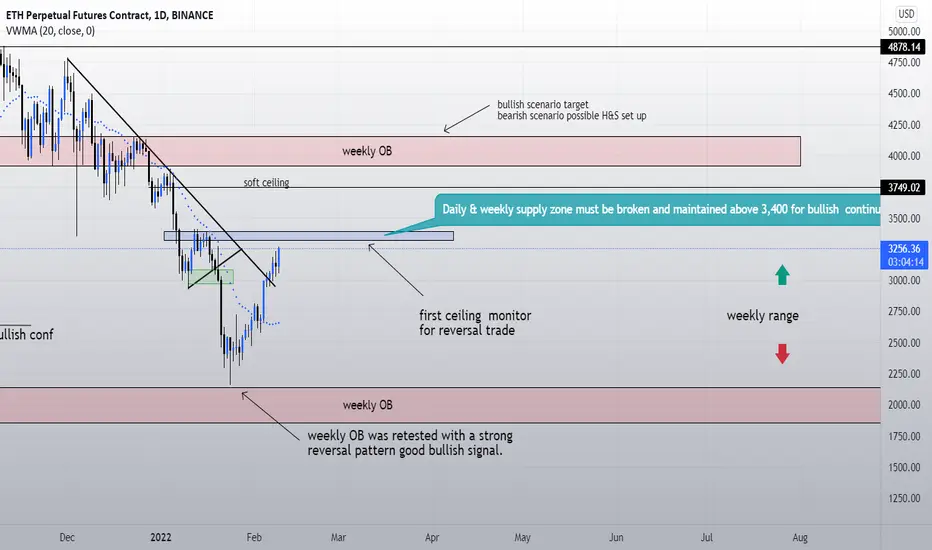
ETH/USDTBullish scenario: only take a continuation trade if we close weekly above 3400
bearish scenario. look for reversal pattern after liquidity above 3400 is ran.
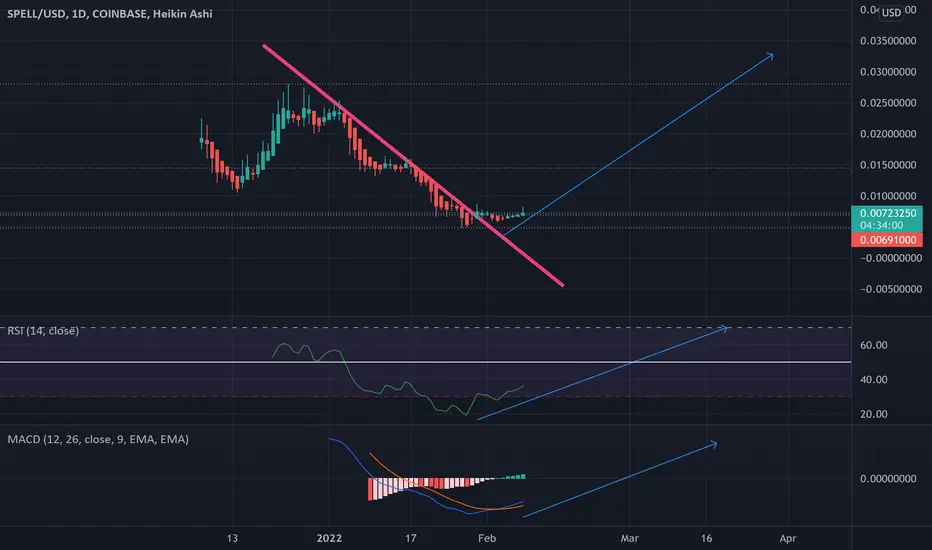
Spell big bull comingCross the pink line great time to watch for a big runner up. Stable resistant at the .006 this coin did a run today to the .008. Big investors locking up the coin before taking off. Great target $.03-$.10 This coin is similar to doge coin with 3x less amount of coins. Very high % of pulling to the up side. MACD is crossing, RSI did a over sold to the 16 rsi.
follow for more free analysis
Been doing crpto analysis for over 9 years
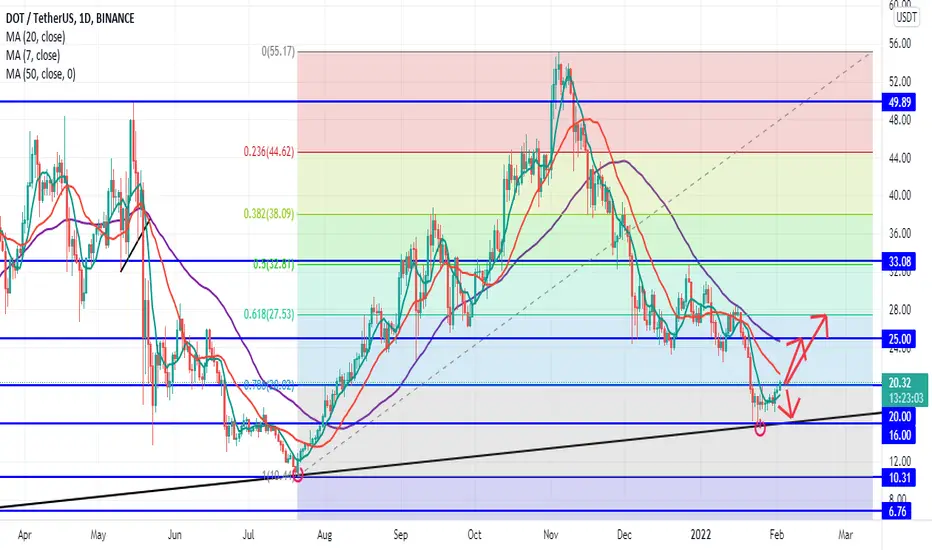
DOT IS BULLISH OVERALLFrom my TA, I see DOT bullish overall.
If $20 level which is also around FIB 78.6 zone holds strong as a support level, DOT will most likely rally to $25 zone or around the FIB 61.8 level ( $27.6 - $28)
My next bullish TP target is $25.
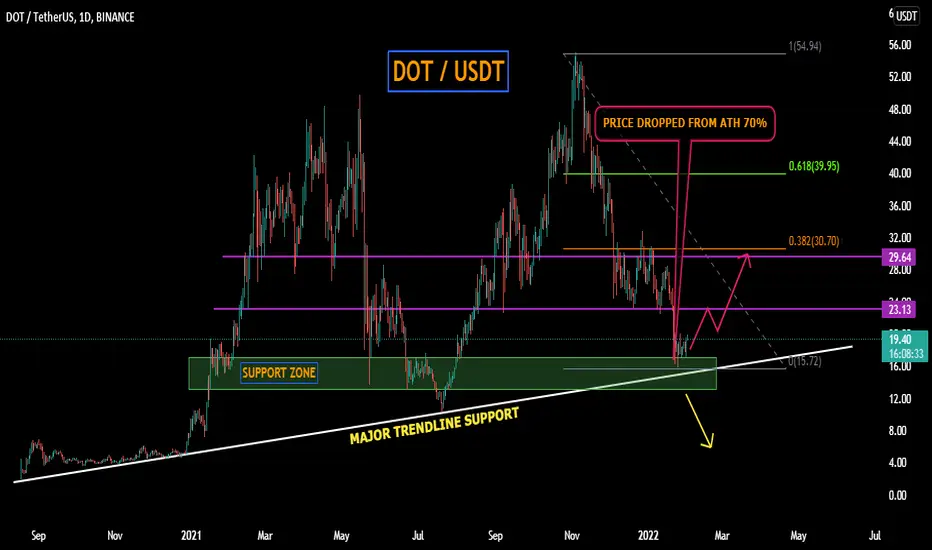
DOTUSDT SETUPDOTUSDT price almost retested its major trendline support after dropping from ATH. That drop is 70%, which is now expected to be correct at least towards fib level 0.38%. So we are expecting the bull's involvement to emerge and they can pull the price towards the 30.0 level. Buy on Dips will be a good sensible option here.

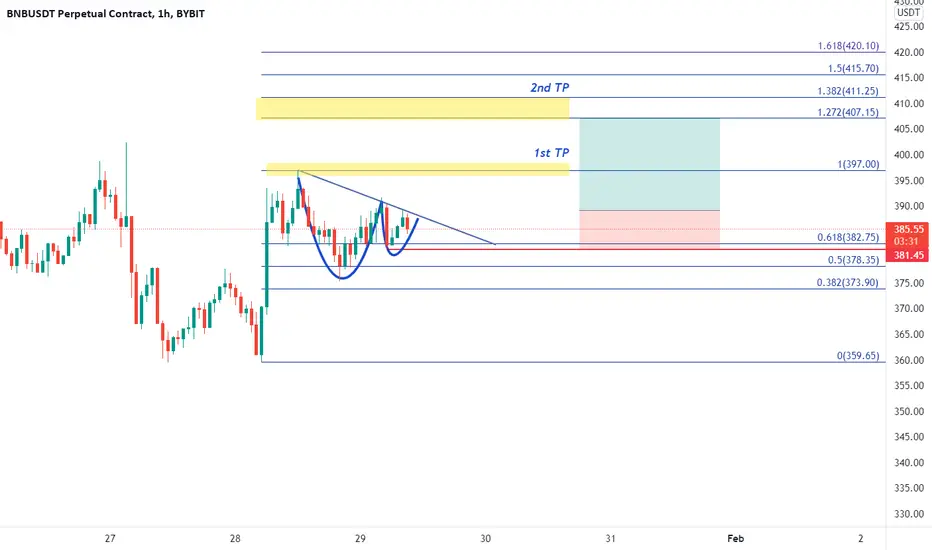
BNB - Potential TP of Cup and HandleBYBIT:BNBUSDT
1H trend chart
-
BNB is forming a possible cup and handle on 1H.
Here is the status of handle building.
If price can break out downtrend line, trading strategy as below.
-
Profit Targets:
a) 397----Fib(1)
b) 407.15~411.25----Fib(1.272~1.382)
Stop losses:
a) 381.45-----Red horizontal ray
-
If you like this analysis, smash the "like button" and leave a comment below to share your thoughts
or let me know what crypto you want to see!
Trading is a reflection of yourself. Learn more daily and be ready for every opportunity.
Have a nice trading!