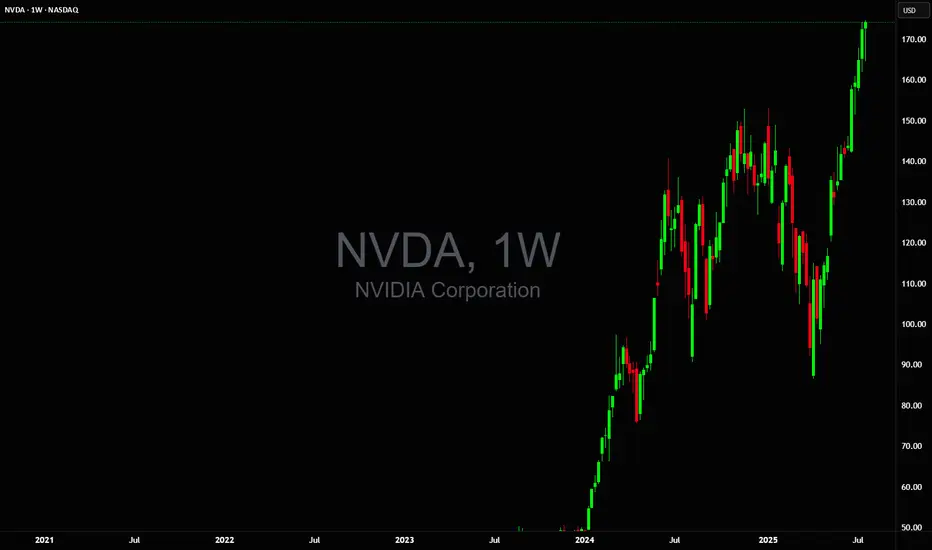
99% of people buying $NVDA don't understand this:🚨99% of people buying NASDAQ:NVDA don't understand this:
NASDAQ:GOOGL : “We’re boosting AI capex by $10B.”
Wall Street: “Cool, that’s like $1B or 0.06 per share for $NVDA.”
So from $170.50 at the time of news to $170.56 right?
No.
NASDAQ:NVDA trades at 98× earnings. So that $0.06? Turns into $6.00
Why?
Because people are expecting that to be happening every single year for 98 years and they're paying All of it Today in Full amount.
So NASDAQ:NVDA will get $1B more per year. But NASDAQ:NVDA price per share already increased by $100B in past 2 days 😂
Then it crashes 40% and everyone is wondering why.
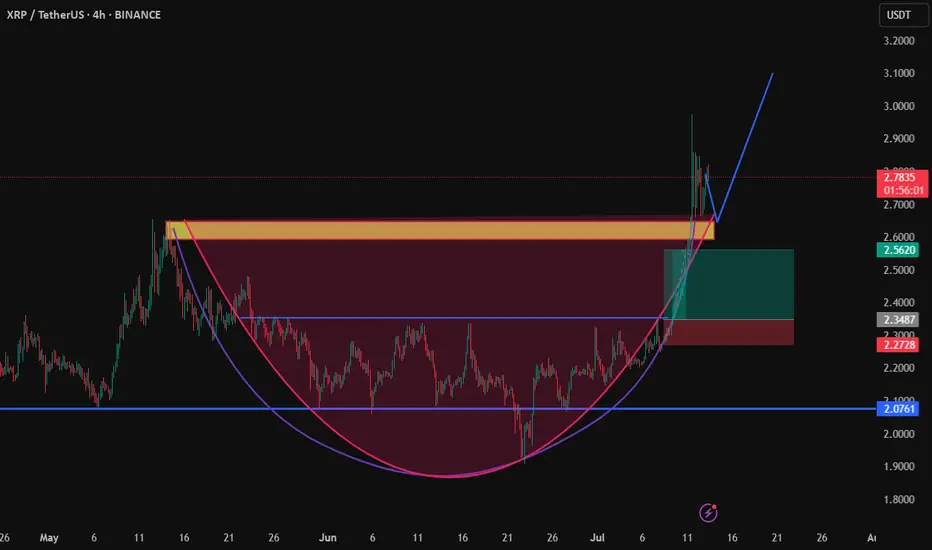
Crpyto
Xrp cup and hundleChart Xrp/usdt (4h)
Classic cup&hundle breakout in play. price broke above the neckline $2.5 with strong volume, followed by a clean retest of the breakout zone
Understanding Elliott Wave Theory with BTC/USDIntroduction to Elliott Wave Theory:
Elliott Wave Theory is a popular method of technical analysis that seeks to predict the future price movement of financial markets. Developed by Ralph Nelson Elliott in the 1930s, the theory is based on the idea that market movements follow a repetitive pattern, driven by investor psychology.
At the core of Elliott’s theory is the idea that markets move in a 5-wave pattern in the direction of the trend, followed by a 3-wave corrective pattern. These waves can be seen on all timeframes and help traders identify potential entry and exit points in the market.
Key Concepts of Elliott Wave Theory:
1. Impulse Waves (The Trend)
2. These are the waves that move in the direction of the overall trend. They are labeled 1, 2, 3, 4, 5 and represent the price movement in the main direction of the market.
* Wave 1: The initial move up (or down in a bearish market). I like to mark up the first wave how I do my Fibs, from the point where price showed a major impulse.
* Wave 2: A correction of Wave 1 (it doesn’t go lower than the starting point of Wave 1).
* Wave 3: The longest and most powerful wave in the trend.
* Wave 4: A smaller correction in the direction of the trend.
* Wave 5: The final push in the direction of the trend, which can be shorter and weaker than Wave 3.
3. Corrective Waves (The Pullbacks)
4. After the five-wave impulse, the market enters a corrective phase, moving against the trend. This corrective phase is generally a 3-wave pattern, labeled A, B, C:
* Wave A: The initial correction, typically smaller than Wave 3.
* Wave B: A temporary move against the correction (it often confuses traders who think the trend has resumed).
* Wave C: The final move against the trend, usually the strongest and most aggressive.
How to Implement Elliott Wave on BTC/USD:
Let’s break down how you can apply the Elliott Wave Theory to BTC/USD using a simple example.
1. Identify the Trend
2. Start by identifying the current market trend for BTC/USD. Are we in an uptrend or downtrend? This will determine whether you’re looking for a 5-wave impulse up (bullish) or down (bearish).
3. Locate the Waves
4. Look for the five-wave structure in the trend direction. Once you identify a potential impulse move, label the waves accordingly:
* Wave 1: A new uptrend starts.
* Wave 2: A small pullback (usually less than the size of Wave 1).
* Wave 3: A significant surge in price, often the most volatile.
* Wave 4: A smaller pullback or consolidation.
* Wave 5: The final push higher, which might show signs of exhaustion.
5. Corrective Phase
6. After completing the 5-wave impulse, expect a corrective 3-wave pattern (A, B, C). These corrections typically last longer than expected and can often confuse traders.
* Wave A: Price starts to reverse.
* Wave B: A retracement that may confuse traders into thinking the trend is resuming.
* Wave C: A strong pullback that brings the price even lower.
7. Use Fibonacci Levels as confluence
8. One of the most powerful tools in Elliott Wave analysis is Fibonacci retracement levels. You can use these to predict potential levels where Wave 2 and Wave 4 could end, or where Wave C might complete the correction. Common retracement levels are 38.2%-50% for Wave 4, and 50-61.8% For Waves 2 and B but keep in mind, these wave can retrace up to 100% before the wave analysis becomes invalid. But ideally these points are where you look to make an entry.
Wave 2 Example:
This one hit the golden spot (0.5-0.618) perfectly and continued to push upward.
Wave B and C Example:
This example hit closer to the 0.786 level which is also a key level for retracement.
Wave 4 Example:
This one hit the golden spot (0.382-0.5) for Wave 4 perfectly before continue the bullish momentum.
I try to use the RED levels below (1.1 and 1.2) as my invalidation (Stop Loss) levels and the GREEN levels (-0.27 and -0.618) as my Take Profit levels. Depending on your goals you can also use Fib Levels 0.236 and 0 as partial Take Profit levels.
9. Confirm with Indicators
10. To validate your Elliott Wave counts, use other indicators like the RSI (Relative Strength Index), MACD, or Moving Averages. For example, a Wave 3 might occur when the RSI is above 50, indicating strength in the trend.
In this example you can see the RSI cross the 50 threshold and the 3rd Wave form.
Continuation after the Wave is complete:
Tips for Trading with Elliott Wave Theory:
* Stay Flexible: Elliott Wave Theory is not set in stone. If the market doesn’t follow the expected pattern, adjust your wave counts accordingly.
* Don’t Rely on One Timeframe: A 5-wave structure on one timeframe may be part of a larger wave pattern on a higher timeframe. Always analyze multiple timeframes.
* Wave Personality: Waves don’t always look the same as stated earlier. Wave 2 can retrace up to 100% of Wave 1 and Wave 4 should generally not overlap Wave 1 or this may invalidate the Wave structure.
* Risk Management: Always use proper risk management techniques. No theory is perfect, so make sure you have a stop-loss in place to manage your risk.
Conclusion: Using Elliott Wave Theory on BTC/USD:
The Elliott Wave Theory can be a powerful tool for analyzing and forecasting price movements. By identifying the 5-wave impulse and 3-wave corrective patterns, you can gain insights into potential market direction. Just remember to use it alongside other tools and indicators for confirmation, and don’t forget to manage your risk.
As you apply it to BTC/USD or any other asset, remember that the market doesn’t always follow the "ideal" patterns, and flexibility is key. Practice on different timeframes, refine your skills, and use the theory as a part of your overall trading strategy.
Final Thoughts:
If you're just starting, don't get discouraged if you miss a wave or two. Trading is a journey, and with patience and practice, you'll begin to spot these patterns more naturally. Whether you’re analyzing Bitcoin's price action or any other asset, Elliott Wave Theory can give you a deeper understanding of market psychology.
Good Luck and Happy Trading!

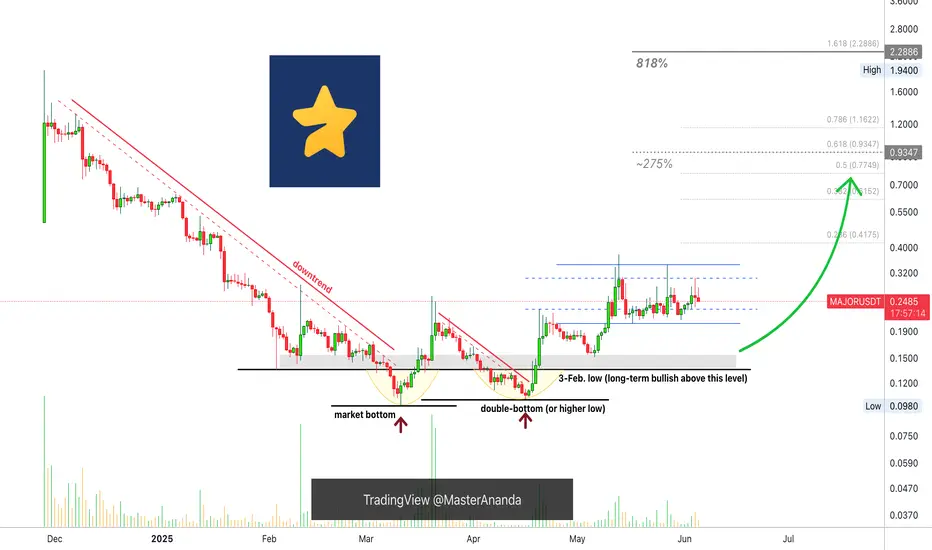
Major Enters Bullish Zone, 800%+ Profits Potential MappedSo this is a game on the TON network. It is good you called this to my attention because I love games. I don't play them but I love them, I think these are good for the Cryptocurrency market.
We are looking at MAJORUSDT, thank you for taking the time to read.
It is my pleasure to write for you and I am always grateful for your continued support... Let's read the chart.
There is high volume on the chart, twice. After 3-February and after mid-March. In both instances the high volume happened on green candles. It is an early reversal signal.
MAJORUSDT was moving down, a downtrend; this is when the candles were producing lower highs and lower lows. 11-March 2025 comes the bottom and the downtrend ends. The end of the downtrend is good news, this market is no longer bearish, it goes from bearish to sideways.
The initial recovery, small, peaks 20-March after 165% growth. Then comes the first retrace and the pair is bullish and strong because it ends in a higher low. 7-April of course, when the entire altcoins market bottomed. This higher low is a technical double-bottom. From this point on, instead of the initial breakout and sideways, we have the start of a bullish wave.
MAJORUSDT starts to grow and now it is up. Current action is happening 153% higher compared to March low, the market bottom.
After some higher highs and higher lows, MAJORUSDT is now sideways again, consolidating but this time bullish, building strength before the next bullish jump. So we can expect some more sideways, with some swings followed by additional growth. You can find two nice targets on the chart.
» The first target sits at $0.9347 for 275% profits potential, the second goes beyond 800%.
I love you.
Thanks a lot.
Your support is appreciated.
Namaste.
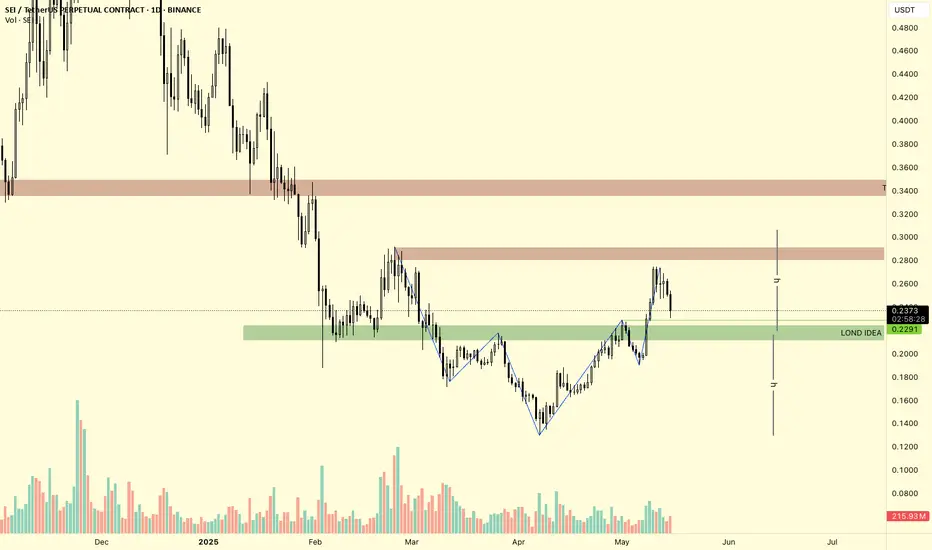
SEI/USDT Daily Chart Analysis – Potential Reversal ConfirmedThe SEI/USDT chart on the daily timeframe presents a notable Inverse Head and Shoulders (IH&S) pattern, which appears to have completed successfully. The neckline breakout occurred with a strong bullish impulse, suggesting a potential trend reversal from the prior downtrend.
Following the breakout, price encountered a significant resistance zone between $0.275 - $0.295, which acted as a supply area and triggered a short-term pullback. This level aligns with a previous structural breakdown point, adding to its validity as a resistance.
A key demand zone (highlighted in green), located between $0.195 - $0.229, has been marked as the “Long Idea” zone. This area previously served as resistance and now has the potential to flip into strong support upon retest, offering a favorable long entry if price revisits the zone. The current price action suggests that this retest may occur, offering an opportunity to enter with a better risk/reward ratio.
The measured move target from the IH&S pattern points towards the $0.35 region, which also coincides with a major horizontal resistance zone and serves as the primary take profit (TP) target.
MicroStrategy $MSTR | MicroStrategy’s Bitcoin Bet Sees 20% DropMicroStrategy NASDAQ:MSTR | MicroStrategy’s Bitcoin Bet Sees 20% Drop Feb28'25
With recent downturns in the crypto market, Bitcoin's sharp drop has significantly impacted companies like MicroStrategy NASDAQ:MSTR , which has heavily invested in crypto. I've kept this analysis updated for my students throughout the week and figured I'd post it publicly.
This is what I would personally look at before entering trades, everything is subject to change on a daily basis and as I analyze different timeframes and ideas.
ENTERTAINMENT PURPOSES ONLY, NOT FINANCIAL ADVICE!
trendanalysis, trendtrading, priceaction, priceactiontrading, technicalindicators, supportandresistance, rangebreakout, rangebreakdown, rangetrading, chartpatterntrading, chartpatterns, spy, btc, bitcoin, mstr, micro, microstrategy, strategy, cryptocurrency, cryptodrop, cryptotrend, memecoins, crypto, digitalcurrency, digitalassets, mstrdrop, btcdrop, bitcoinidea, mstridea, mstranalysis, btcanalysis, cryptoanalysis, cryptotrades,

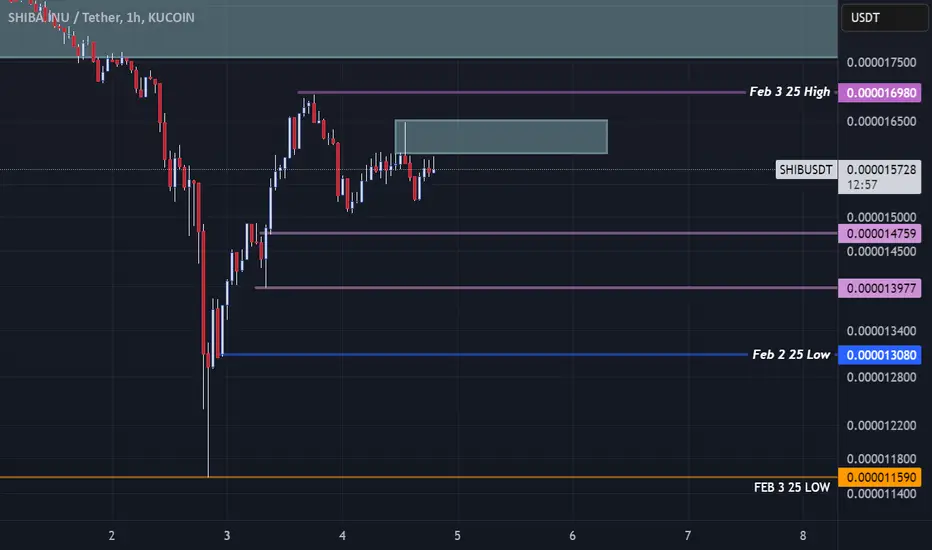
SHIBUSDT Price Action - Liquidity & Order Block AnalysisPremium Zone Rejection:
Price is approaching a FVG (Fair Value Gap), which could act as a resistance zone.
If rejection occurs, smart money may be engineering liquidity to take out lower levels.
Liquidity Levels to Watch:
Feb 3 High (0.000016980): A significant level where liquidity is resting. A potential raid could occur if price breaks structure to the upside.
Feb 2 Low (0.000013080): A key downside liquidity pool where price may seek orders.
Feb 3 Low (0.000011590): The ultimate downside draw on liquidity if price continues distributing lower.
Possible Scenarios:
Bullish Case: A clean break and hold above 0.000015764 could lead to a liquidity grab towards the Feb 3 High.
Bearish Case: Failure to reclaim the fair value gap could send SHIB lower to test 0.000013080, possibly even targeting the Feb 3 Low.
XYO Coin: Ready to Blast Past 3 Cents XYO is at a crossroads. If it breaks above 2.5 cents, we could see it soar to 3 cents, maybe even 10! But, if it dips under 1.9 cents, watch out for a fall.
Kris/Mindbloome Exchange
Trade Smarter Live Better

XRP’s Next Move: Can It Reach $6.50?Good morning, trading family!
XRP is at a key point right now. If it drops below $2.84, we could see it fall to the $2.70–$2.60 range before bouncing back. On the flip side, if it pushes up from $3.30, we might see it climb to $3.80—and from there, $6.50 could be in sight.
It’s going to be an exciting move either way, so stay sharp!
If this resonates, feel free to comment, like, or share. Let’s trade smarter and live better!
Kris/Mindbloome Exchange
Trade What You See

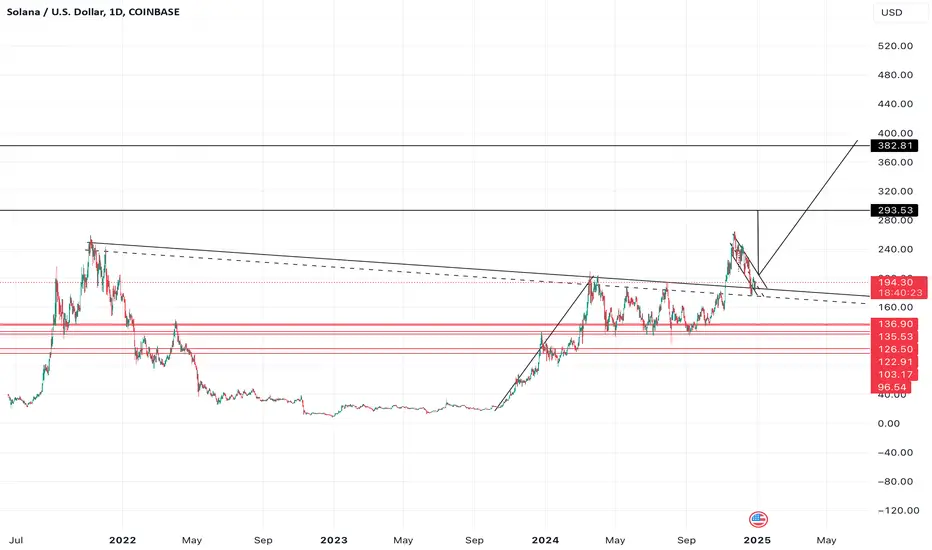
Solano chart prediction Above macro trend. And forming bulling continuation falling pattern on trend. This is my prediction for this bullrun
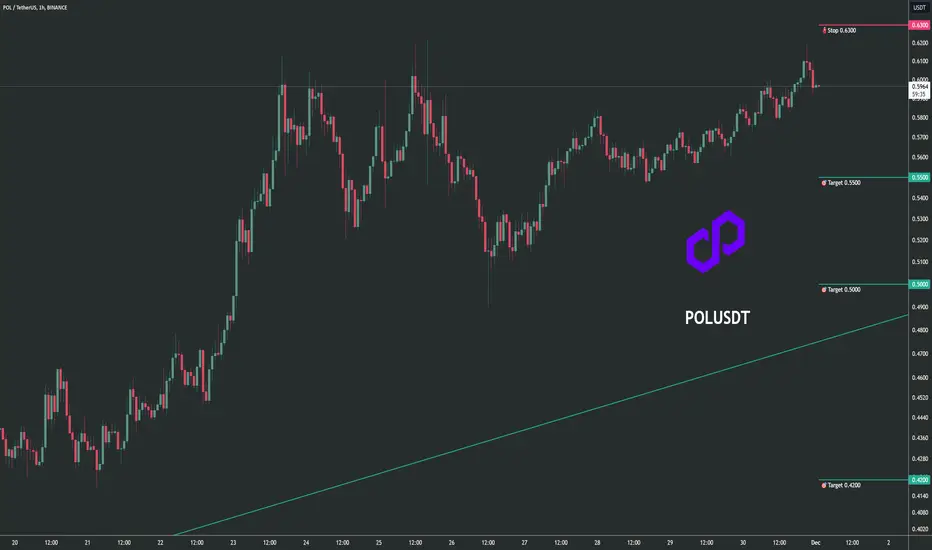
Trading opportunity for POLUSDT MaticBased on technical factors there is a Sell position in :
📊 POLUSDT
🔴 Sell Now
🪫Stop loss 0.6300
🔋Target 1 0.5500
🔋Target 2 0.5000
🔋Target 3 0.4200
💸RISK : 1%
We hope it is profitable for you ❤️
Please support our activity with your likes👍 and comments📝
TAO - Looking good for new ATH before EOYTAO is pushing for new all time high after retesting on 0.75 fib level. TAOUSDT

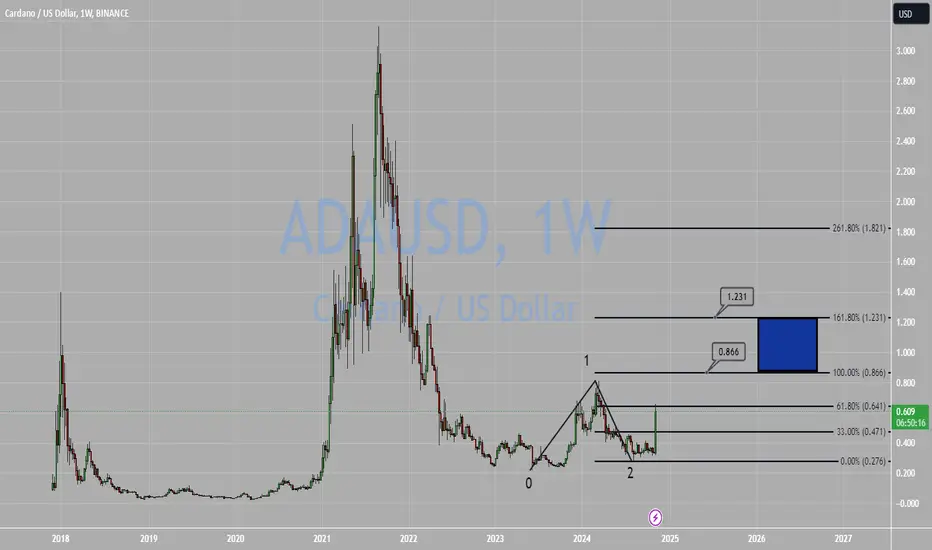
ADAUSD WEEKLYRULES:
-If price break Point 2, 4, 6, or 8 cancel the setup
-Price needs to break Point 1, 3, 5, or 7 to confirm the setup
When price reach the 100FE(BLUE BOX) it normally does a pullback/retest or reversal
The market can Truncate(fall short)
TAO SCALP LONG IDEAWe are in TAO 1H Supply zone. I will look the stentgh over here in order to enter trade.
It is scalp trade. If bitcoin changes bullishness - TAO will be following it too.
Be cautious and do not risk that more than you can afford.
Nothing i share is financial advice. Education purposes only.
#Altcoins #Crypto #altcoin #AltSeason2024 #Bitcoin #Ethereum #AI #TAO #TAOUSDT

GMX coin look good to go up/ in this month 3 trades 3 win 100%GMX coin look good to go up
entry 24.950
SL 24.370

Bitcoin 4hr Setup Bitcoin is currently experiencing a pullback, having dropped 2,000 pips over the past seven days. Several key factors are converging around the $60,000 level, making it a critical area of interest. These factors include the psychological round number of $60,000, previous market structure, the 0.5 Fibonacci retracement level, and the presence of both an upward and a downward trend line intersecting near this price. Additionally, there's a notable rejection point in this vicinity. Given these confluences, I anticipate a reaction around this level, potentially leading to further downward movement.
Bitcoin Daily Chart
Bitcoin is showing several confluences on the daily chart around the $60,000 level. After a 1,000-pip rally without any significant pullback, a retracement seems likely, as the price may need to dip before resuming its upward momentum. This time, I anticipate that Bitcoin might close below the 200-day moving average during the pullback. However, once it completes this downward move, I expect the price to eventually close above the 200-day moving average and begin a climb toward the top of the current channel.

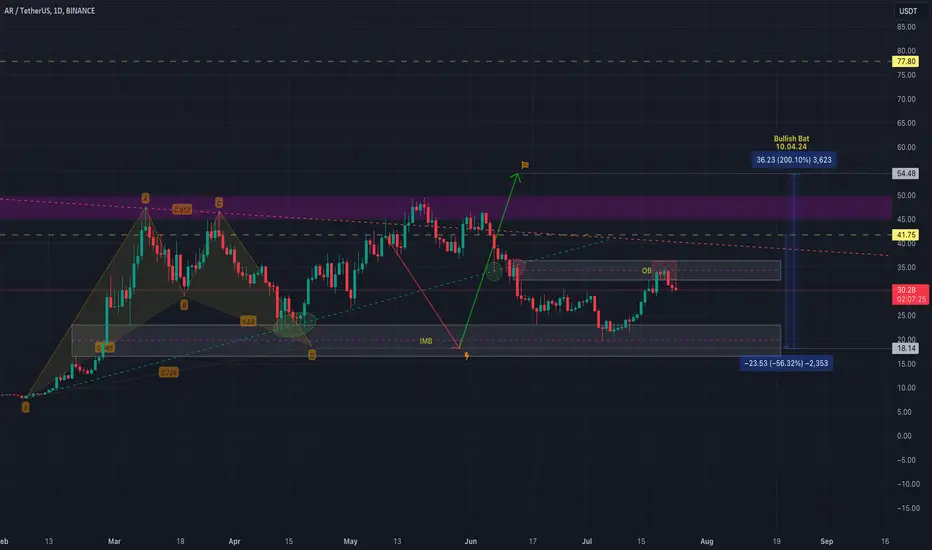
$Ar 1D chartNYSE:AR 1D chart;
#Ar, which no one had expected such a dump before, seems to have reached the 56% decline I expected with a deviation of 8% for now.
It may want to visit the same levels again.
#ZK 4h chartNYSE:ZK 4h chart;
On June 5, it is hovering at the bottom of the bullish channel it entered after the low it hit on June 5,
If it closes below, it may want to test the PWL level and even the $0.1479 support level,
Also pay attention to the downtrend line just above it, because it may sag down as it reacts.

Bitcoin at two major lines of resistance The arc and diagonal upward line have become a magnet for bitcoin. Major decision is ahead: Break hard below the wall or enjoy a big bounce. Get your popcorn.

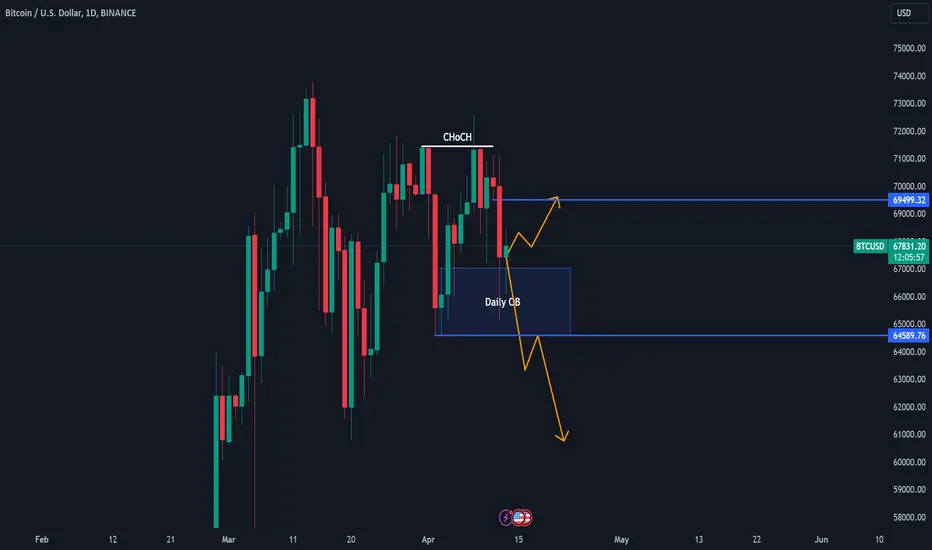
BTCUSD Analysis (13th April 2024)Crypto Analysis (13th April 2024)
BTCUSD Analysis
On the Daily Timeframe, Price action has created a Huge dump due to the 800+ Million Liquidation across multiple different exchanges. Nothing fundamental changed about BTC just yet. Just the usual happenings in the crpyto space.
Price has reached a daily orderblock and has shown strong rejections from that key area and closed the daily with a strong bottom wick indicating rejections.
There are 2 scenarios i see playout.
1) Price has just flipped the new daily candle after creating another huge bottom wick, Buys from here at 67602 is possible to come up to fill the clean candle on the left caused by the sell off. I want to see at least 69252 be tapped.
2) Price fails to hold, breaking the bullish daily orderblock at $64572. Once we see a body candle closure below that level, Sells are alot more likely to occur and i will look for a break and retest set up for shorts to target $60,000.
CULT DAO BILLION DOLLAR MARKET CAP PROGRAMMED Billion dollar market cap is programmed.
Sine Lines showing possible top April 2025 matchs with length of Chainlink and Bitcoin cycle tops.
Fib date July-Sept 2024 could be the start final wave up to to April 2024. Billion dollar market cap sits on the high end Fib levels so within the range of what is possible.

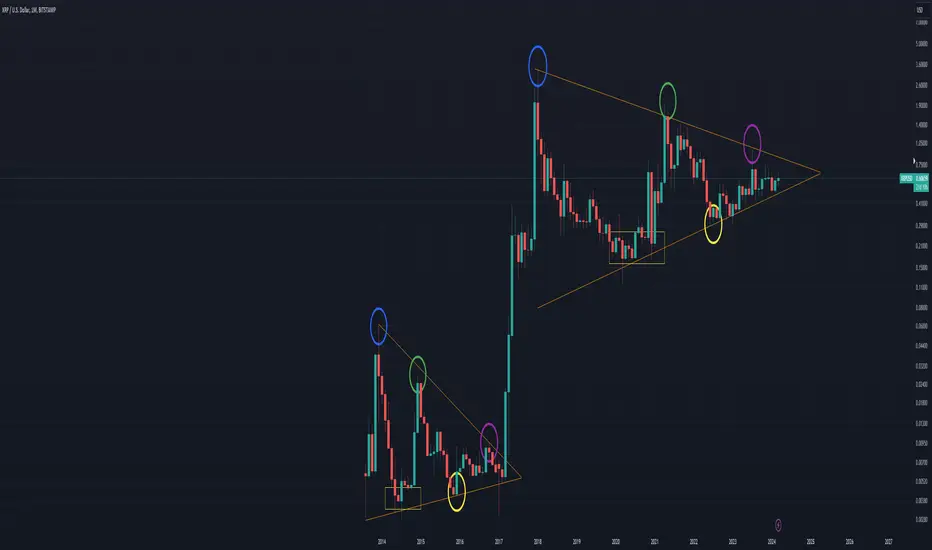
XRP MOONSHOTXRP right now is following history pretty closely.
As you can see from the main chart, XRP is potentially mirroring the same fractal formed back from 2013-2017. If history repeats, there will be a massive breakout for XRP.
There is quite a bit of evidence to support this.
First of all, the multi-year symmetrical triangle that has formed just like in 2012. It's taken years to form, but here we are in 2024 at the apex of it.
Within the triangle, even the fractal looks the same. You can see marked out points inside.
[Link 1: MACD on the weekly
is showing the same histogram readings as back then, with three big waves, two small, then a bullish cross on the MACD. Exactly the same has happened right now.
Bitcoin had just touched an all-time high again and had a pullback. It is at this moment XRP had its moonshot.
Tell me, what are the chances we have now formed a second multi-year triangle and it just happens that Bitcoin has broken all-time high at the apex?
The stars and planets seem to be aligning once again. It's just a matter of time before some big news comes out and this slingshots.
seem to be pretty crazy targets all around for the XRP community lol. No idea where they're coming up with hundreds of dollars price targets, but if you would have a mirror move, then yeah, $575.
The chances it goes to $575 this bull run are under 1%, let's be honest. The money required to get a mirror move is insane. So, a more grounded target this run would be a max of $10-14, with the first wave hitting $3-5.
RLC/USDT BINANCE:RLCUSDT
This idea has a long-term profit goal.
All goals are indicated on the chart.
- Risk 0.5% on deposit
- RR-1/2
P.S (This is not an investment recommendation, this is my personal opinion.f)
