Determining HTF Bias For Next Candle (CRT)The image shows candlestick patterns for determining HTF bias for the next candle based on close and wick positions relative to price levels:
1. Close Above - Higher Price: White candle closing above a key level (bullish bias, suggests upward continuation).
2. Close Below - Lower Price: Black candle closing below a key level (bearish bias, suggests downward continuation).
3. Wick Above - Lower Price: Long upper wick rejected above a level (bearish bias, indicates seller control).
4. Wick Below - Higher Price: Long lower wick rejected below a level (bullish bias, indicates buyer support).
CRT

BTC vs ETH: Lil Bro not waiting on nobody?!As BTC is stuck trying to convince everyone to stay long, ETH is using its bullish orderblocks really well...shorts are showing signs of letting go in these ranges.
Would like to hear your take!

Short Breakdown of Cardano (ADAUSDT) weekly/daily technicalsLooked over this for a friend. Rowland I would love your feedback in the comments 🫡
I will see my biggest expectation is for this to make it's way into the weekly imbalance range below the weekly Mother Candle we are existing within. The entire crypto market seems to want to revisit some key lows to correct some inefficiently delivered rally ranges (meaning too many pending orders left behind due to price not coming back to grab them, happens when HUGE money places--attempts to place/fill--bulk orders).
We are getting what I think is a temporary bullish correction due to taking of profits at key lows. It is my belief/observation that after correcting the newly minted bearish range (grabbing pending shorts above daily highs--turtle soup I think they call it), we will be able to drive down into the bullish imbalance weekly candle's range.
Let's see how we go! 😈

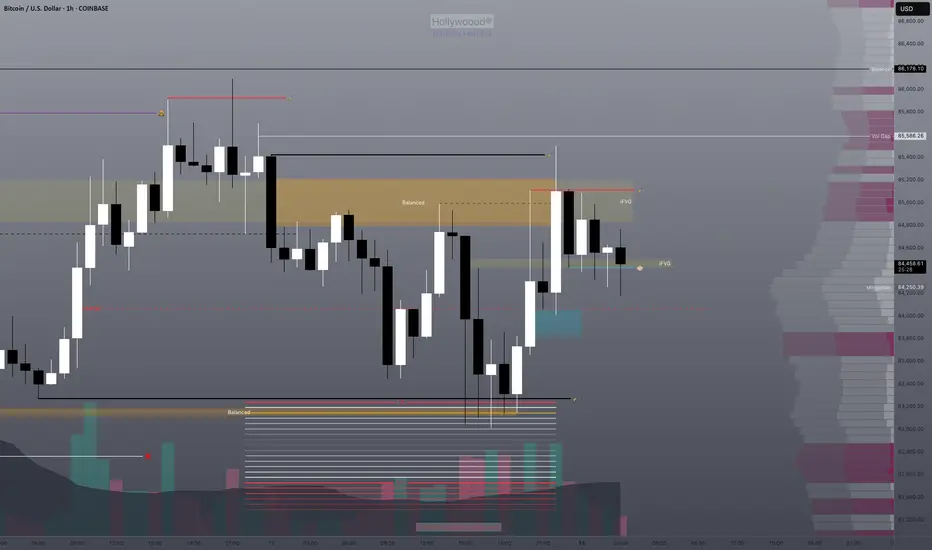
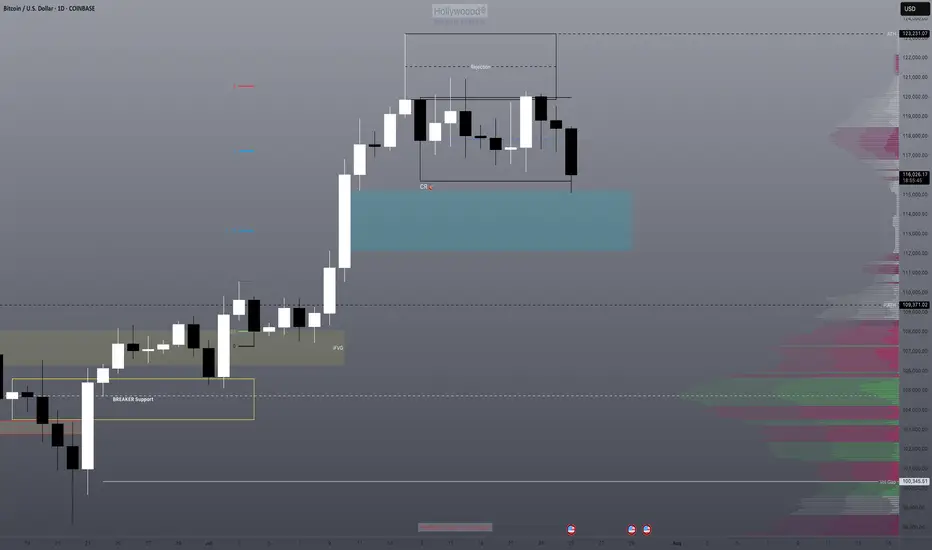
Will the low of this BTC zone be used as a buy point?We have an imbalance high being tested. We know that this also represents the consolidation range low where both TPs and long entries will be triggered.
Will this be enough to send us back bullish or will be need further correction of the imbalance? I think there's a high probability of this with DXY also running into it's daily bearish imbalance range.
Is the DOLLAR bullish? Look at the weekly support zone levelsI am trying to figure out what the recent bullish days mean within the overall range.
Please let me know what you think 🙏🏾

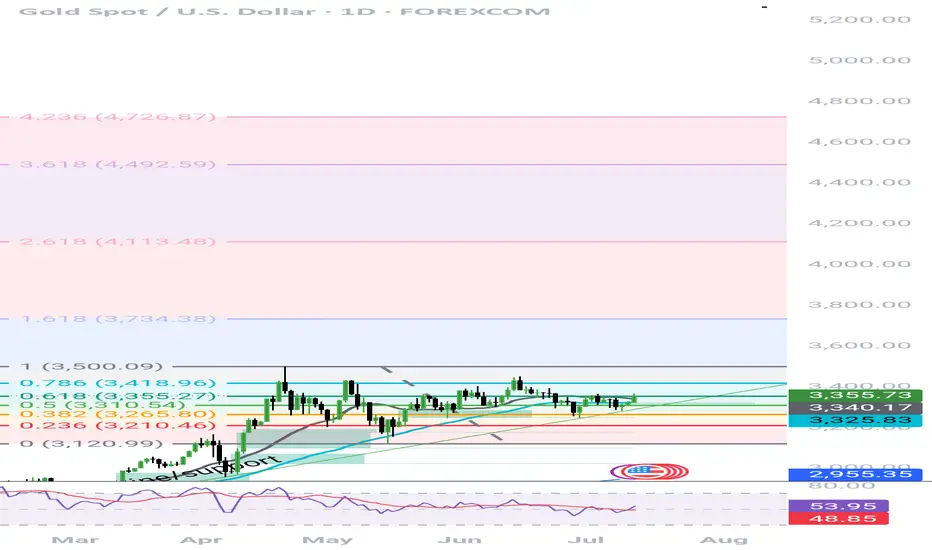
Gold TP'sGold consolidation range has been marked out from wick to wick, tapped into the liquidity area at 3120 area...only up from here...tp's are shown in the photo with 1.618, and the other tp levels above it. I love Fibonacci retracement, learn fair value gaps, learn about liquidity areas, and and learn about candle range theory, you're welcome
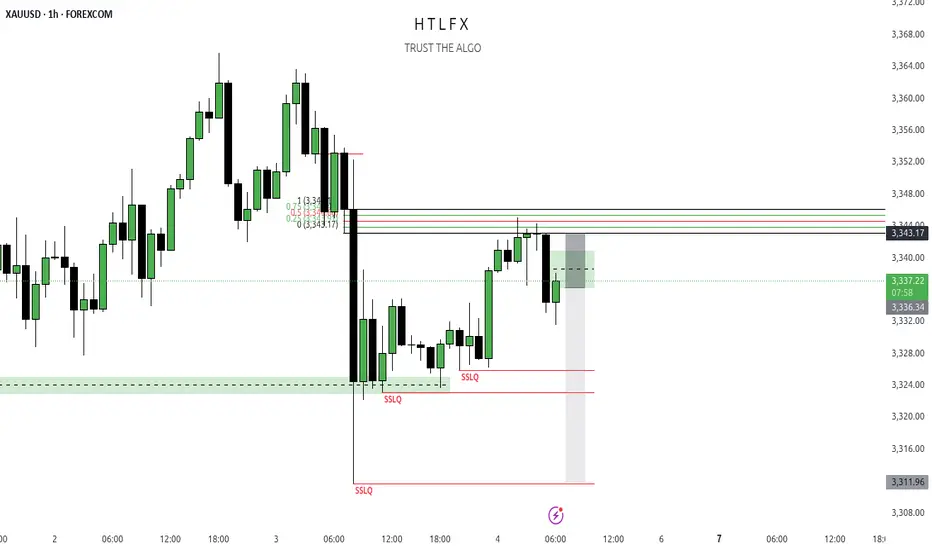
Gold HFTHTF trade using fib 0.5 respected + Dealing range on the LTF
waiting for retracement didn't happen gold is stronger today so the best is to look at HTF nice SIBI waiting for the purg targeting SSLQ be carfull 4th of july so market will close early and maybe we don't reach our target so take profit maybe we gonna face reversal so too risky
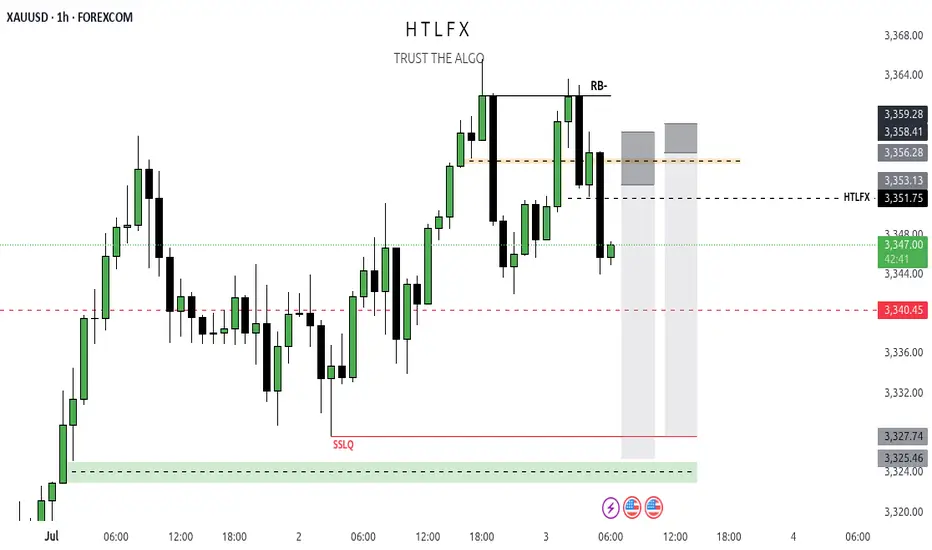
GOLD short( RB- ) + Dealing Range + NFP Day ( Volatile )
so yeah pd array rejection block sign of weakness look for short
than wait for dealing rang than look for ur entry type it's on u each trader has an entry type so look to excute targeting SSLQ sell side liquidity simple
Rince repeat follow me on X check my profile
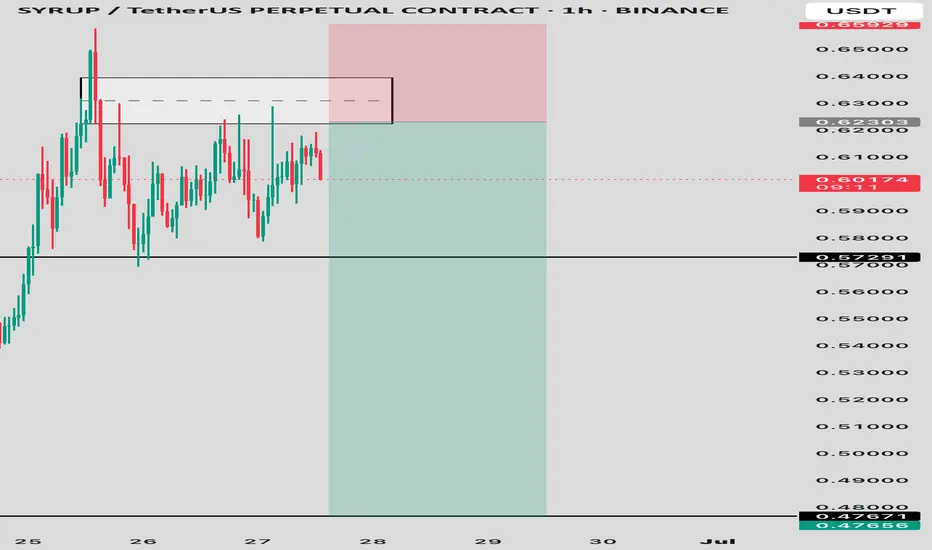
SYRUP/USDT – 1H AnalysisSYRUP has recently tapped into a major resistance zone around 0.6230, showing multiple rejections with long wicks and sharp sell-offs. This price area has acted as a supply zone, indicating strong seller presence.
Key Levels:
• Entry (supply zone): 0.62303
• First Target: 0.57291 – minor support / previous structure level
• Final Target: 0.47671 – major demand zone
• Invalidation / SL: Above 0.6580
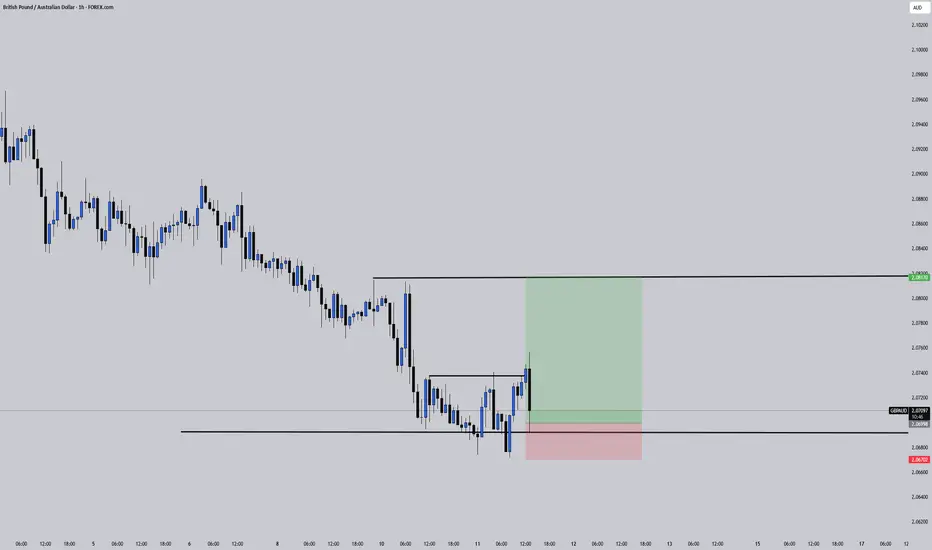
Did You Catch the Sweep & Shift on GBPAUD?Sometimes the market whispers its intentions before making a move — and this was one of those moments. This GBPAUD setup was built on the core principles of Candle Range Theory (CRT):
Sweep of the Previous Day’s Low (PDL)
Break of Structure (BOS) confirming a shift in momentum
Entry retracement into the Fair Value Gap (FVG)
What stood out here was the precision of the sweep and how price reacted cleanly after BOS, tapping into the FVG zone and immediately pushing toward the high-probability target.
No indicators, no noise, just clean market structure and smart money behavior.
The temptation to enter early was real, but the edge came from waiting for price to validate itself. A textbook example of how patience and plan adherence outweigh prediction .
Gold stuck slowly correcting the bearish imbalancesExplained in video. Please let me know if there is anything I missed in this analysis!
Don't forget to like and share 🔑

Eur, Gbp & DXY Dynamics: We have reached fair valueWith equilibrium being established we are stuck in an internal liquidity range. We do expect the trending targets to be hit although we are seeing a preliminary shift in structure.
If there was anything I missed in this analysis please let me know. Share this with anyone who may be interested 🙏🏾

Gold has option to go into a steep bullish retest of broken lowsExplanation in video. Let me know if there was anything I missed in this analysis.
Share with anyone who may be interested 🫡

NASDAQ Still failing to secure meaningful closes above the rangeAll explained in video. Please let me know if there is anything I may have missed in this analysis.
Thanks and share with anyone who may be interested 🔓

EURUSD failing to close above a key daily highThis is a quick analysis but we are at a key bearish range that may give a double top on the weekly/daily. If this Daily mother candle abides by Candle Range Theory mechanics, we will see it's low taken out.
We'll see 🎯

Nasdaq giving hints of bearishness failing to close above rangePlease review what I think I'm seeing. If you have any comments in regard to these potential levels they are always welcome.
I believe we may be actually bearish from here but without a daily close below the highest block, my decided choice must be neutral. Purely mechanical analysis will save your portfolio 💎
Don't forget to subscribe & share this with someone who is learning 🙏🏾

Is NASDAQ ready to correct for a few days?We have a couple of doji candles on the daily chart forming out of a bearish imbalance range in the relative premium. This is the perfect place to test the lows for stops.
We are still bullish but I am going to go neutral for this forecast in anticipation of a slight correction.
Share this with someone who needs a complete top down analysis of where we are staring this week!

Nasdaq: Where should I buy from next? New bullish orderblockWe are hunting the next buyzone already. The correction zone is printing now.
This is how you accurately forecast your next entry ahead of time. Learn how corrections should work. Long below higher time frame (Hourly/Daily/Weekly) lows is the name of the game.
This should be easy work, and you can feel free to look for longs below 15m lows on the way to the targets above. Once we hit those, we should look for correction after closing below hourly candles, the same way we were able to freely take long after close above hourly candles today just as I prescribed while it was dropping.
This is just the rules of the game 🔓 gotta be sharp enough to observe them and trust the mechanics. Thanks for tuning in

GOLD LONG-TERM FORECAST UPDATEMonthly Chart: Gold is forming an internal high and low, indicating a potential reversal.
Weekly Chart: Inside bar formation, waiting for market sweep. Expecting a bullish move after sweep.
Daily Chart: CRT pattern confirmed, targeting lower levels. Our bullish area remains at $2580-
Stay tuned for further updates!

CRT CREATEDThis week was a sweep and continue bullish, this was after the market draw on liquidity to send it off upwards. so expectation is the high will be taken out this week or next week if Thursday doesn't fulfil the wish. Monday was the low of the week during New York session causing Tuesday to follow the trend and break Monday's high
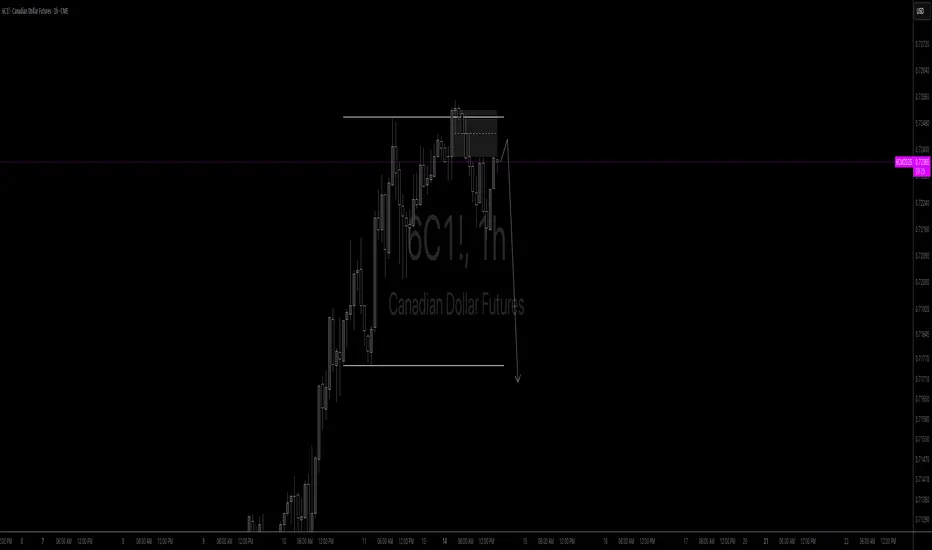
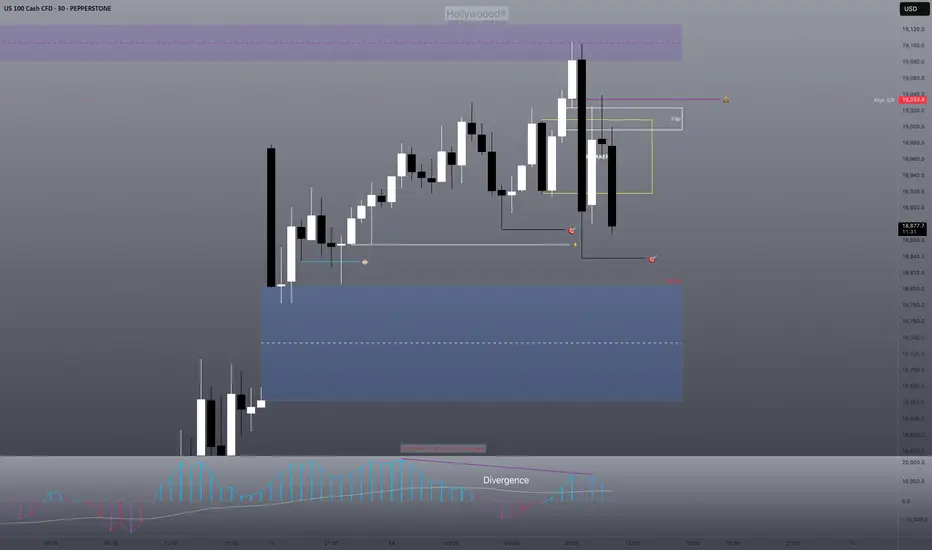
Does the Nasdaq keep dropping after approaching the nearby high?I have 2 zone that are coded as a "no close above" that should have held no issue
The reason why I am short mainly is because we haven't visit 50% of the New Week Opening Gap and we have rejected from 50% of the bearish gap above the range. As well as volumetric divergence after the rally.
I want to see this gap at least partially filled before anything else this week can happen.
Recent BTC hourly candles: Pure algo magick!Look at how these candles are playing with the lows and the body levels both algorithmically. This is HTF bot work