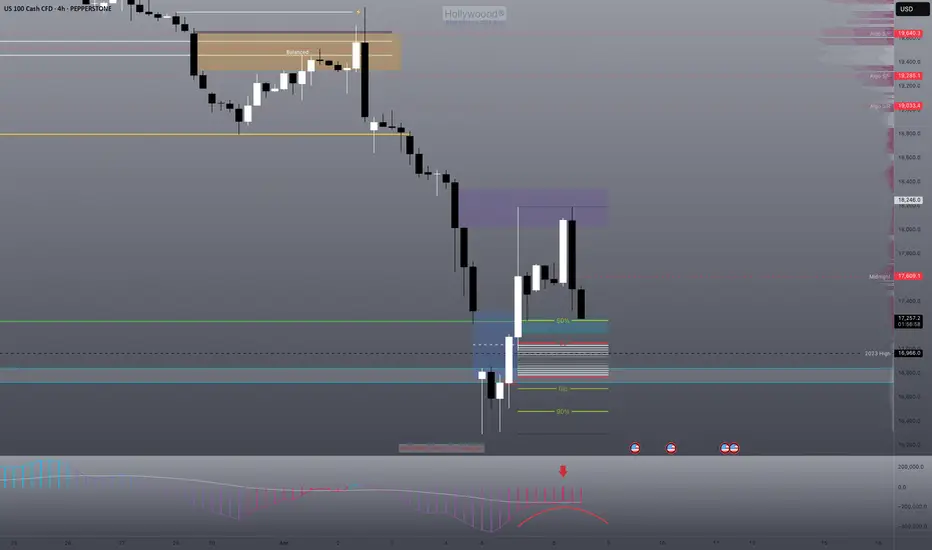
Where is the support level for Nasdaq?! Is the bloodbath over?Bearish fair value gap ranges are taking over this chart and when we rally up into them, they have been sending us down over and over.
This week we have had the advantage of a bearish gap from last week's low. This gave us clear reason to seek longs to fill the gap. Now we have a small cushion of long interest in this range after retesting the 2023 yearly candle's broken high.
As long as we remain above this yearly level--16.960ish (Using last year's low for NQ 17,570ish)-- we will see a neat consolidation and sitting upon these levels before the rally that may lead us out of this range.
That is what I expect, however, if we lose these levels, you already know we are headed to the dungeon of a true recession.
20 min breakdown:
CRT
Ethereum to 4kUsing the CRT approach, price dip below precious month's low and into weekly FVG signifies a potential upmove towards and above 4000

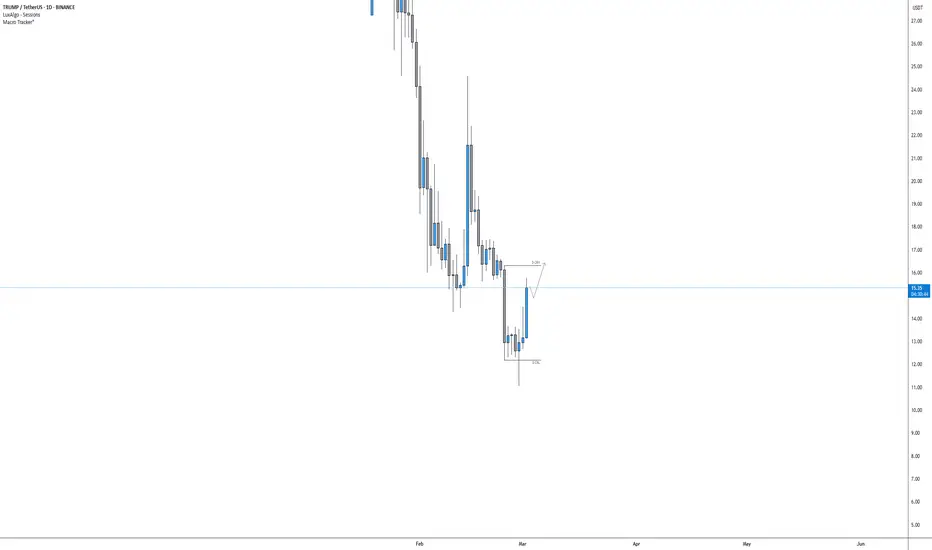
TRUMPUSD Daily CRTDisclaimer: The charts and analysis presented here are based on my personal research and insights. I am not a financial advisor, and this content is not intended as financial advice or a recommendation to buy or sell any financial instruments. Please conduct your own research and consult with a professional advisor before making any investment decisions.
Credit: Special thanks to Romeo and ICT for their invaluable contributions to the forex industry.
ETHUSD Daily CRTDisclaimer: The charts and analysis presented here are based on my personal research and insights. I am not a financial advisor, and this content is not intended as financial advice or a recommendation to buy or sell any financial instruments. Please conduct your own research and consult with a professional advisor before making any investment decisions.
Credit: Special thanks to Romeo and ICT for their invaluable contributions to the forex industry.

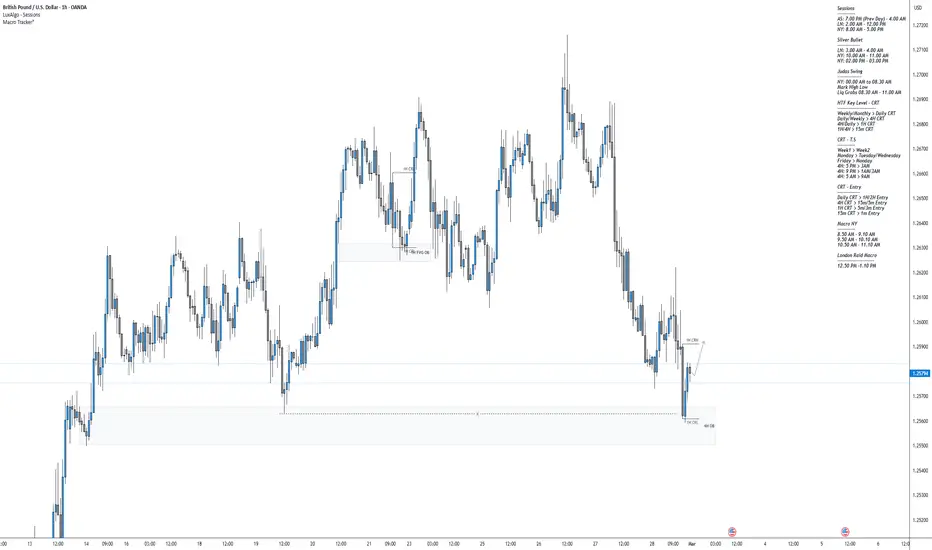
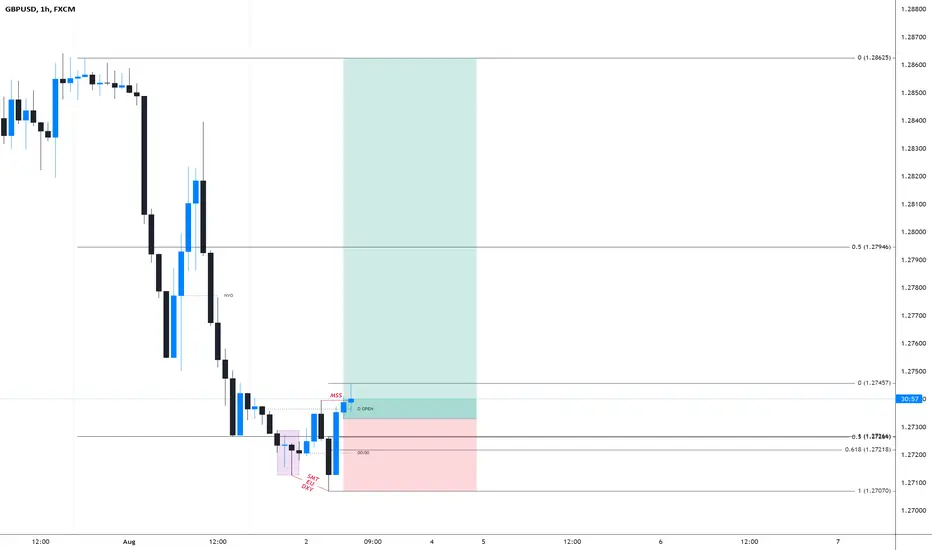
GBPUSD 1H CRT Disclaimer: The charts and analysis presented here are based on my personal research and insights. I am not a financial advisor, and this content is not intended as financial advice or a recommendation to buy or sell any financial instruments. Please conduct your own research and consult with a professional advisor before making any investment decisions.
Credit: Special thanks to Romeo and ICT for their invaluable contributions to the forex industry.
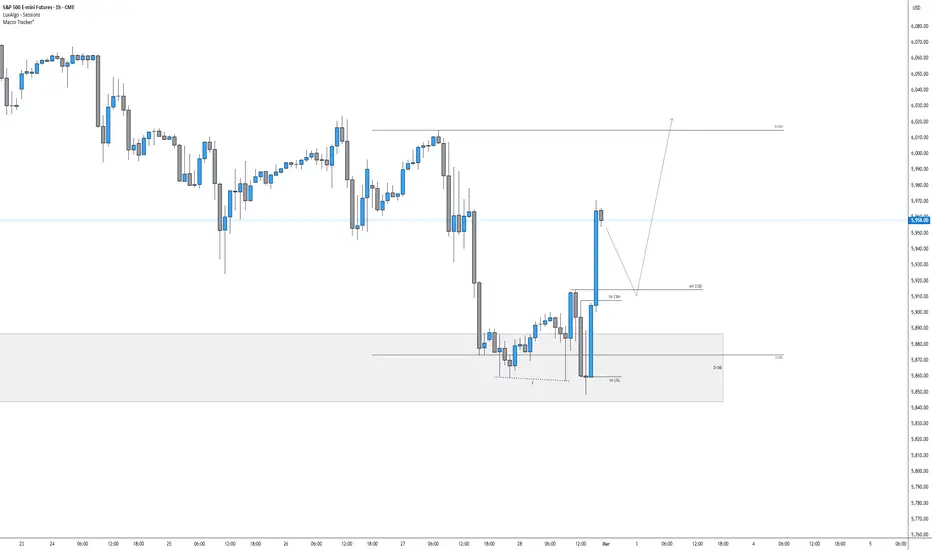
S&P 500 Daily CRT - 1H EntryDisclaimer: The charts and analysis presented here are based on my personal research and insights. I am not a financial advisor, and this content is not intended as financial advice or a recommendation to buy or sell any financial instruments. Please conduct your own research and consult with a professional advisor before making any investment decisions.
Credit: Special thanks to Romeo and ICT for their invaluable contributions to the forex industry.
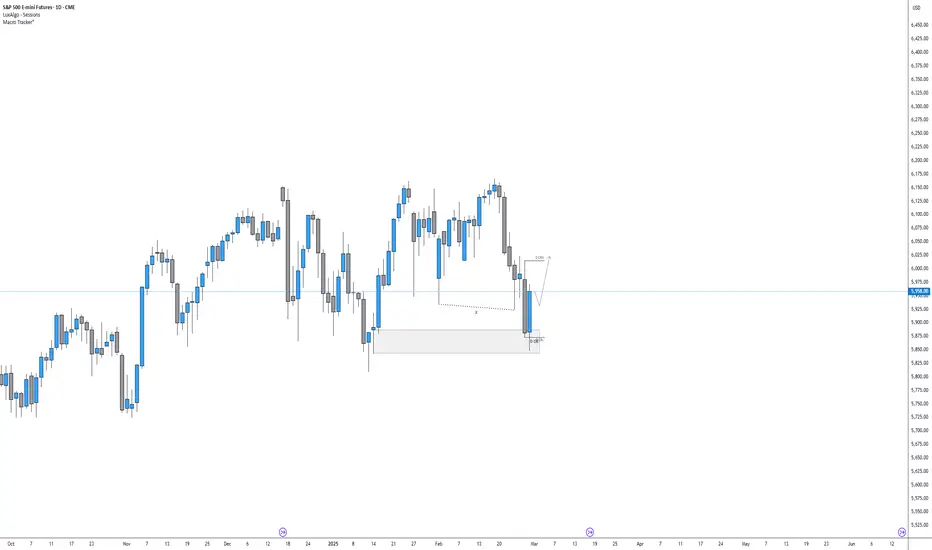
S&P 500 Daily CRTDisclaimer: The charts and analysis presented here are based on my personal research and insights. I am not a financial advisor, and this content is not intended as financial advice or a recommendation to buy or sell any financial instruments. Please conduct your own research and consult with a professional advisor before making any investment decisions.
Credit: Special thanks to Romeo and ICT for their invaluable contributions to the forex industry.
BTCUSD - Daily CRTDisclaimer: The charts and analysis presented here are based on my personal research and insights. I am not a financial advisor, and this content is not intended as financial advice or a recommendation to buy or sell any financial instruments. Please conduct your own research and consult with a professional advisor before making any investment decisions.
Credit: Special thanks to Romeo and ICT for their invaluable contributions to the forex industry.

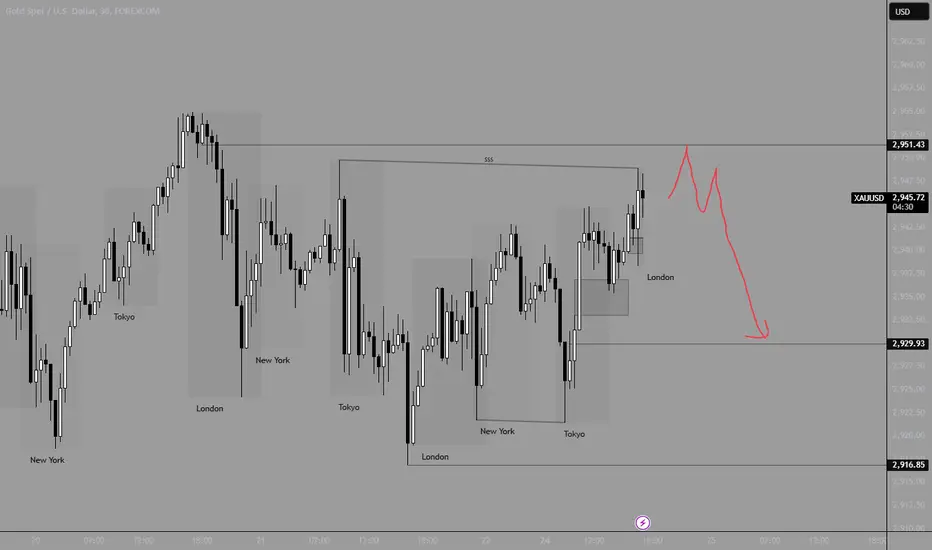
XAU/USD SellClarification : If the price forms an accumulation below an OB/FVG, it could be a potential selling area. Ensure that the price makes lower lows for confirmation before entering the trade. Also, manage your money wisely.
DOGEUSDT Bullish Bias
Turtle Soup of the Old Low and it was from a BISI
We have to target the Buyside Liquidity
Please note that this requires huge patience to hold the bullish move
I will give updates

$SPY $EUCRT setup, we're primed to see a bullish reversal to fill the CRT High through the afternoon
Wait for your setup
Find your entry
Pay yourself

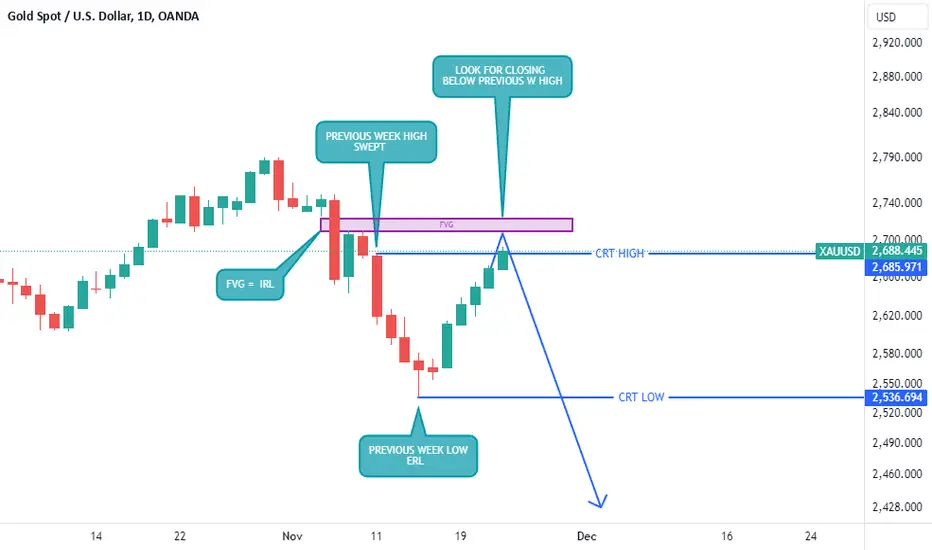
GOLD HIGHT PROBABILITY SETUP!!According to Candle Range Theory (CRT), GOLD price swept the previous week high (CRT LOW), and this daily candle (today's candle (22/11/2024)) must close below the previous week high (CRT HIGH). If this daily candlestick closes below, the whole week next week (25/11/2024) gold will be selling (bearish). The target will be Previous week low (CRT LOW).
Another thing, on weekly timeframe you will see gold has touched the bearish fair value gap (FVG) which was our internal range liquidity (IRL) but on Daily timeframe we still have to touch the bearish FVG with a rejection, then we can sell.
“I just wait until there is money lying in the corner, and all I have to do is go over there and pick it up. I do nothing in the meantime.” - Jim Rogers

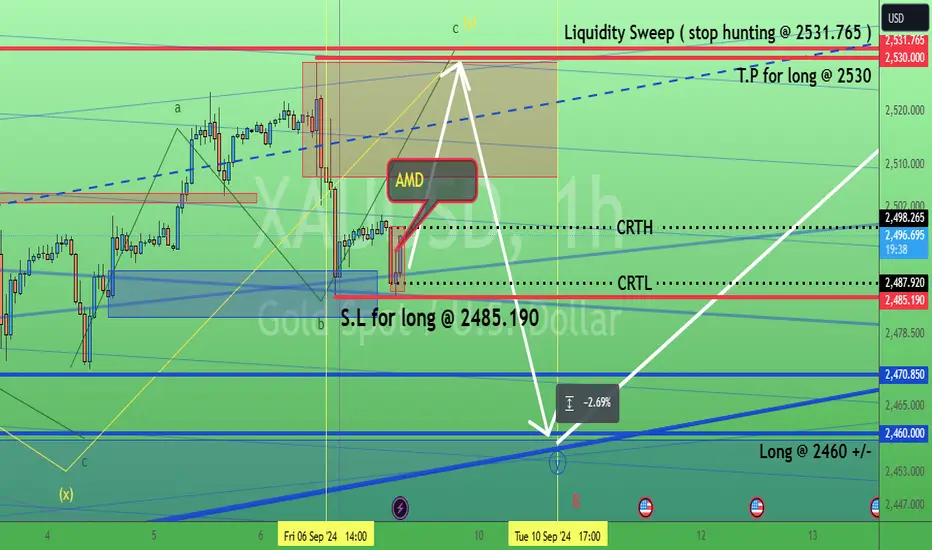
Gold is waiting for CPI, 10/Spet/24XAUUSD still inside 2530 - 2470 ( $60 ) range. While it need 100 Bucks to fuel the bulls. From 2460 toward 2560 or 2600?

Gold's last leg to hunt at 2530 +/-. 9/Sept/24XAUUSD probably resuming its intraday day uptrend approaching major resistance again at 2530 +- . Grabbing more buyer's "liquidity" before "smashing" its price below 2500 ( 2460 +/).
CRT + Liquidity Sweep on the DAXLet's make Money!!!
Trade responsibly and apply proper risk management. Happy Weekend


High probable GBPUSD Trade for NFP [02/August/2024]We are expecting Bullish Move for FX:GBPUSD
Best NFP Trade for FX:GBPUSD
Today is : 02/August/2024
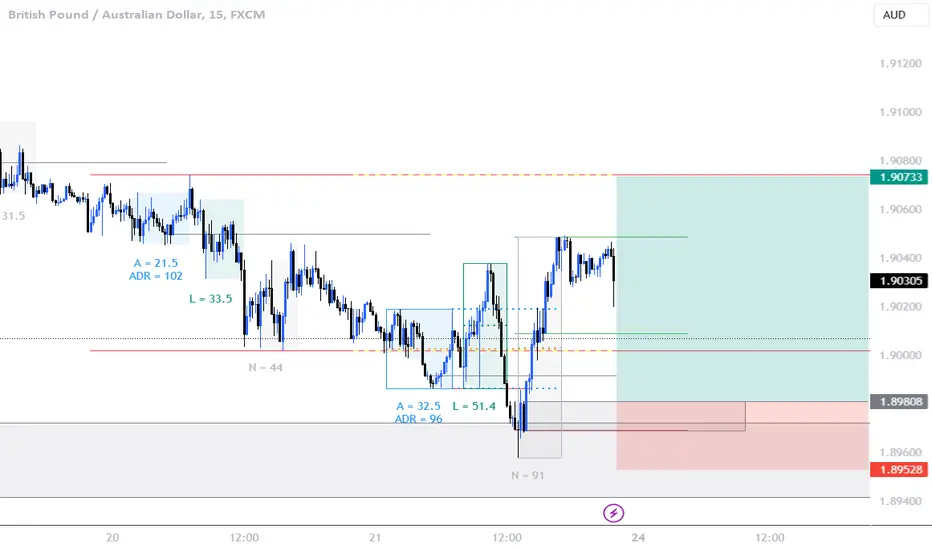
gbpaud looking for higher pricesdaily time frame has taken previous days low and closed back within
4hr has come into a 4h poi
15m has push up breaking structures
monday will be looking for longs depending how we open and what asia session does taking price back up to arond 1.90741 which is a daily high
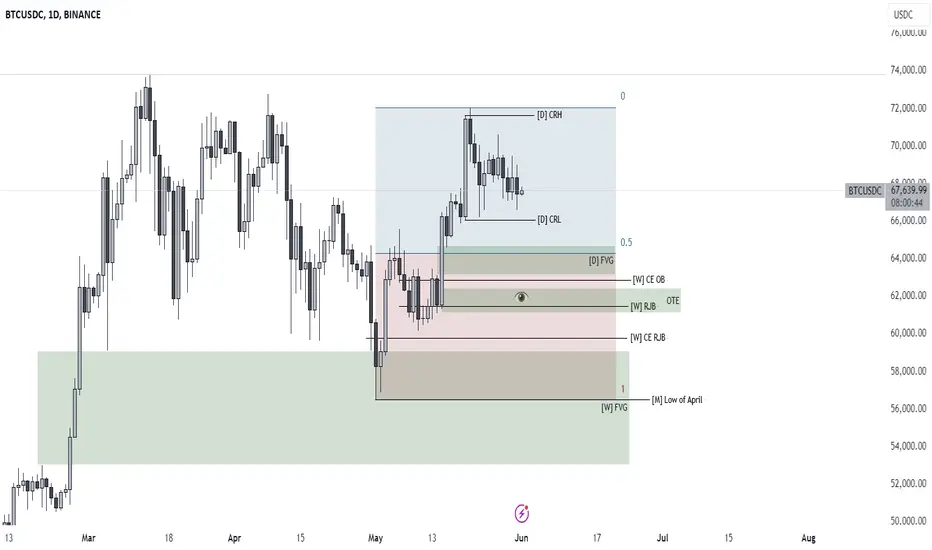
BTC/USDC looking for buys after capturing stops.Hello everyone !
In this analysis we are waiting for BTC to purge orders below the CRL and enter the liquidity pool so we can start looking at purchases, let's see how the market will behave after the
US Average Hourly, US Non-Farm Employment Change and US Unemployment Rate.
For now, just wait, patience is the key!