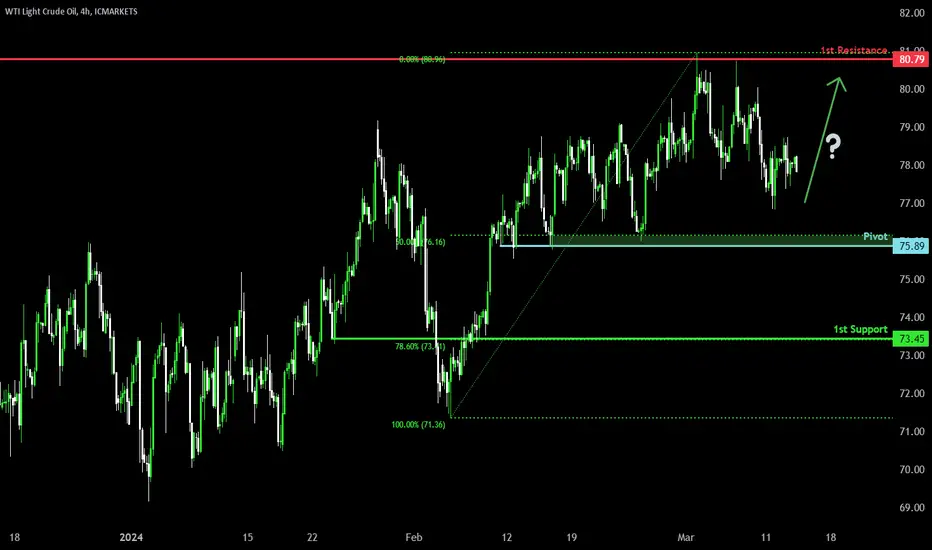
Falling towards 50% Fibonacci supportWTI oil (XTI/USD) is falling towards a pullback support level at 75.89 that aligns close to the 50.0% Fibonacci retracement level which has been identified as a pivot point. Could price bounce off this level and potentially climb higher towards the 1st resistance?
Pivot: 75.89
Support: 73.45
Resistance: 80.79
Risk Warning:
Trading Forex and CFDs carries a high level of risk to your capital and you should only trade with money you can afford to lose. Trading Forex and CFDs may not be suitable for all investors, so please ensure that you fully understand the risks involved and seek independent advice if necessary.
Disclaimer:
The above opinions given constitute general market commentary, and do not constitute the opinion or advice of IC Markets or any form of personal or investment advice.
Any opinions, news, research, analyses, prices, other information, or links to third-party sites contained on this website are provided on an "as-is" basis, are intended only to be informative, is not an advice nor a recommendation, nor research, or a record of our trading prices, or an offer of, or solicitation for a transaction in any financial instrument and thus should not be treated as such. The information provided does not involve any specific investment objectives, financial situation and needs of any specific person who may receive it. Please be aware, that past performance is not a reliable indicator of future performance and/or results. Past Performance or Forward-looking scenarios based upon the reasonable beliefs of the third-party provider are not a guarantee of future performance. Actual results may differ materially from those anticipated in forward-looking or past performance statements. IC Markets makes no representation or warranty and assumes no liability as to the accuracy or completeness of the information provided, nor any loss arising from any investment based on a recommendation, forecast or any information supplied by any third-party.
Crude
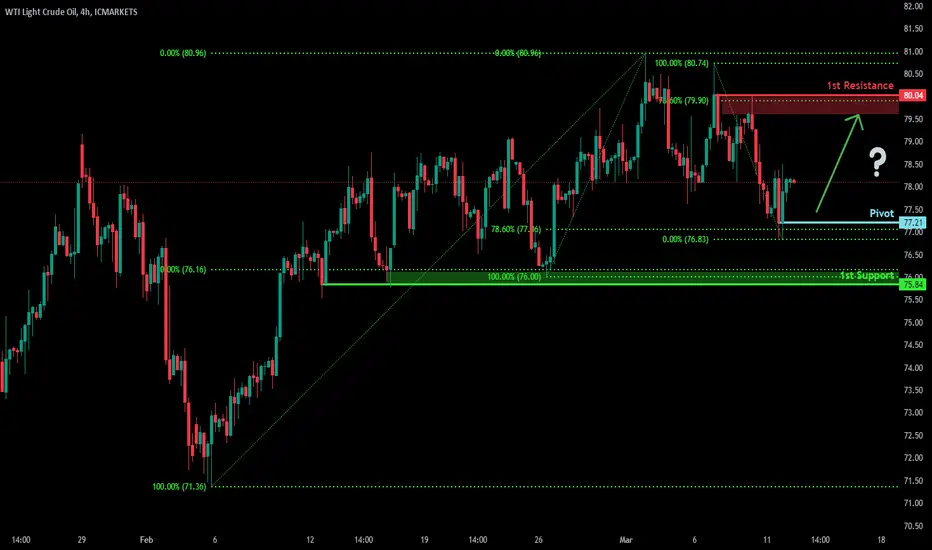
Potential bullish bounceWTI oil (XTIUSD) is falling towards a pullback support level at 77.21 which has been identified as a pivot point. Could price bounce off this level and potentially climb higher towards the 1st resistance?
Pivot: 77.21
Support: 75.84
Resistance: 80.04
Risk Warning:
Trading Forex and CFDs carries a high level of risk to your capital and you should only trade with money you can afford to lose. Trading Forex and CFDs may not be suitable for all investors, so please ensure that you fully understand the risks involved and seek independent advice if necessary.
Disclaimer:
The above opinions given constitute general market commentary, and do not constitute the opinion or advice of IC Markets or any form of personal or investment advice.
Any opinions, news, research, analyses, prices, other information, or links to third-party sites contained on this website are provided on an "as-is" basis, are intended only to be informative, is not an advice nor a recommendation, nor research, or a record of our trading prices, or an offer of, or solicitation for a transaction in any financial instrument and thus should not be treated as such. The information provided does not involve any specific investment objectives, financial situation and needs of any specific person who may receive it. Please be aware, that past performance is not a reliable indicator of future performance and/or results. Past Performance or Forward-looking scenarios based upon the reasonable beliefs of the third-party provider are not a guarantee of future performance. Actual results may differ materially from those anticipated in forward-looking or past performance statements. IC Markets makes no representation or warranty and assumes no liability as to the accuracy or completeness of the information provided, nor any loss arising from any investment based on a recommendation, forecast or any information supplied by any third-party.
WTI Oil H1 | Potential bullish bounceWTI oil (USOIL) has just bounced off a pullback support and could potentially climb higher from here.
Buy entry is at 77.293 which is a pullback support.
Stop loss is at 75.600 which is a level that lies underneath a pullback support.
Take profit is at 79.914 which is a pullback resistance.
High Risk Investment Warning
Trading Forex/CFDs on margin carries a high level of risk and may not be suitable for all investors. Leverage can work against you.
Stratos Markets Limited (www.fxcm.com):
CFDs are complex instruments and come with a high risk of losing money rapidly due to leverage. 66% of retail investor accounts lose money when trading CFDs with this provider. You should consider whether you understand how CFDs work and whether you can afford to take the high risk of losing your money.
Stratos Europe Ltd, previously FXCM EU Ltd (www.fxcm.com):
CFDs are complex instruments and come with a high risk of losing money rapidly due to leverage. 70% of retail investor accounts lose money when trading CFDs with this provider. You should consider whether you understand how CFDs work and whether you can afford to take the high risk of losing your money.
Stratos Trading Pty. Limited (www.fxcm.com):
Trading FX/CFDs carries significant risks. FXCM AU (AFSL 309763), please read the Financial Services Guide, Product Disclosure Statement, Target Market Determination and Terms of Business at www.fxcm.com
Stratos Global LLC (www.fxcm.com):
Losses can exceed deposits.
Please be advised that the information presented on TradingView is provided to FXCM (‘Company’, ‘we’) by a third-party provider (‘TFA Global Pte Ltd’). Please be reminded that you are solely responsible for the trading decisions on your account. There is a very high degree of risk involved in trading. Any information and/or content is intended entirely for research, educational and informational purposes only and does not constitute investment or consultation advice or investment strategy. The information is not tailored to the investment needs of any specific person and therefore does not involve a consideration of any of the investment objectives, financial situation or needs of any viewer that may receive it. Kindly also note that past performance is not a reliable indicator of future results. Actual results may differ materially from those anticipated in forward-looking or past performance statements. We assume no liability as to the accuracy or completeness of any of the information and/or content provided herein and the Company cannot be held responsible for any omission, mistake nor for any loss or damage including without limitation to any loss of profit which may arise from reliance on any information supplied by TFA Global Pte Ltd.
The speaker(s) is neither an employee, agent nor representative of FXCM and is therefore acting independently. The opinions given are their own, constitute general market commentary, and do not constitute the opinion or advice of FXCM or any form of personal or investment advice. FXCM neither endorses nor guarantees offerings of third-party speakers, nor is FXCM responsible for the content, veracity or opinions of third-party speakers, presenters or participants.

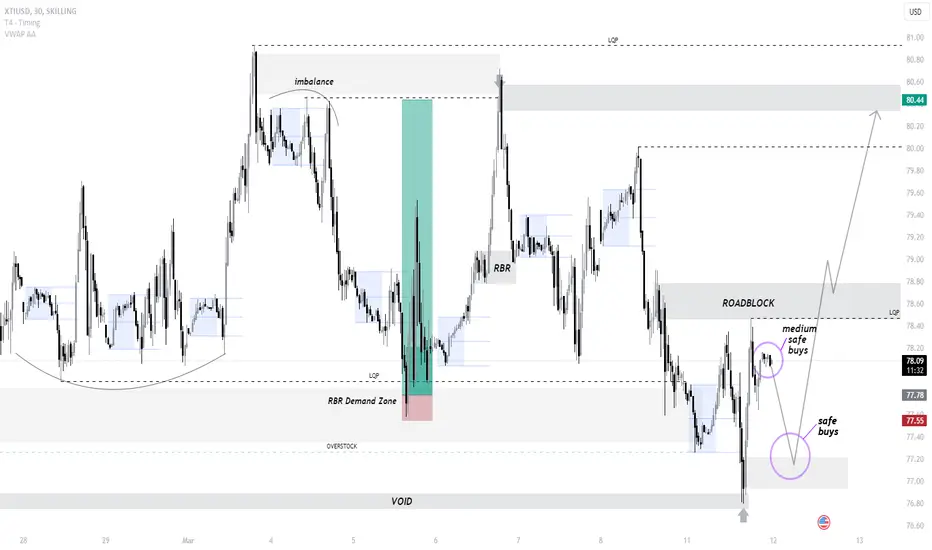
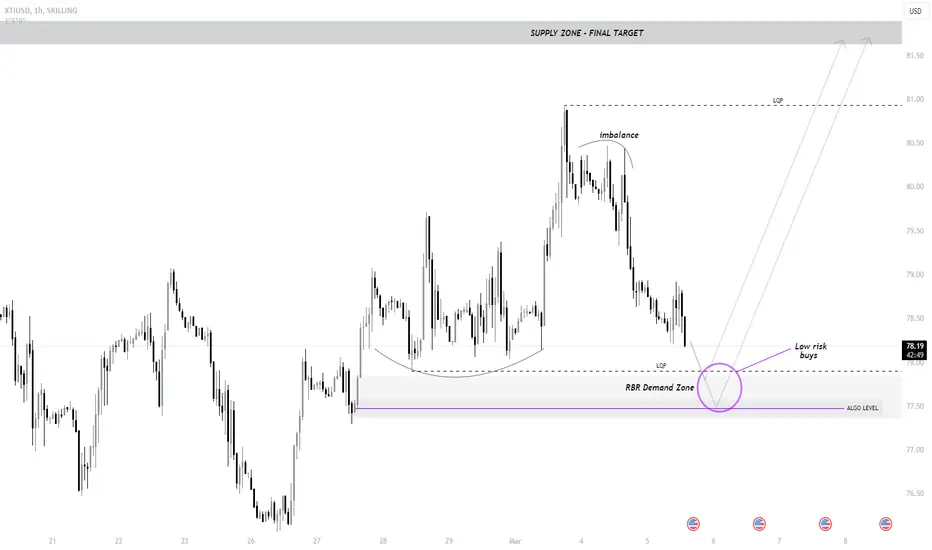
XTIUSD (CRUDE OIL) OUTLOOK | 30mExternal liquidity inducement -> break of market structure -> POI mitigation (?)
What do you think?
LQP = Liquidity Pool
RBR = Rally Base Rally
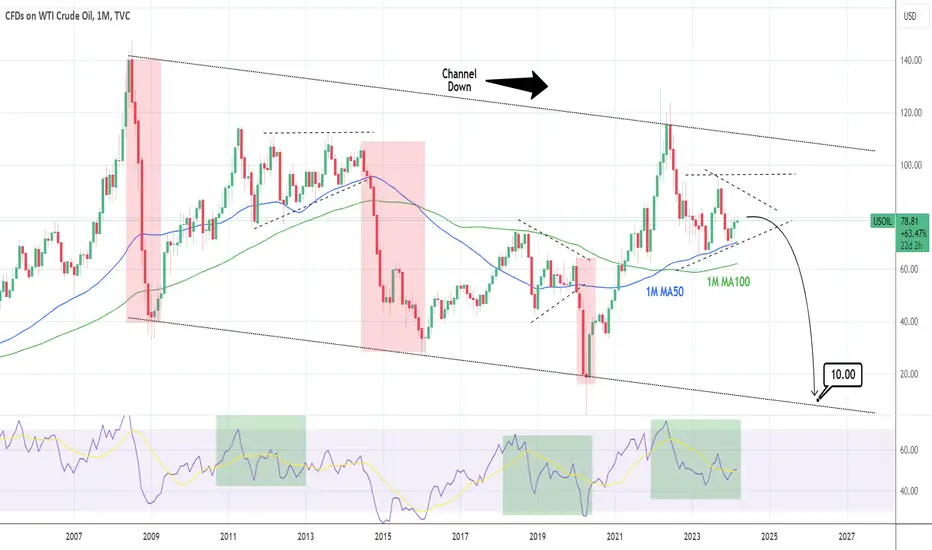
WTI CRUDE OIL: Huge sell long term and this is why.WTI Crude Oil is neutral on its technical outlook across the three different long term timeframes 1D, 1W and 1M (RSI = 50.461, MACD = 2.330, ADX = 15.020). The latter is the timeframe that we are looking at on this chart and as you can see, Oil is inside a Triangle pattern, which inside the 17 year Channel Down is the pattern that consolidates the price before a major selloff to its bottom.
The similarities on the RSI sequences is further proof, so on the long term we are bearish on WTI (TP = 10.00), whose upside is limited to the 95.50 Resistance.
## If you like our free content follow our profile to get more daily ideas. ##
## Comments and likes are greatly appreciated. ##
CRUDE OIL Will Keep Growing! Buy!
Hello,Traders!
CRUDE OIL is trading in an
Uptrend along the rising support
From where we are already seeing a
Bullish reaction so I think that
The price keep growing
Buy!
Like, comment and subscribe to help us grow!
Check out other forecasts below too!

Approaching overlap supportWTI oil (XTIUSD) has ranged between 78.09 and 80.79 since 28th February. It is falling towards an overlap support level at 78.09 which has been identified as a pivot point. Could price bounce off this level once again and potentially climb higher towards the 1st resistance?
Pivot: 78.09
Support: 76.26
Resistance: 80.79
Risk Warning:
Trading Forex and CFDs carries a high level of risk to your capital and you should only trade with money you can afford to lose. Trading Forex and CFDs may not be suitable for all investors, so please ensure that you fully understand the risks involved and seek independent advice if necessary.
Disclaimer:
The above opinions given constitute general market commentary, and do not constitute the opinion or advice of IC Markets or any form of personal or investment advice.
Any opinions, news, research, analyses, prices, other information, or links to third-party sites contained on this website are provided on an "as-is" basis, are intended only to be informative, is not an advice nor a recommendation, nor research, or a record of our trading prices, or an offer of, or solicitation for a transaction in any financial instrument and thus should not be treated as such. The information provided does not involve any specific investment objectives, financial situation and needs of any specific person who may receive it. Please be aware, that past performance is not a reliable indicator of future performance and/or results. Past Performance or Forward-looking scenarios based upon the reasonable beliefs of the third-party provider are not a guarantee of future performance. Actual results may differ materially from those anticipated in forward-looking or past performance statements. IC Markets makes no representation or warranty and assumes no liability as to the accuracy or completeness of the information provided, nor any loss arising from any investment based on a recommendation, forecast or any information supplied by any third-party.

WTI Oil H4 | Falling to pullback supportWTI oil (USOIL) is falling towards a pullback support and could potentially bounce off this level to climb higher.
Buy entry is at 78.007 which is a pullback support.
Stop loss is at 76.800 which is a level that lies underneath a pullback support that aligns with the 38.2% Fibonacci retracement level.
Take profit is at 80.834 which is a pullback resistance.
High Risk Investment Warning
Trading Forex/CFDs on margin carries a high level of risk and may not be suitable for all investors. Leverage can work against you.
Stratos Markets Limited (www.fxcm.com):
CFDs are complex instruments and come with a high risk of losing money rapidly due to leverage. 66% of retail investor accounts lose money when trading CFDs with this provider. You should consider whether you understand how CFDs work and whether you can afford to take the high risk of losing your money.
Stratos Europe Ltd, previously FXCM EU Ltd (www.fxcm.com):
CFDs are complex instruments and come with a high risk of losing money rapidly due to leverage. 70% of retail investor accounts lose money when trading CFDs with this provider. You should consider whether you understand how CFDs work and whether you can afford to take the high risk of losing your money.
Stratos Trading Pty. Limited (www.fxcm.com):
Trading FX/CFDs carries significant risks. FXCM AU (AFSL 309763), please read the Financial Services Guide, Product Disclosure Statement, Target Market Determination and Terms of Business at www.fxcm.com
Stratos Global LLC (www.fxcm.com):
Losses can exceed deposits.
Please be advised that the information presented on TradingView is provided to FXCM (‘Company’, ‘we’) by a third-party provider (‘TFA Global Pte Ltd’). Please be reminded that you are solely responsible for the trading decisions on your account. There is a very high degree of risk involved in trading. Any information and/or content is intended entirely for research, educational and informational purposes only and does not constitute investment or consultation advice or investment strategy. The information is not tailored to the investment needs of any specific person and therefore does not involve a consideration of any of the investment objectives, financial situation or needs of any viewer that may receive it. Kindly also note that past performance is not a reliable indicator of future results. Actual results may differ materially from those anticipated in forward-looking or past performance statements. We assume no liability as to the accuracy or completeness of any of the information and/or content provided herein and the Company cannot be held responsible for any omission, mistake nor for any loss or damage including without limitation to any loss of profit which may arise from reliance on any information supplied by TFA Global Pte Ltd.
The speaker(s) is neither an employee, agent nor representative of FXCM and is therefore acting independently. The opinions given are their own, constitute general market commentary, and do not constitute the opinion or advice of FXCM or any form of personal or investment advice. FXCM neither endorses nor guarantees offerings of third-party speakers, nor is FXCM responsible for the content, veracity or opinions of third-party speakers, presenters or participants.

XTI (CRUDE OIL) OUTLOOK & TRADE UPDATE | 1hThe main imbalance that I was targetting has already been filled. The inducement led to the price going down. I'm still bullish for now waiting for the runner to play out.
Share your view in the comments!
RBR = Rally Base Rally
LQP = Liquidity Pool

XTIUSD (CRUDE OIL) TRADE IDEA | MID TERM | 1hIn my opinion the zone is highly liquid and pretty safe to trade because a lot of orders, stops and lots of liquidity will be already collected.
Share your view in the comments!
RBR = Rally Base Rally
LQP = Liquidity Pool
USOIL getting positioned for more gains? Yesterday, OPEC and its allies announced plans to extend a voluntary oil production cut of 2.2 million barrels per day through June 2024. Currently, the USOIL trades near $80.20 per barrel, and its structure is undergoing a significant change. Since late November 2023, the USOIL has traded predominantly sideways between $70 and $80 per barrel. However, last week, it broke above the resistance at $79.25 and established a new high in more than three months. By doing so, the USOIL formed an ascending channel, which is a bullish structure. In addition to that, the ADX started to tick slightly higher on the daily chart, suggesting the trend might be gaining bullish momentum. On top of that, technical indicators (on the daily chart), including RSI, MACD, and Stochastic, all turned to the upside, which is yet another bullish sign. Finally, it looks like the USOIL might be awakening and getting positioned for more gains in the short-term and medium-term future.
Illustration 1.01
While OPEC and its allies are cutting oil production, the United States is doing the opposite; in fact, the U.S. crude oil production rose approximately 10% in 2023.
Technical analysis
Daily time frame = Bullish (weak trend)
Weekly time frame = Neutral
Please feel free to express your ideas and thoughts in the comment section.
DISCLAIMER: This analysis is not intended to encourage any buying or selling of any particular securities. Furthermore, it should not be a basis for taking any trade action by an individual investor or any other entity. Your own due diligence is highly advised before entering a trade.

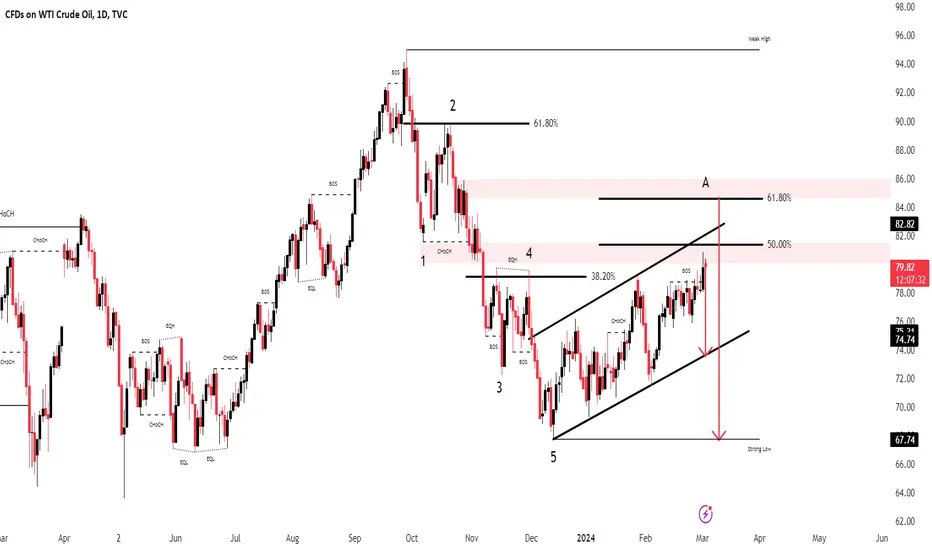
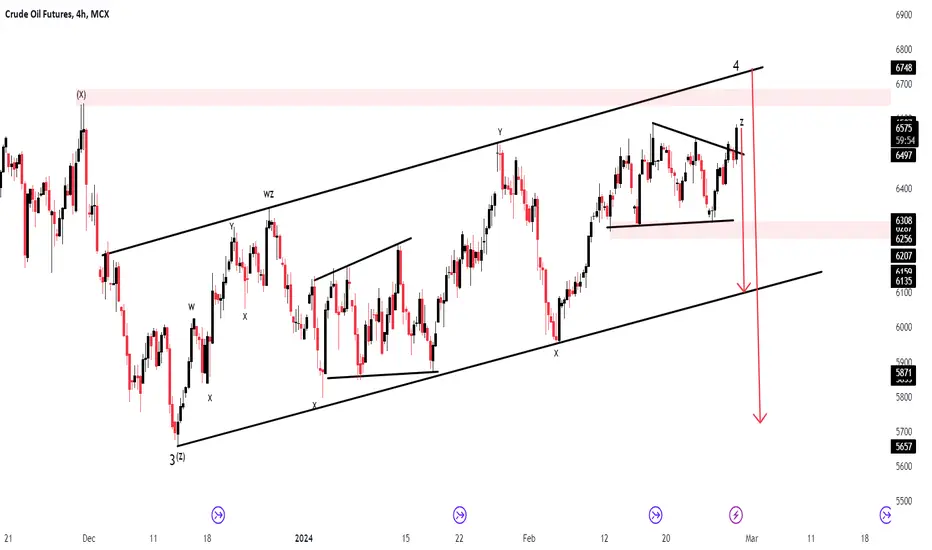
Crude OilPair : Crude Oil
Description :
Completed " 12345 " Impulsive Waves and " A " Corrective Waves
Break of Structure and Retracement
Fibonacci Level - 50.00% / 61.80%
RSI - Divergence
Bullish Channel as an Corrective Pattern in Short Time Frame
CRUDE OIL (WTI): Important Decision Ahead 🛢️
Crude Oil is currently testing a wide horizontal supply area.
Its bullish breakout may trigger a strong bullish movement.
Daily candle close above 80.8 will confirm a violation.
A bullish continuation will be expected to 82.4 level then.
❤️Please, support my work with like, thank you!❤️

WTI Oil H1 | Approaching pullback supportWTI oil (USOUSD) is falling towards a pullback support and could potentially bounce off this level to rise towards our take-profit target.
Entry: 79.694
Why we like it:
There is a pullback support that aligns close to the 38.2% Fibonacci retracement level
Stop Loss: 79.048
Why we like it:
There is a pullback support that aligns with the 38.2% Fibonacci retracement level
Take Profit: 80.963
Why we like it:
There is a pullback resistance level
Please be advised that the information presented on TradingView is provided to Vantage (‘Vantage Global Limited’, ‘we’) by a third-party provider (‘Everest Fortune Group’). Please be reminded that you are solely responsible for the trading decisions on your account. There is a very high degree of risk involved in trading. Any information and/or content is intended entirely for research, educational and informational purposes only and does not constitute investment or consultation advice or investment strategy. The information is not tailored to the investment needs of any specific person and therefore does not involve a consideration of any of the investment objectives, financial situation or needs of any viewer that may receive it. Kindly also note that past performance is not a reliable indicator of future results. Actual results may differ materially from those anticipated in forward-looking or past performance statements. We assume no liability as to the accuracy or completeness of any of the information and/or content provided herein and the Company cannot be held responsible for any omission, mistake nor for any loss or damage including without limitation to any loss of profit which may arise from reliance on any information supplied by Everest Fortune Group.


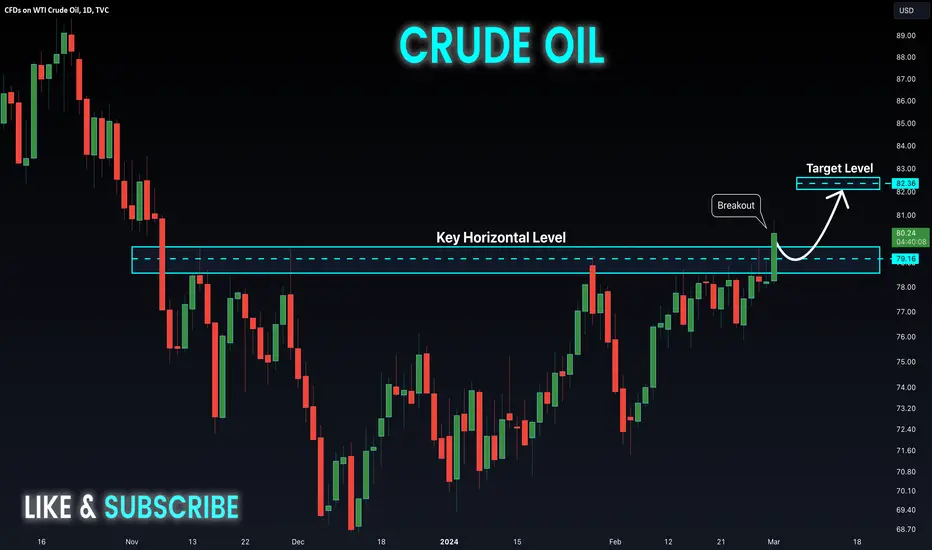
CRUDE OIL Bullish Breakout! Buy!
Hello,Traders!
CRUDE OIL broke a strong
Key horizontal level of 79.61$
And the breakout is confirmed
So we are now bullish biased
And I will be expecting
A further bullish continuation
Buy!
Like, comment and subscribe to help us grow!
Check out other forecasts below too!
WTI Oil H1 | Potential bullish bounceWTI oil (USOIL) could fall towards a pullback support and potentially bounce off this level to climb higher.
Buy entry is at 77.912 which is an overlap support.
Stop loss is at 77.000 which is a level that lies underneath a pullback support and the 50.0% Fibonacci retracement level.
Take profit is at 79.523 which is a pullback resistance.
High Risk Investment Warning
Trading Forex/CFDs on margin carries a high level of risk and may not be suitable for all investors. Leverage can work against you.
Stratos Markets Limited (www.fxcm.com):
CFDs are complex instruments and come with a high risk of losing money rapidly due to leverage. 66% of retail investor accounts lose money when trading CFDs with this provider. You should consider whether you understand how CFDs work and whether you can afford to take the high risk of losing your money.
Stratos Europe Ltd, previously FXCM EU Ltd (www.fxcm.com):
CFDs are complex instruments and come with a high risk of losing money rapidly due to leverage. 70% of retail investor accounts lose money when trading CFDs with this provider. You should consider whether you understand how CFDs work and whether you can afford to take the high risk of losing your money.
Stratos Trading Pty. Limited (www.fxcm.com):
Trading FX/CFDs carries significant risks. FXCM AU (AFSL 309763), please read the Financial Services Guide, Product Disclosure Statement, Target Market Determination and Terms of Business at www.fxcm.com
Stratos Global LLC (www.fxcm.com):
Losses can exceed deposits.
Please be advised that the information presented on TradingView is provided to FXCM (‘Company’, ‘we’) by a third-party provider (‘TFA Global Pte Ltd’). Please be reminded that you are solely responsible for the trading decisions on your account. There is a very high degree of risk involved in trading. Any information and/or content is intended entirely for research, educational and informational purposes only and does not constitute investment or consultation advice or investment strategy. The information is not tailored to the investment needs of any specific person and therefore does not involve a consideration of any of the investment objectives, financial situation or needs of any viewer that may receive it. Kindly also note that past performance is not a reliable indicator of future results. Actual results may differ materially from those anticipated in forward-looking or past performance statements. We assume no liability as to the accuracy or completeness of any of the information and/or content provided herein and the Company cannot be held responsible for any omission, mistake nor for any loss or damage including without limitation to any loss of profit which may arise from reliance on any information supplied by TFA Global Pte Ltd.
The speaker(s) is neither an employee, agent nor representative of FXCM and is therefore acting independently. The opinions given are their own, constitute general market commentary, and do not constitute the opinion or advice of FXCM or any form of personal or investment advice. FXCM neither endorses nor guarantees offerings of third-party speakers, nor is FXCM responsible for the content, veracity or opinions of third-party speakers, presenters or participants.

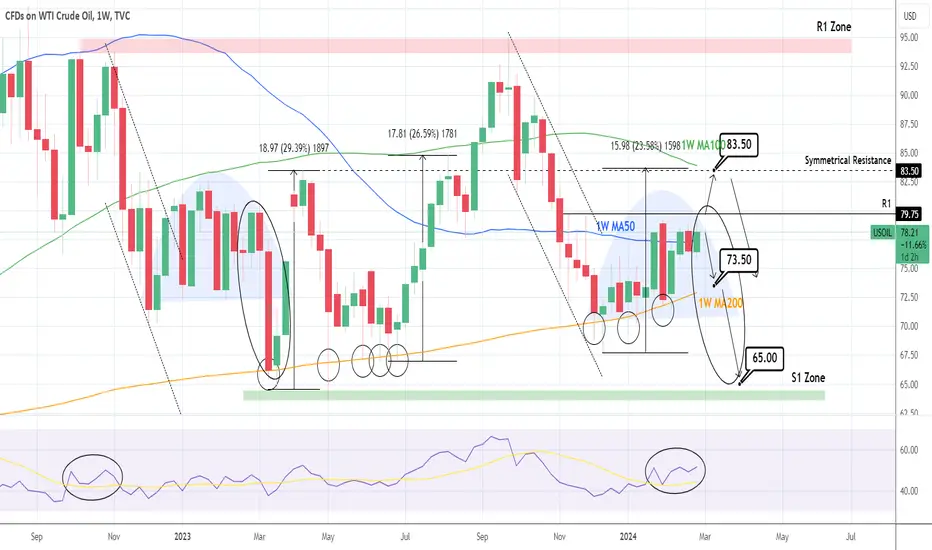
WTI OIL: Bearish more likely long term.WTI Oil is neutral on the 1W technical outlook (RSI = 51.426, MACD = -0.040, ADX = 21.884) as it is about to close the third straight week trading sideways on the 1W MA50. On this long term chart, we can clearly see that the price hasn't crossed over the R1 level (79.75) since November 13 2023. As long as it keeps closing the 1W candle under it, we are bearish aiming at the 1W MA200 (TP = 73.50), which has been the ultimate Support in tha past few years, closing all 1W candles above it (see the circles). If on the other hand the 1W candle closes over the R1 level, expect a 83.50 test of the Symmetrical Resistance and 1W MA100, which is a Resistance level only crossed once since December 2022.
The 1W RSI trend looks like October 2022 (over the RSI's MA), which was a pattern that was followed by a strong decline. Consequently, we will sell one more time if the 1W candle closes under the 1W MA200 and target near the S1 Zone (TP = 65.00).
## If you like our free content follow our profile to get more daily ideas. ##
## Comments and likes are greatly appreciated. ##
WTI Oil H1 | Potential bullish bounce off overlap supportWTI oil (USOUSD) is falling towards an overlap support and could potentially bounce off this level to rise towards our take-profit target.
Entry: 78.046
Why we like it:
There is an overlap support that aligns close to the 50.0% Fibonacci retracement level
Stop Loss: 77.322
Why we like it:
There is a pullback support that sits under the 61.8% Fibonacci retracement level
Take Profit: 79.694
Why we like it:
There is a swing-high resistance level
Please be advised that the information presented on TradingView is provided to Vantage (‘Vantage Global Limited’, ‘we’) by a third-party provider (‘Everest Fortune Group’). Please be reminded that you are solely responsible for the trading decisions on your account. There is a very high degree of risk involved in trading. Any information and/or content is intended entirely for research, educational and informational purposes only and does not constitute investment or consultation advice or investment strategy. The information is not tailored to the investment needs of any specific person and therefore does not involve a consideration of any of the investment objectives, financial situation or needs of any viewer that may receive it. Kindly also note that past performance is not a reliable indicator of future results. Actual results may differ materially from those anticipated in forward-looking or past performance statements. We assume no liability as to the accuracy or completeness of any of the information and/or content provided herein and the Company cannot be held responsible for any omission, mistake nor for any loss or damage including without limitation to any loss of profit which may arise from reliance on any information supplied by Everest Fortune Group.

CRUDE OIL Pair : Crude Oil
Description :
Bullish Channel as an Corrective Pattern in Short Time Frame and Rejection from Daily Resistance
RSI - Divergence
Break of Structure
Symmetrical Triangle as an Correction in Short Time Frame with the Breakout of Upper Trend Line
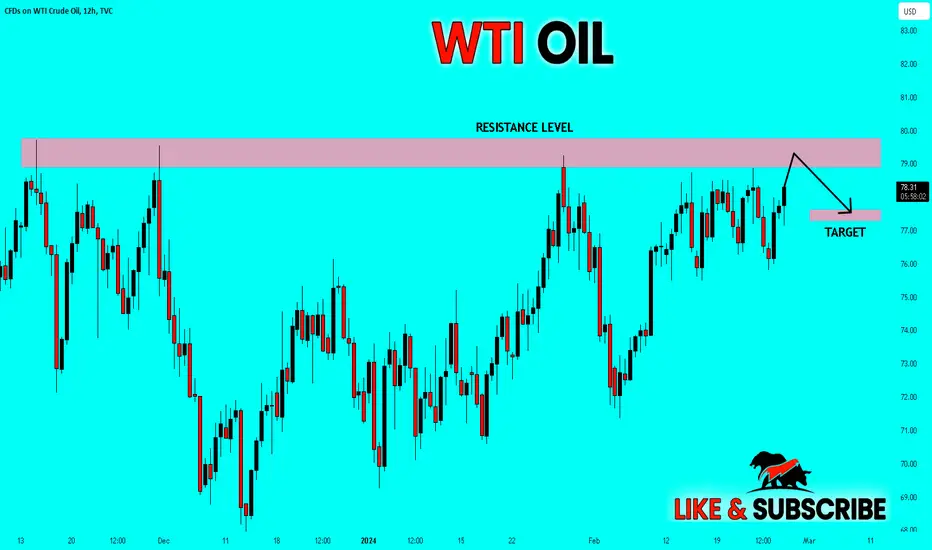
✅CRUDE OIL RESISTANCE AHEAD|SHORT🔥
✅CRUDE OIL is going up to retest a horizontal resistance of 79.63$
Which makes me locally bearish biased
And I think that we will see a pullback
And a move down from the level
Towards the target below at 77.50$
SHORT🔥
✅Like and subscribe to never miss a new idea!✅
Futures market backwardation suggests a sluggish outlookDefying our expectations, the West Texas Intermediate crude oil rose above $75 and began to form a rectangle pattern between $76.16 and $79.25 (following a breakdown of negotiations between Israel and Hamas). Currently, the USOIL is trading near the lower bound of this range, which also coincides with the 20-day SMA that acts as an alternative support level. On the daily timeframe, the MACD performed a bearish crossover, and RSI with Stochastic reversed to the downside. Simultaneously, the ADX continued lower, indicating a lack of any trend. Yet, despite that, the futures contracts continue to trade backward, which suggests the market’s sluggish outlook for the oil’s future price.
Illustration 1.01
Illustration 1.01 shows the USOIL’s daily chart and simple support/resistance levels.
Illustration 1.02
The MACD line and signal line performed a bearish crossover. However, they are still within the bullish area above the midpoint.
Technical analysis
Daily time frame = Neutral
Weekly time frame = Neutral
Please feel free to express your ideas and thoughts in the comment section.
DISCLAIMER: This analysis is not intended to encourage any buying or selling of any particular securities. Furthermore, it should not be a basis for taking any trade action by an individual investor or any other entity. Your own due diligence is highly advised before entering a trade.

A Renko Trading Strategy - Part 7Part 7: Some Examples of Analysis with Indicators
First, let’s look at some of the key indicators that are included in the charts. Regardless of the brick size (10,25, or 50), all charts will have the same configuration.
DEMA (12-period and 20-period) : These moving averages are designed to react more quickly to price changes than a traditional simple moving average (SMA). The 12-period DEMA is black, and the 20-period DEMA is red. We would look for the 12-period DEMA to cross above the 20-period as a potential bullish signal and below as a bearish signal. As you examine the charts going forward, pay close attention to these two when comparing them to the dynamics of the brick patterns.
SMA (20-period) with Blue Dots : This moving average is plotted with blue dots and provides a visual indication of the longer-term trend. It's smoother and slower to react to price changes compared to the DEMA.
WMA (9-period) on the 20-period SMA (Purple Line) : The WMA is used to confirm trends and reversals. When the WMA is above the SMA, it may indicate an uptrend, and vice versa for a downtrend.
In terms of support and resistance, Renko bricks make it easier to spot these levels as they smooth out minor price fluctuations. Support and resistance would be identified by areas where the price has repeatedly reversed direction.
When comparing the 12 and 20-period DEMA to the Renko bricks, look for areas where the DEMAs act as dynamic support or resistance to the price action indicated by the bricks. Similarly, the 20-period SMA and the 9-period WMA would be assessed for their interaction with the Renko bricks.
For breakout patterns, we would look for a consolidation of Renko bricks, indicated by a tight clustering of bricks without clear direction, followed by a breakout above or below this consolidation with a corresponding move in the moving averages.
Let’s identify any notable patterns or signals on the chart. We will look for:
Crossovers between the DEMAs
The relationship between the DEMAs and the Renko bricks
Potential support and resistance levels
Any consolidation patterns that might indicate breakout points
The Average Directional Index (ADX) is used to determine the strength of a trend. The value of 35 that is used is higher than the standard 20 or 25, which implies the reduced noise in Renko charts.
Here’s how you might interpret the ADX in conjunction with the DI lines:
Consolidation : If the ADX is dropping and has crossed below the 35 level, it may indicate that the trend strength is weakening, suggesting a period of consolidation or range-bound market.
ADX Below DI Lines : When the ADX drops below both the +DI (positive directional indicator) and -DI (negative directional indicator), it further suggests that neither buyers nor sellers are in control, reinforcing the consolidation signal.
Watching for a Trend Change : If after dropping, the ADX starts to turn upward while below the DI lines, it could be an early sign that a new trend is starting to form. The direction of the trend would be indicated by which DI line the ADX crosses. If it crosses the +DI, it may signal the start of an uptrend; if it crosses the -DI, a downtrend might be beginning.
To apply this to your Renko chart, you would look for periods where the ADX dips below 35 and pay attention to its direction relative to the DI lines. You'd also consider the brick color change on the Renko chart for confirmation of trend direction if the ADX starts to rise after the dip.
Keep in mind that technical indicators should not be used in isolation; they are more effective when used in conjunction with other analysis tools and techniques. Renko charts themselves filter out smaller price movements, so the ADX on a Renko chart might not react the same way as it would on a traditional candlestick chart.
Here's some ideas on how to analyze and correlate the given indicators to price action:
Renko Bricks : Renko charts focus on price changes that meet a minimum amount and filter out minor price movements, thus highlighting the trend over time. A 50-tick Renko chart will only print a new brick when the price moves by 50 ticks, thereby smoothing out minor fluctuations and making trends easier to spot. The 1-hour timeframe means that each brick represents an hour's worth of price movement.
Linear Regression Channel (1st and 2nd degree) : This tool is used to identify potential support and resistance levels and the overall trend direction. The 1st degree (linear) regression trendlines show the mean price movement, while the 2nd degree could show a parabolic trend which accounts for acceleration in price movement. The price often oscillates around the mean trendline, and deviations can be used to identify overbought or oversold conditions.
Double Exponential Moving Average (DEMA) 12 and 20 : The DEMA is a faster-moving average that reduces lag time compared to traditional moving averages. In your setup, the DEMA 12 would be more reactive to price changes, potentially serving as a short-term trend indicator, while the DEMA 20 could be used to confirm medium-term trends.
Simple Moving Average (SMA) 20 with 9 period Weighted Moving Average (WMA) : The SMA 20 is a common indicator for medium-term trend direction. When combined with the 9-period WMA, which gives more weight to recent prices, you could use crossovers between the two as potential buy/sell signals.
Stochastic Oscillators (5,3,3 and 50,3,3) : Stochastic oscillators compare the closing price of a commodity to its price range over a certain period. The 5,3,3 stochastic is a fast indicator that can signal short-term overbought or oversold conditions. The 50,3,3 stochastic, being much slower, could be used to assess the longer-term momentum of the market.
Average Directional Index (ADX) with the Directional Movement Index (DMI) : The ADX is used to measure the strength of a trend, whether up or down. The DMI includes both the Positive Directional Indicator (+DI) and Negative Directional Indicator (-DI), which help determine the trend direction. A rising ADX indicates a strong trend, while a falling ADX suggests a weakening trend.
When analyzing the chart, consider the following correlations and insights:
Renko and Regression Channel : Look for periods when the Renko bricks consistently stay on one side of the mean regression line. This could indicate a strong trend. If the price breaks through the regression channel, it might signal a potential reversal or a breakout.
DEMA, SMA, and WMA : Watch for crossovers between these moving averages. A crossover of the DEMA 12 above the SMA 20 and WMA might indicate a bullish short-term momentum, while a crossover below could signal bearish momentum.
Stochastic Oscillators : Look for divergence between the price and the stochastic oscillators. If the price makes new highs/lows but the stochastic does not confirm (known as a divergence), it could indicate a weakening trend.
ADX and DMI : If the ADX is rising and the +DI is above the -DI, the uptrend is strong; if the -DI is above the +DI, the downtrend is strong. If the ADX is falling, the trend is considered weak or the market may be ranging.
For trade setups, you might consider the following:
Long Entry : A new Renko brick in the direction of the trend, a bullish crossover in moving averages, the stochastic coming out of oversold territory, and a rising ADX with +DI above -DI.
Short Entry : A new Renko brick opposite the trend direction, a bearish crossover in moving averages, the stochastic coming out of overbought territory, and a rising ADX with -DI above +DI.
It's crucial to back test these indicators and their correlations with historical price data to validate their predictive power. Additionally, always manage risk appropriately, as indicators are not foolproof and should be used in conjunction with other forms of analysis and sound trading principles.
Part 8: Working Through Some Examples
to-follow
