Oil rally off news, to continue to $65! Crude oil prices skyrocketed from the news that there was an attack on an Iranian militant in Iraq which increased tensions and caused oil to pop. Oil was already on a tear to the upside and market structure suggested long side, this just gave price a little jolt of energy. Tensions may continue to rise but market structure is still saying upside. The break above the top of the channel ensured the upside. The bottom of the channel and support structure held really well on the intraday with a double bottom at $60.70-$60.80.
From the break of the previous high at $62.30 and the break of the channel we have now experienced a pullback into that area for a continued move higher. The $62.30 level held as support really well after hitting the $64.00 area. The next target is $64.00 yet again which is the 150% Fib extension area so target 1 was hit. The next target is the 200% Fib extension at $64.98.
Should price break below $62.30 there is a potential for a pullback into the support at $61.00 where the impulse from the drive higher started.
This idea is for educational purposes only, this does not constitute as investment or trading advice. TRADEPRO Academy is not responsible for any market activity.
Crudeoilforecast

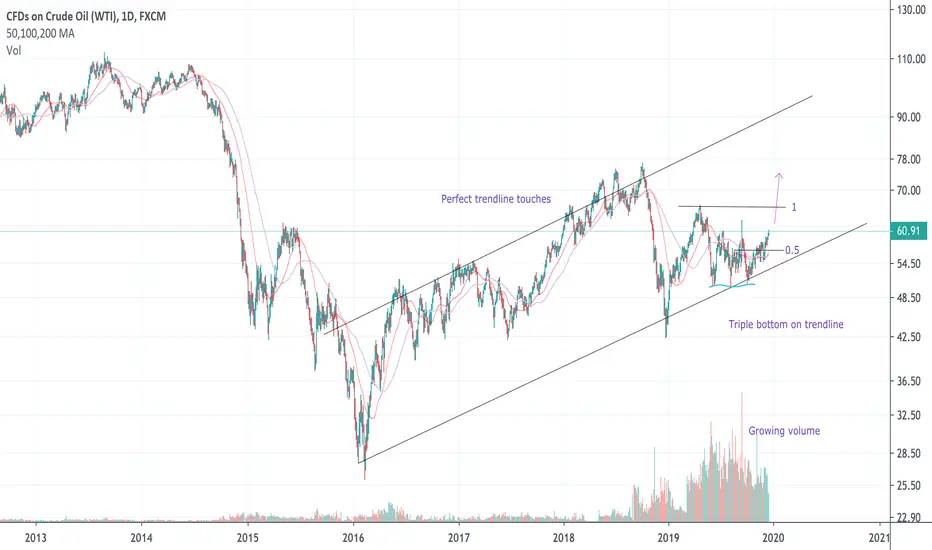
Bullish oilDeleted the last one because i realised the cypher wasn't accurate at all, overall oil looks bullish and continuation / reconfirmation of a long term uptrend is being established.
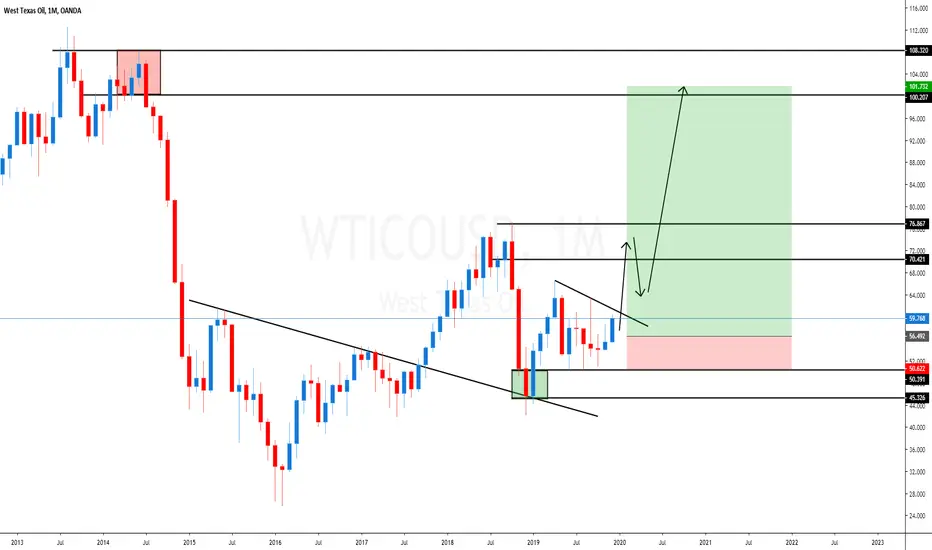
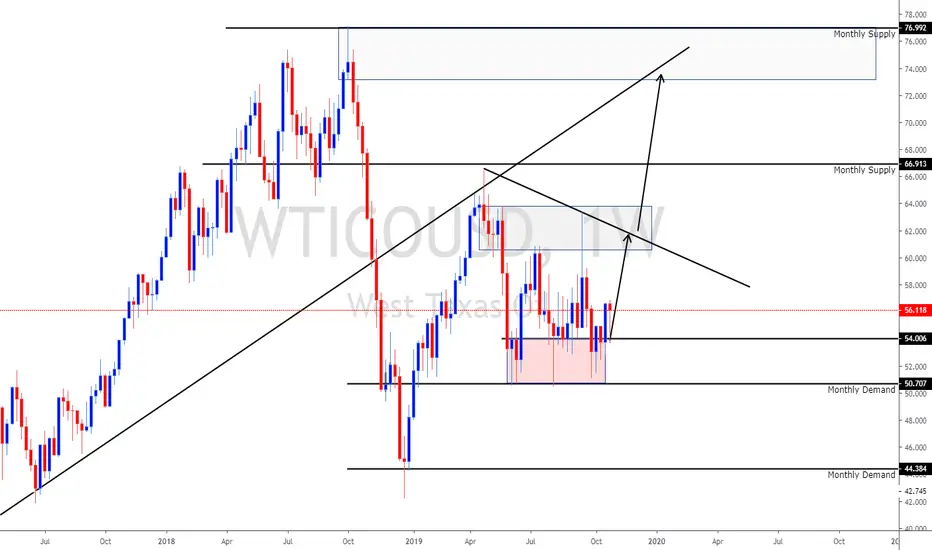
CRUDE OIL - Monthly chart - THE BIG LONG CrudeOil - I see monthly charts calling for a big upside on crude and this fits well with the timing of the Saudi Aramco IPO recently. $100 targets next year
WTI Crude Oil Preparing for OPEC MeetingThe West Texas Intermediate Crude Oil market initially tried to rally during the trading session on Monday, bouncing from the uptrend line and reaching towards and above the 50-day SMA initially. The crude oil market kick off the week with rally, as an Iraq oil minister suggested that not only would OPEC continue its production cuts, but it would possibly even consider cutting an additional 400,000 barrels a day. The rally ran into a brick wall though as President Trump announced new tariffs in Latin America and threatened new ones on Europe.
At the end of the day Brent crude and WTI gave up their gains to finish almost unchanged. Now WTI crude oil is showing convergence with its hourly 20 SMA and trading below its 50 SMA on the same chart.
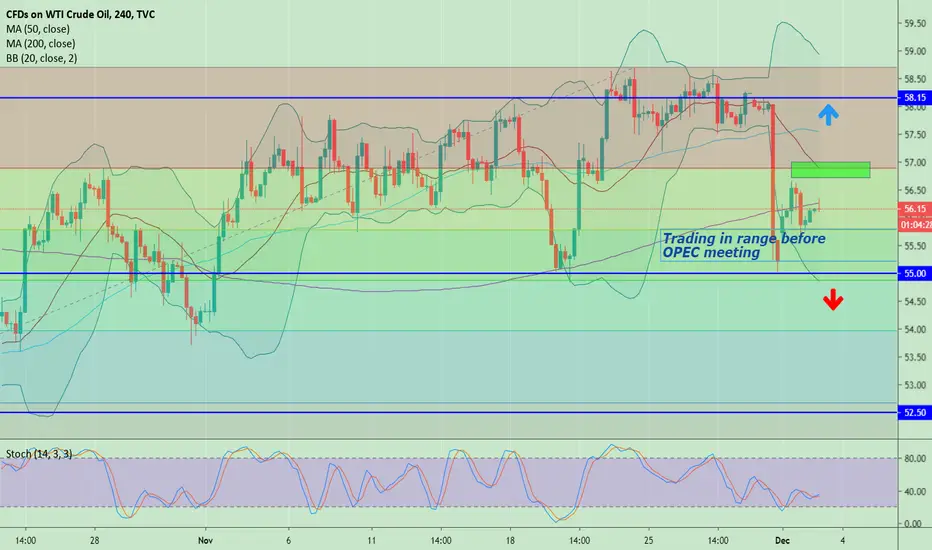
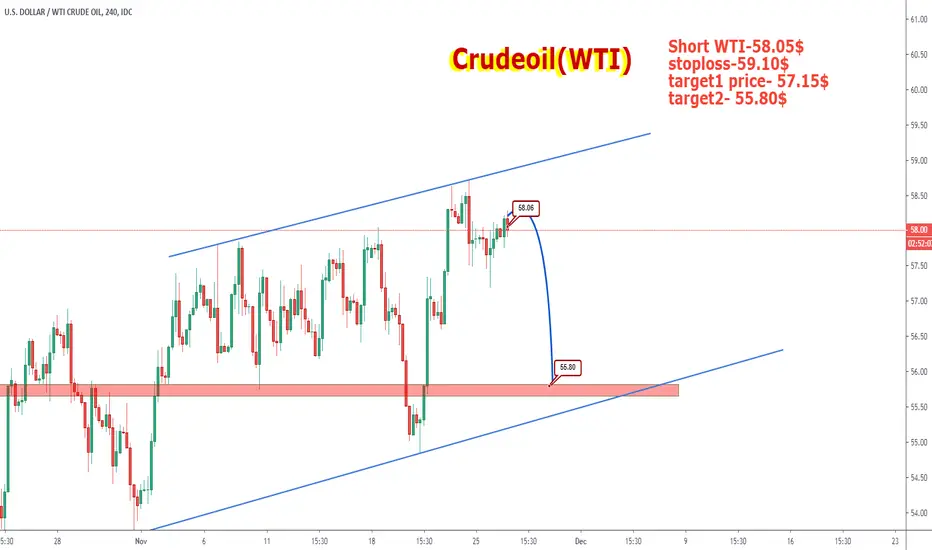
Near-term action is weighed by Friday’s massive bearish daily candle, with Friday’s close below 38.2% Fibo support at $55.78 (on last 2 months rise of $50.55 to $58.71) adding to negative near-term tone, which is expected to persist while recovery attempts remain capped by daily high ($58.15).
It is because of this that the $55 level underneath will offer plenty of support, but if it does in fact get broken, the market should goes down towards the $52.50 level (78.6% Fibo).
On the upside, the daily 200 SMA line remain relevant and are additional barriers against upward movement. The first resistance is at 56.50. Next is resistance from the 200-EMA at 57.51.
Overall, we believe that the market is going to continue the overall uptrend and channel for the rest of the week, but it will more than likely be very choppy, and news driven.
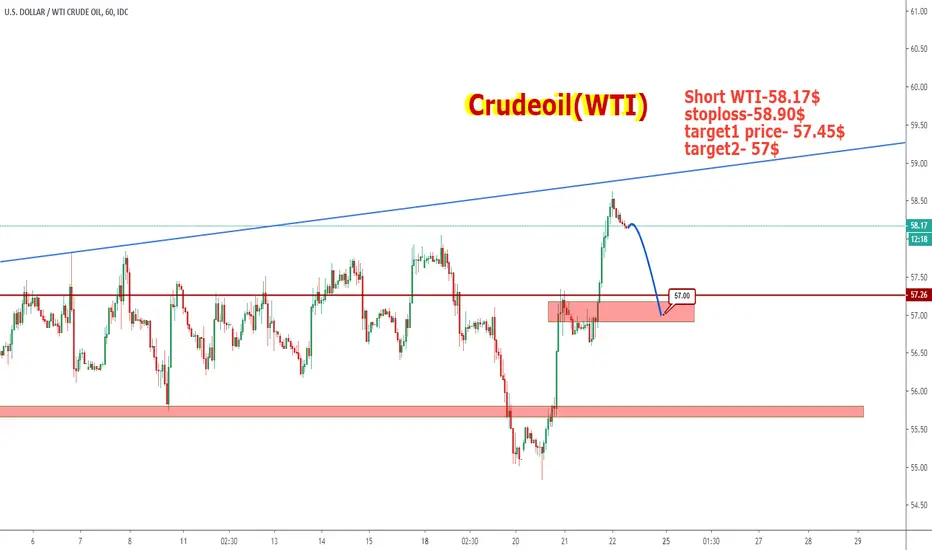
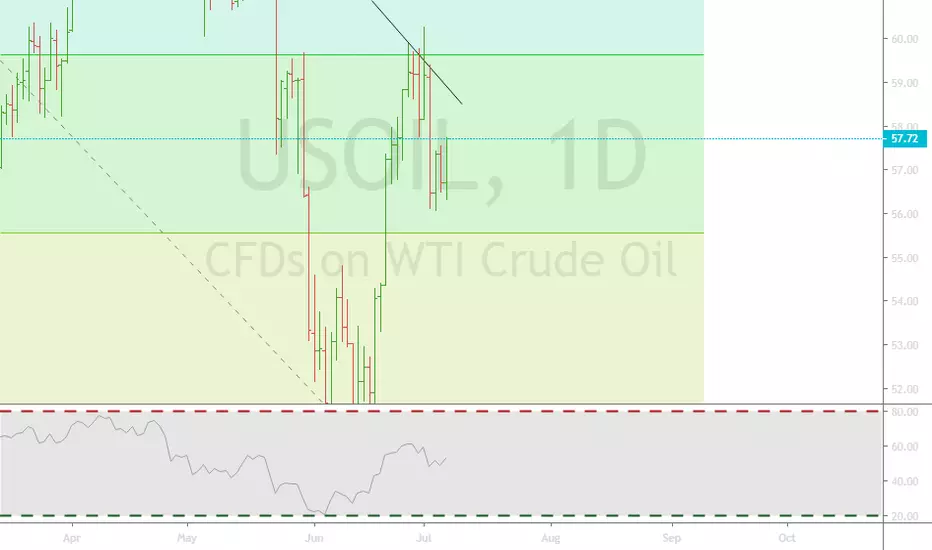
US CRUDE OIL - H4 - Buy setupCrude oil - H4 chart showing buyers in control with price continue to make higher highs and higher lows while leaving behind fresh demand zones.. Buy limit set at 57 with stops below 56.20 and take profits 60-61... Enjoy
US OIL - Weekly chart - Bigger timeframes calling for big upsideCrude Oil - Weekly chart - I see crude trading in a bullish structure respecting weekly and monthly demand zones and looks like it can pull back upto 70s to test a fresh weekly supply zone. Lets see how this plays out!
Oil prices have spiked more than 10%|Next rally can hit $75.24On 13 Sep 19, Market closed on $54.87 but Oil prices have spiked after a destructive attack on the Saudi Arabian oil production on weekend shocked markets and produced shortage in global supply of crude for some time.
Now we can see the price spiked more than 10% in a day after market opens and hits the 50SMA even the 100SMA on week chart.
At this point we also have the price resistance level and the pennant's resistance at $60.63 which is not broken since May 2019, if this resistance level would be broken then the price action will take no time to reach the 2nd resistance at $75.24 where we also have tail of the pennant and in case of breaking out $75.24 resistance level the price action can hit the strong resistance at $107.45.
If we see the technical indicators then can be clearly observed that the all of a sudden the chop zone is turned strong bullish and even MACD has given strong bullish signals including bull cross.
For me after breakout the 1st resistance and if all indicators would be remained bullish even after price correction would be ideal for buying.
Market fundamentals + technical analysis are very strong in favor of bullish move.
Next target should be : $75.24.
Regards,
Atif Akbar (moon333)

Crude Oil Forecast: China to tax U.S OilWe have reached our near term target level 53.20.
Lack of Global Oil demand
Slowing down global economies
And now China's Plan to tax US Oil starting September 1.
As I mentioned in my previous Oil report, China- Iran Oil Trade Plan could be validated soon.
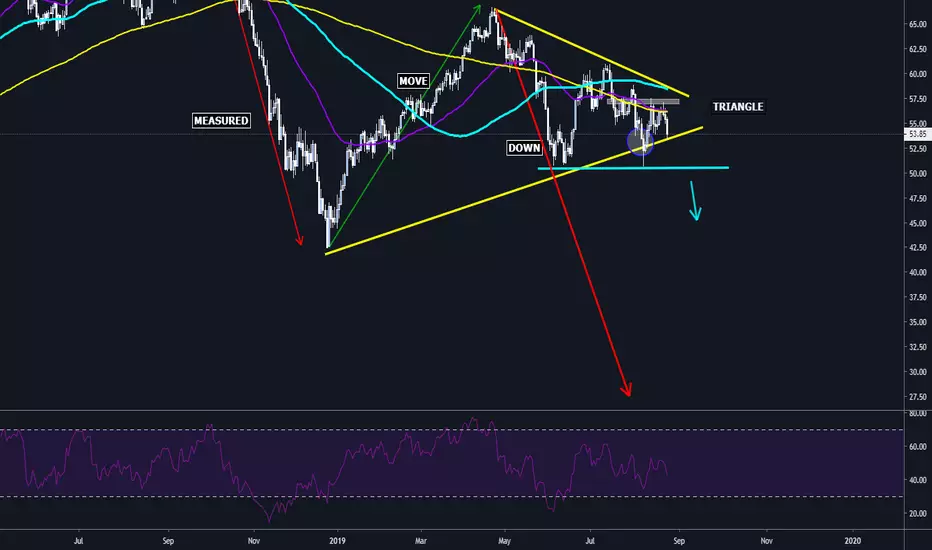
After the false breakout of the triangle, we see WTI retesting the triangle. WTI needs to make Daily Closing below 53.13 to continue its bearish move.
Under the current fundamental conditions, I expect the decline in oil prices to continue. As shown in the chart, Daily Closing below $ 50 will accelerate the downward trend in prices. Below 50$, Oil Prices may find medium-term support at 46.80.
now i am buyer like banks now i get confirmation that crude oil gonna go higher
check out bank levels and join us
enjoy profit

Crude Looks Short Near 58.80 with SL 59Watch The Fib Level and Trendline and then Trade If Crosses Then Close Trade Wait For Higher Levels To Get Active Most Probably Crude Might Not Cross 59.64
CRUDE OIL H1 Chart OverviewMarket is closed.
Let's have fun:-)
Supply Cut Extension
ARAMCO IPO
Iran Sanctions
Slowing Global Economy and Global Growth Concerns
Decreasing Global Oil Demand
Follow the lines and arrows
Crude Oil Forecast: How deep Oil Prices may fall?The shortened version of our Crude Oil Forecast:
We have started to sell Crude Oil at 65 $ and reached our target at 52.80 $.
What is next?
What were the reasons for the sell-off? What is driving the market?
1. The supply and demand balance strongly indicates that oversupply will last for some time to come.
2. Global Growth concerns. I have mentioned several times that WTO and IMF reduced their global growth projections. Parallel to this, both IEA, WTO and OPEC lowered their global oil demand estimates.
3. Trade Wars.
4. OPEC+ supply cut, Venezuela and Iran Sanctions did not help Crude Oil prices to enter into a bullish market. ( Closing above 68 $ ). Note the sanction waivers. Now Crude Oil prices have reached a critical level. We have to scenarios ahead. OPEC is to maintain cuts or face a world of much lower crude prices ( Then comes a war between OPEC and US Drilling Companies with 42 $ production cost).OPEC postponed their meeting for the supply decision. OPEC may wait for “right on time” action. ( 40 $ – 45 $ per barrel )
5.Brent/ WTI spread may widen intermediate term.
As I have been writing for three months, Crude oil is fundamentally and technically bearish. Supply is surpassing demand and stocks are rising at a time when they should be falling.
Please pay attention to The US Commodity Index. The double top pattern’s completed and the pattern suggests further fall.
Daily Chart:
Potential Golden Cut of MAs indicates a bearish move intermediate term.
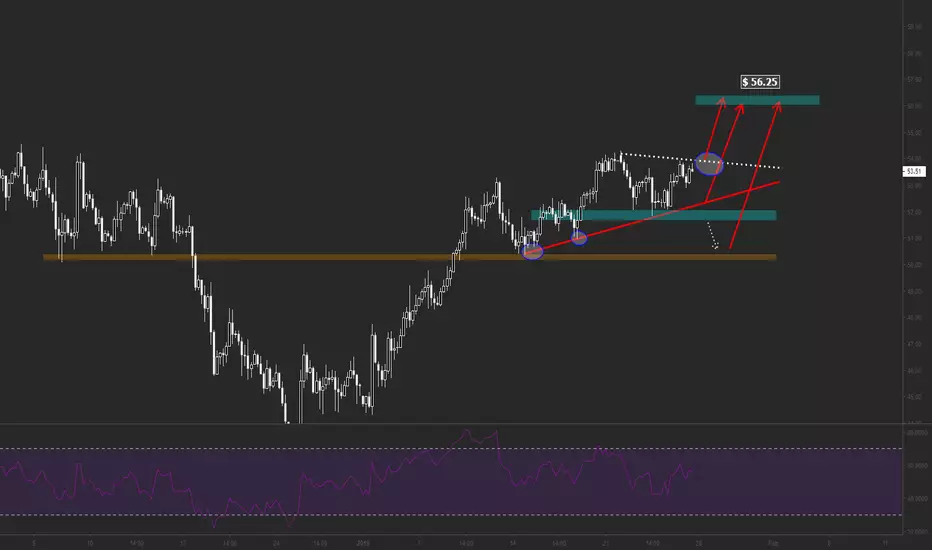
A Bullish Bat Pattern and oversold RSI indicate a technical correction towards 57 $ near term. Potential pullbacks can be used as a selling opportunity.
On the downside 51.50 ( Fibonacci 61.8% of the latest bullish move ) and 50.00 $ (psychological level) will be our main focus.
On the upside, 56.25, 58.10 are the potential pullback levels to be used for selling opportunity.
Intraday trade opportunity will be published later for the members.

Short Usoil (Crudeoil wti)So, I posted a chart this morning and oil has moved further up which is within calculations and if this chart also fails, then I will post my new opinion on Monday. For now, happy trading. My sl is at 64.51 for leg B to C
DISCLAIMER
Please note that this chart is an opinion based chart only. Please trade at your own risk
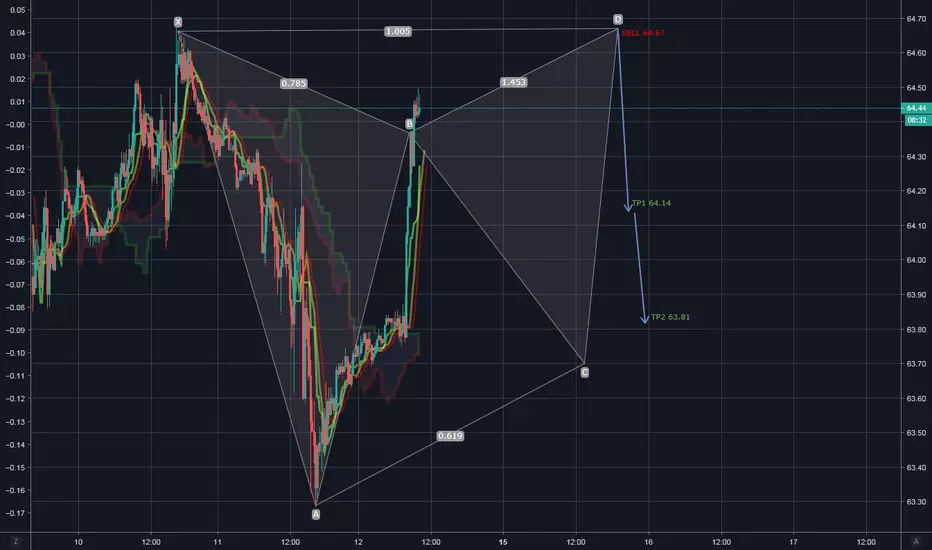
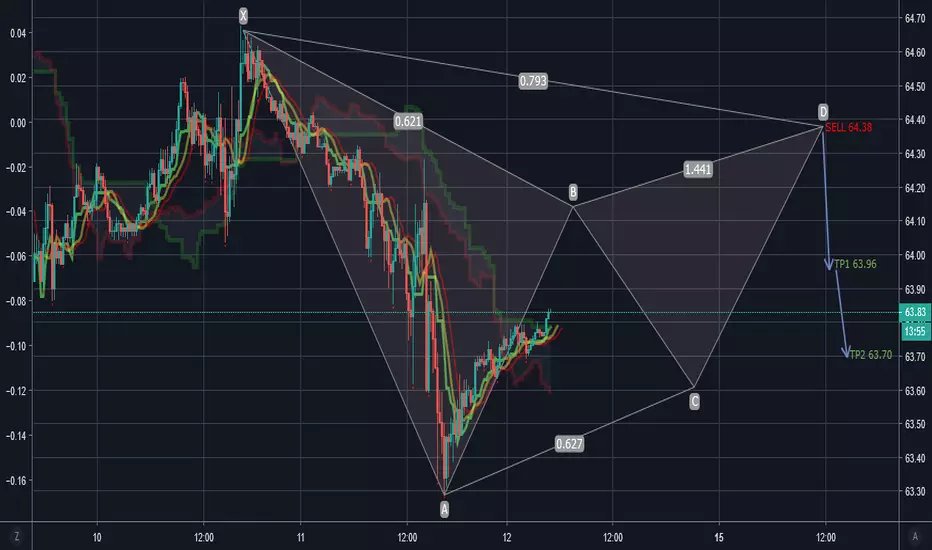
Crudeoil Short IntradayAfter hitting the lows yesterday, my opinion is that crude oil will once again hit 64 at point B before going down to C before a last leg up into 64 at point D and then back down again. You may take C and D trades, which is an opportunity for buy & short if B plays out. Please not that targets aren't always going to be on point, it may go slight higher or slightly lower and this is an opinion of what i think the market might do. TPs may very well extend much more lower than my targets but those are my targets.
DISCLAIMER
Please note that this chart is an opinion based chart only. Please trade at your own risk
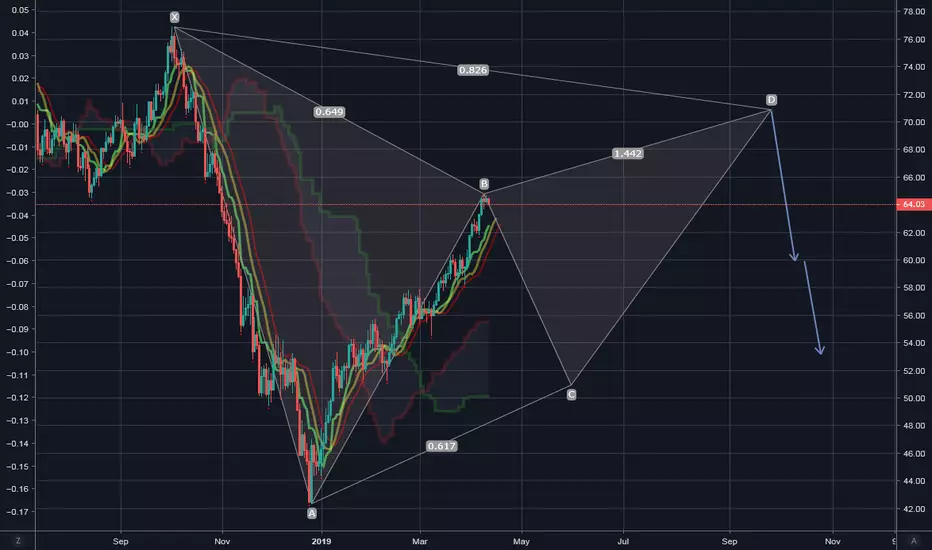
Crudeoil ShortThis is one of my take on oil on the daily, I might upload my 2nd opinion. I will post an intraday opinion soon.
If you followed this chart that I posted yesterday, then both your target would have been met by now. Could go down further but for now, I'm out.
DISCLAIMER
Please note that this chart is an opinion based chart only. Please trade at your own risk
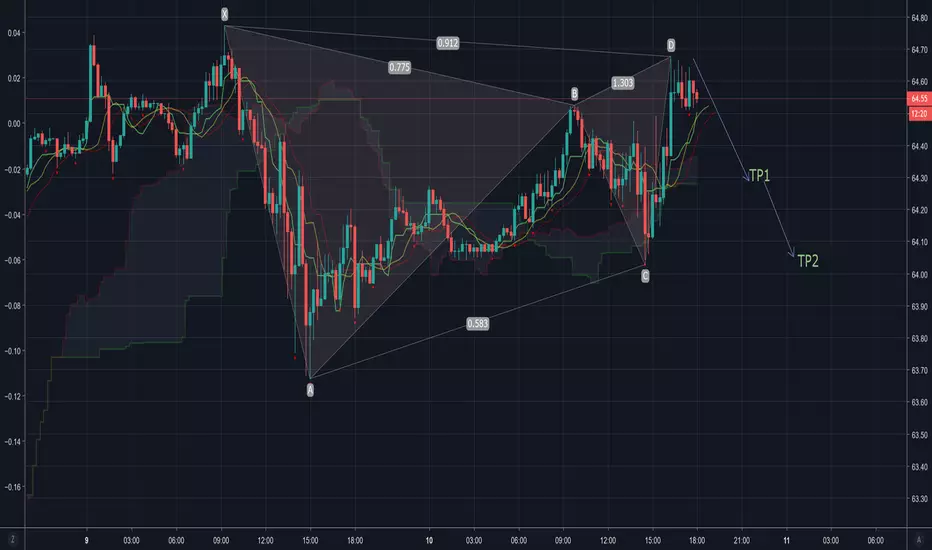
Short CrudeOilThis is a slight tweak to my short call chart yesterday in the 1 hour view. This is my opinion on oil. There is still a potential for more upside before we go down as stated yesterday, up to you if you want to wait for more upside before shorting.
DISCLAIMER
Please note that this chart is an opinion based chart only. Please trade at your own risk

Crude oil ShortMy pattern earlier became invalidated once we broke 64.65. This has the potential to revisit today's low again.
DISCLAIMER
Please note that this chart is an opinion based chart only. Please trade at your own risk
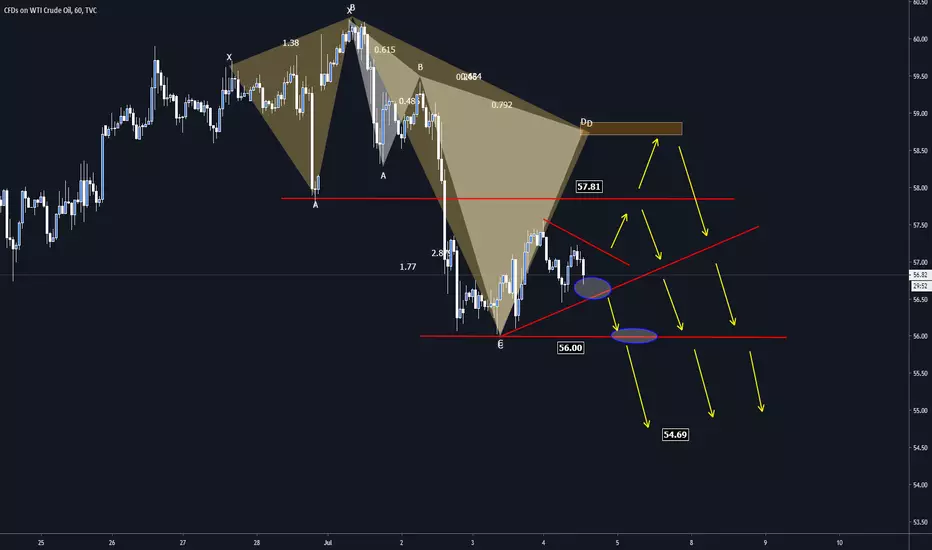
Short & Buy Crudeoil IntradayFrom here, I believe we will be going down to 63.37 where buyers may want to come in again.
Disclaimer
This chart is an opinion based chart only. Please trade at your own risk.

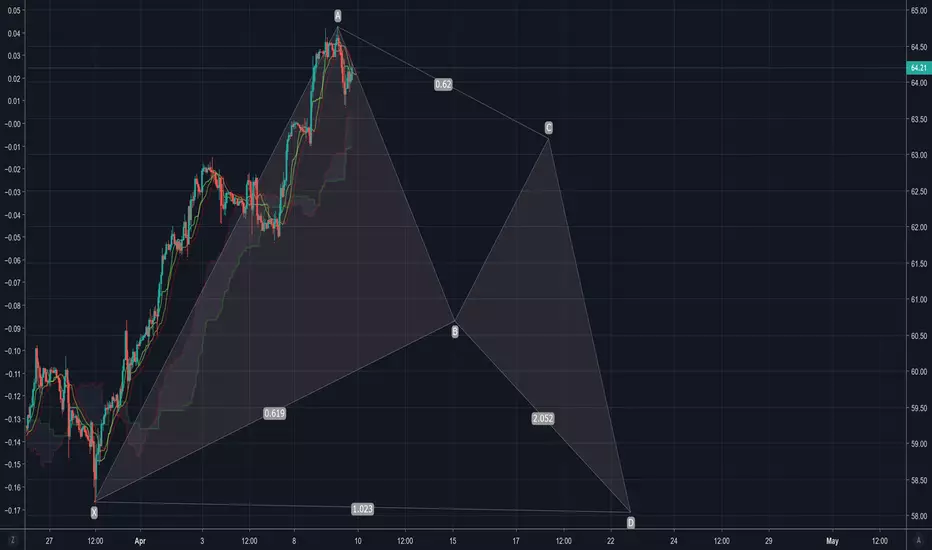
Short oil Oil has now reached the 0.618 fibonacci line although it has gone past it slightly, which is ok. In my opinion, it hasn't reached a resistance line yet which means this has the potential for more further upside around 67-68 but of course it could just go down from here.
Oil can go straight down from here to 60.70 before going back up to 63.22 and then another down to 58.04. This is of course just my humble opinion which could be wrong, so please trade safely at your own risk.
Disclaimer
This chart is published as an opinion based chart only.
Crude Oil Weekly Report: How long will Oil rally last?U.S. WTI and Brent crude oil futures closed the week higher on Friday.
Which fundamentals drove Crude Oil prices higher this week?
Deeper-than-expected OPEC-led production cuts : Saudi Arabia is delivering on the cuts it pledged, and I have no doubt they’ll deliver on pledges to do more. As I mentioned in my previous articles the reason of the big drop on Oil Prices was a production boost from OPEC and an equity sell-off that pushed oil down during the fourth quarter, and now as both of those elements are in reverse prices are going up.
Trade Deal Optimism : Press reports suggest that the U.S. and China are making progress on trade negotiations, and President Trump has indicated he would be willing to let the talks continue past the March 1 deadline if progress was significant. Trump is expected to meet with China’s vice premier and top trade negotiator on Friday. There are still thorny issues that will be difficult to solve, but markets are welcoming the potential breakthrough in trade talks.
Meanwhile, the EIA report showed that Crude Oil Inventories stocks rose three weeks in a row.
Simply saying, The U.S production is likely to limit the gains for WTI in the near future.
WTI vs BRENT
The spread between Brent crude oil and WTI crude oil has risen from a low of $6.80 on January 31 to a high of nearly $10.00 ( Brent Crude Oil ended the week at 66.90). This is the result of a combination of the OPEC-led production cuts and the sanctions against Venezuelan exports, which are supportive for Brent crude oil, and the rising U.S. production, which is helping to limit gains for WTI crude oil.
Baltic Dry Index:
You can see view the BDI Chart on our website.
BDI rose a bit in February but it is still not promising for Global Economic Activity. Simply saying: Less economic activity, less Oil demand.
IEA is not so bullish:
According to the International Energy Agency, the global oil market will struggle this year to absorb fast-growing crude supply from outside the Organization of the Petroleum Exporting Countries (OPEC), even with the group’s production cuts and U.S. sanctions on Venezuela and Iran.
Furthermore, the IEA said it expected global oil demand this year to grow by 1.4 million bpd, while non-OPEC supply will grow by 1.8 million bpd. This doesn’t bode well for the long-term crude oil bulls.
Crude Oil Weekly Chart:
Fundamentally, there is no reason for Crude Oil prices to be traded above $ 62.50 for the time being. Its retracement zone at $59.38 to $62.50 is the primary upside target. Since the main trend is down, sellers are likely to show up on a test of this zone
On the other side, the potential downside move would be limited as well. OPEC + would not let the Oil Prices stay below $ 50.
Simply saying, potential pullbacks towards $ 50 can be used as a buying opportunity.
Near Term Trade Opportunity:
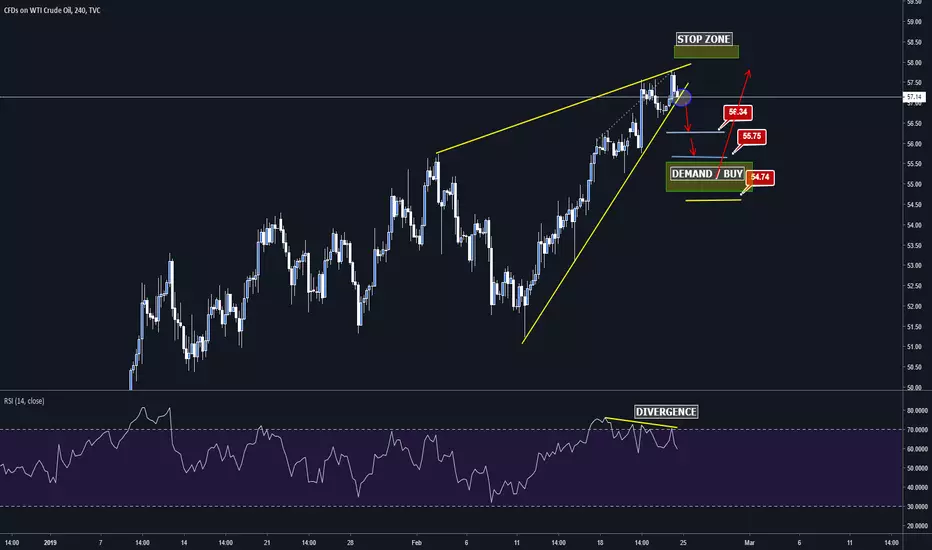
RSI Divergence H4 Chart
We will look for a short opportunity if the price breaks out the trendline. The first target of the Bears will be 56.25. The breakout of 56.25 would lead the prices 55.75 and 54.70. Those levels can be used as buying opportunities.
CRUDE Oil Forecast: Bulls control the marketPullbacks are buying opportunities
Fundamentals:
Bullish:
OPEC + solid cuts – Latest Announcement from Russia: “We won’t fight with US oil producers”. That means: They will not let the prices go down to stop US drilling activities.
Venezuela Turmoil
Optimism in US-China Trade Talks.
Now we have a new bullish factor: Weakening USD. Simply saying: Historically, weak dollar sends the oil prices higher. Below is the DXY vs WTI correlation chart.
Bearish:
Global Growth Concerns
8M Barrels increase in stocks
Have a nice trading week!