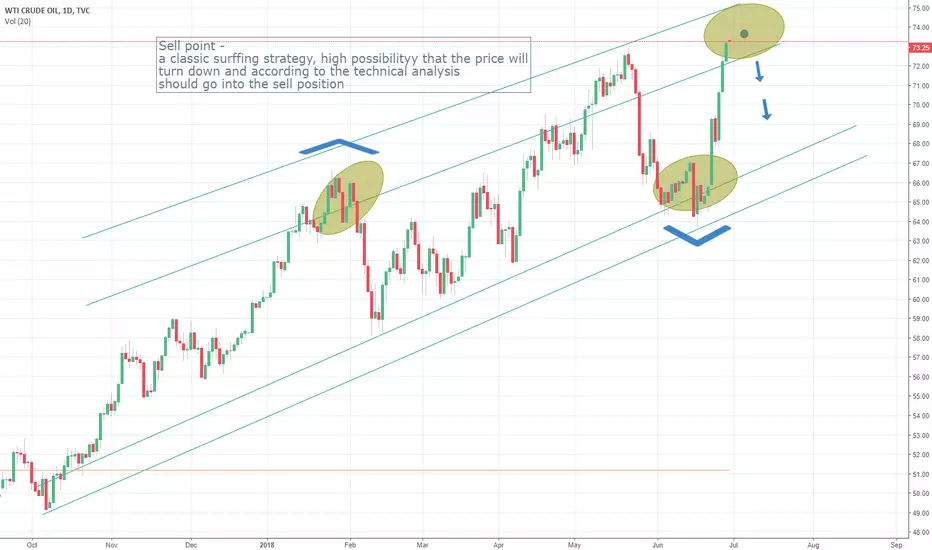
Crude oila classic surffing strategy, high possibility that the price will turn down and according to the technical analysis should go into the sell position
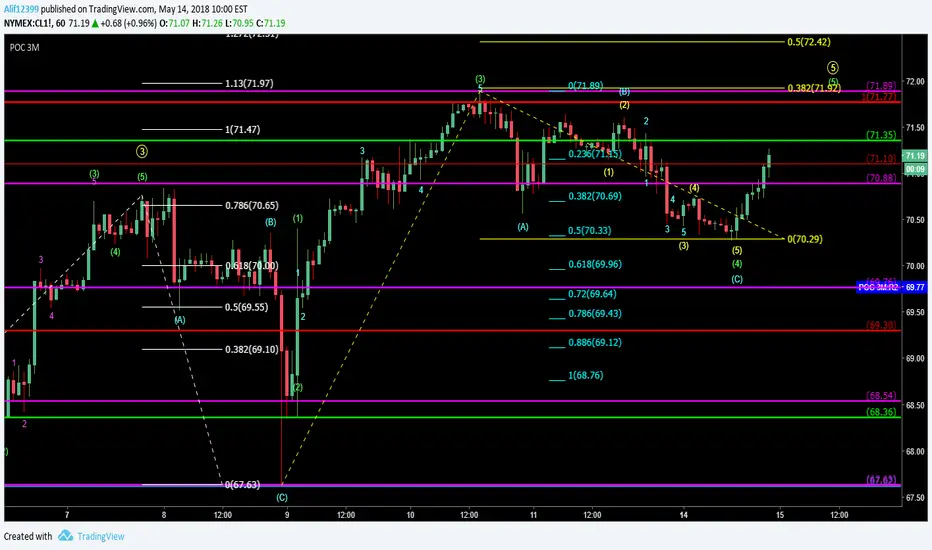
Crudeoilwti
CrudeOil Bullish Structure ConfirmationHere we go again! Crude oil's super mega uptrend looks to continue! Last time we saw a trend like this was 2009, and it's a long time coming after the major declines in 2014.
Quick summary why I'm bullish in the next weeks:
1. Overall bullish trend
2. Consolidate and form a higher low
3. Failed breakout lower, breakout higher
My next target is 75.50, and if we really move then 80 and 90 are still possible. The announcement of OPEC's higher production limits this Friday potentially puts a limit on the overall trend. Higher production with relatively constant demand (I mean we didn't just start needing 600k/day barrels more oil overnight) should weaken price. Will need to see this in the charts before I give it much weight.
So what do you think? Am I crazy to be so bullish? We've already moved so far...will it keep going? Share with me your charts, ideas, and comments! Love to hear other traders opinions!
Peace, love, and sweet bamboo,
tbp
Note: All ideas expressed here are presented solely for learning and educational purposes only. Any gains or losses assumed by trading ideas presented by The Bad Panda are done so at your own risk.

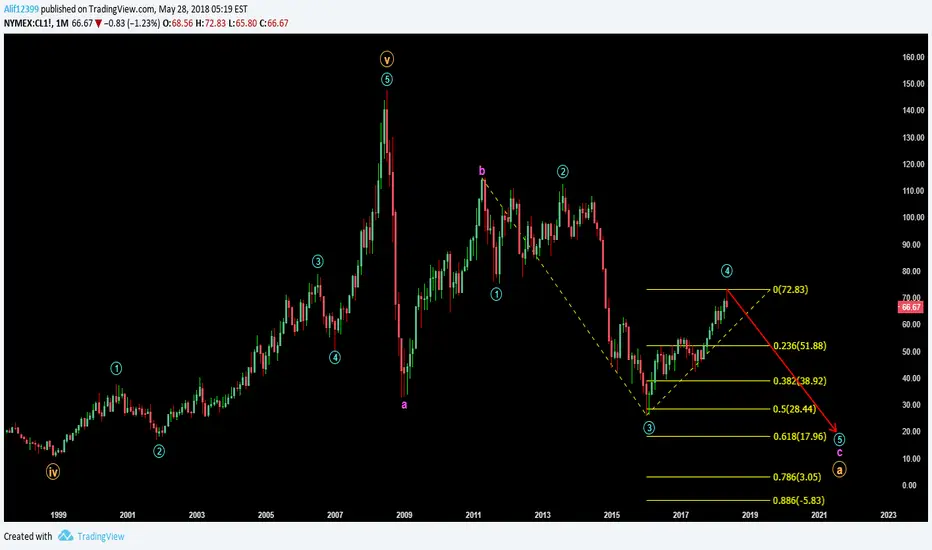
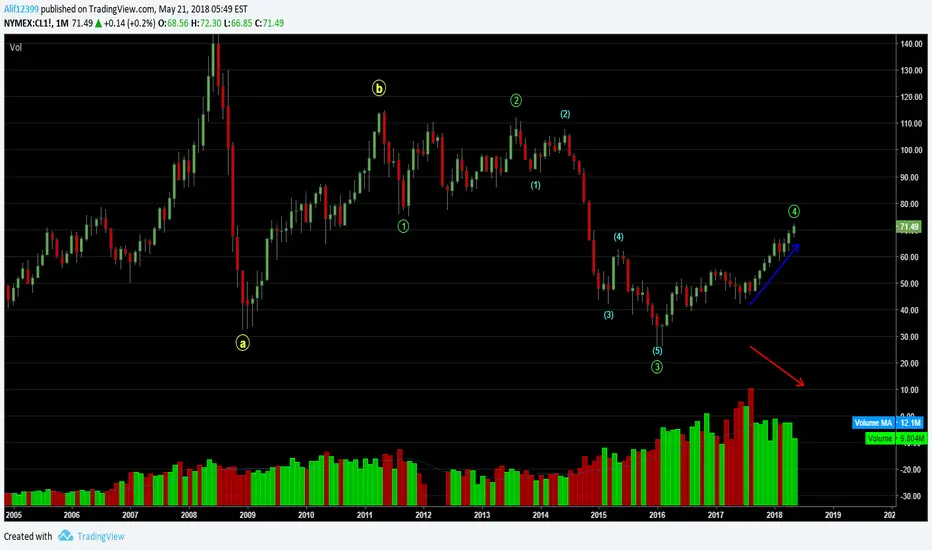
Monthly Wave Count for Crude Oil (extended count)Some countries (i.e Malaysia) are making a smart move by pegging the retail oil price when crude oil was at around peak of wave 4 of C. That will bring extra revenue for the country at times of turbulence (but at the expense of the people).
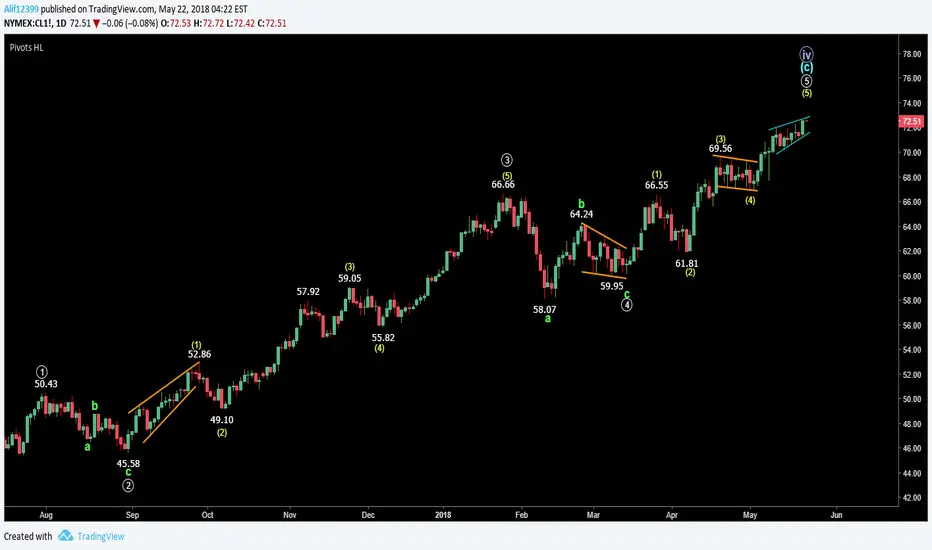
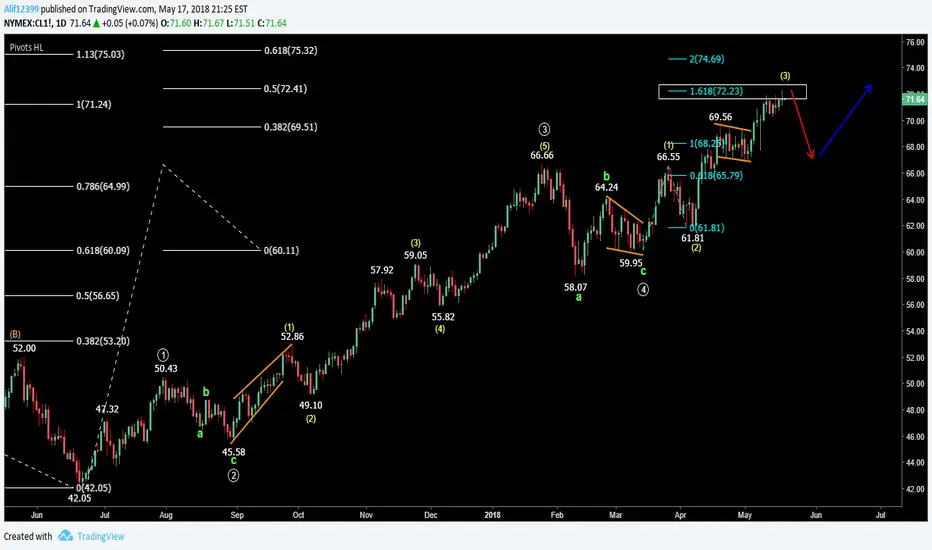
Daily Wave Count for Crude OilThe red arrow is the next target, I believe. The long term target, I have posted it at the "Monthly Wave Count for Crude Oil" analysis below.
These are just probabilities. It might go higher/lower than I've forecasted.
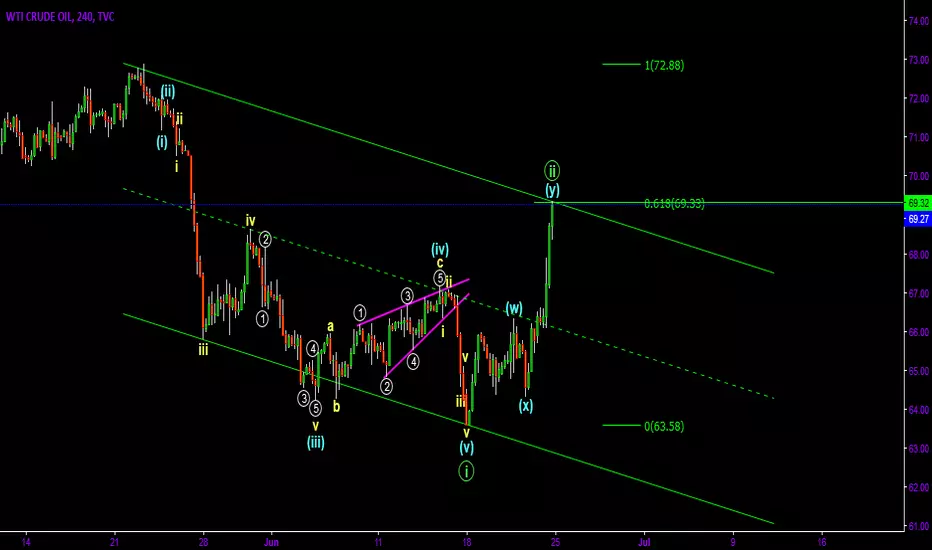
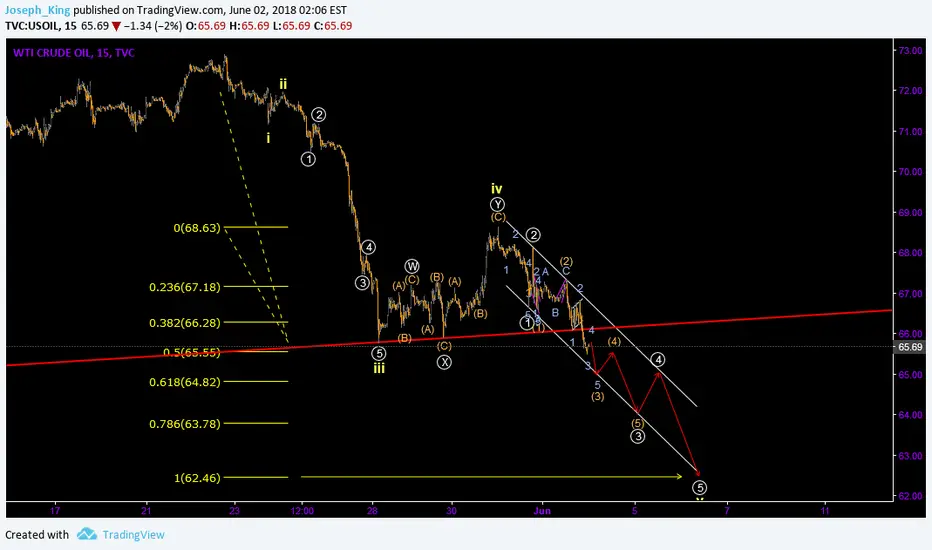
Crude Oil Elliott Wave IdeaNot enough coffee before posting this morning...I think my last chart is incorrect as Y wave must be an ABC, not 5 wave structure, so this is the alternative and a look at smaller timeframe below:
1H > B wave correcting .236 of A wave.
5M > Wave 4 of A correcting 0.5, fib levels seem to make sense
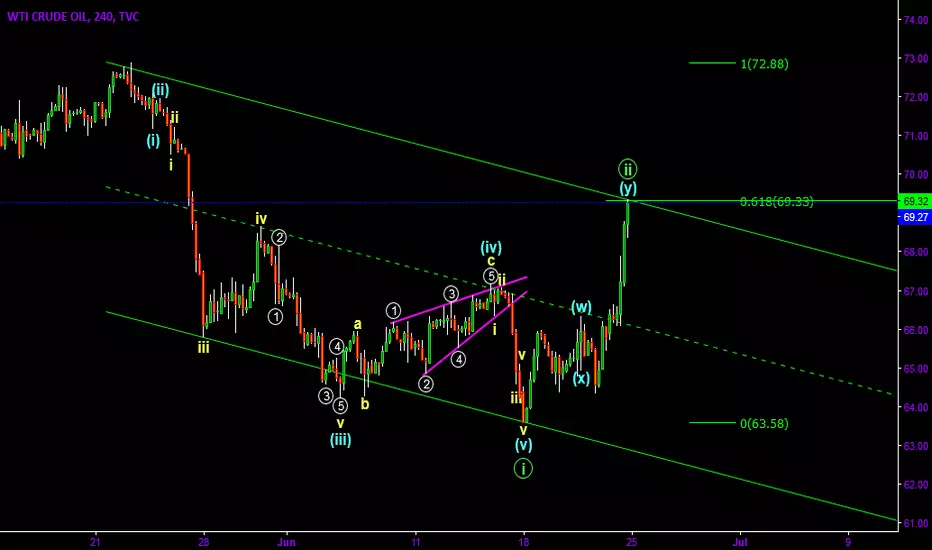
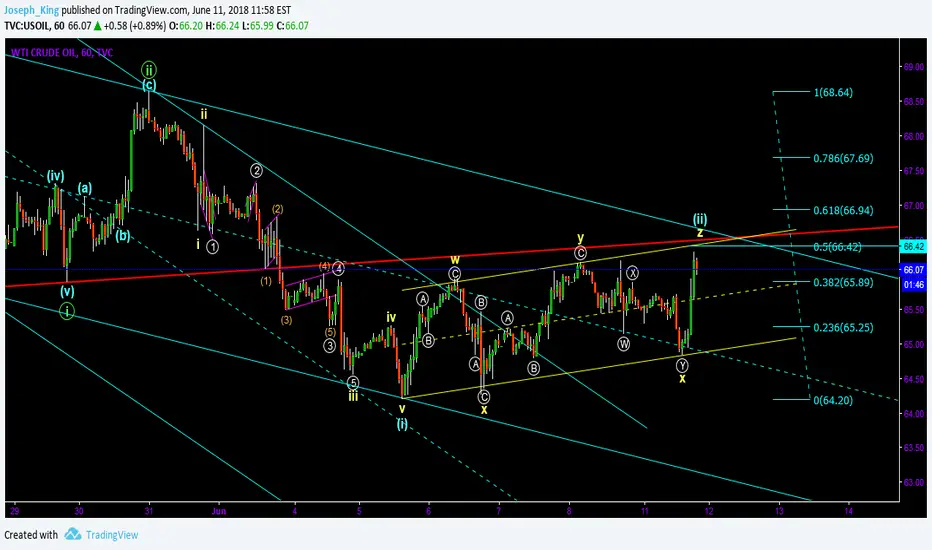
Crude Oil Elliott Wave IdeaAn update to this idea >
Wave 5 is obviously completed now but at 6360 not at the 6250 area. Possibly in wave 2 now which may be near completion (although seems crazy to think that considering Friday's rally).
A look at smaller timeframe:
5M >
1H >
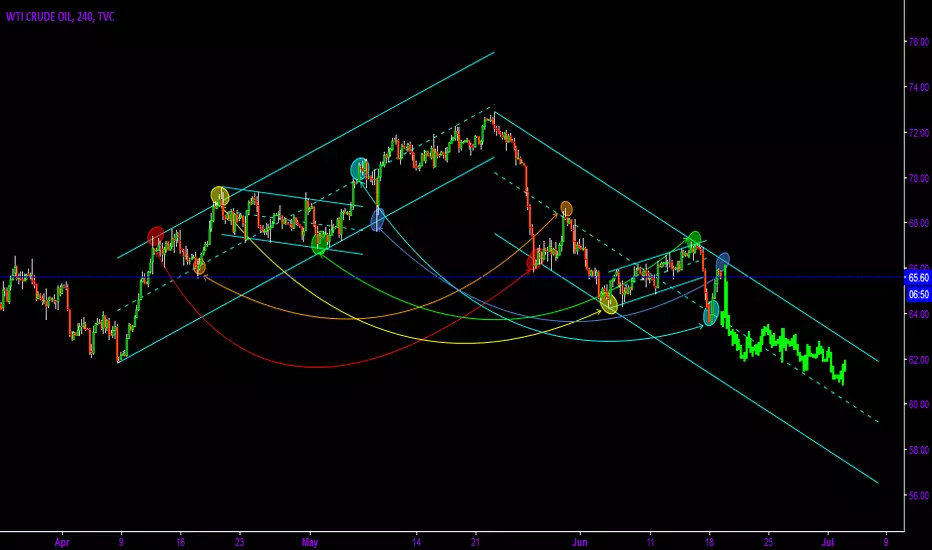
Crude OilJust an observation, some similarities between the move up from 61 to 72 and the move down from 72 so far, mirrored
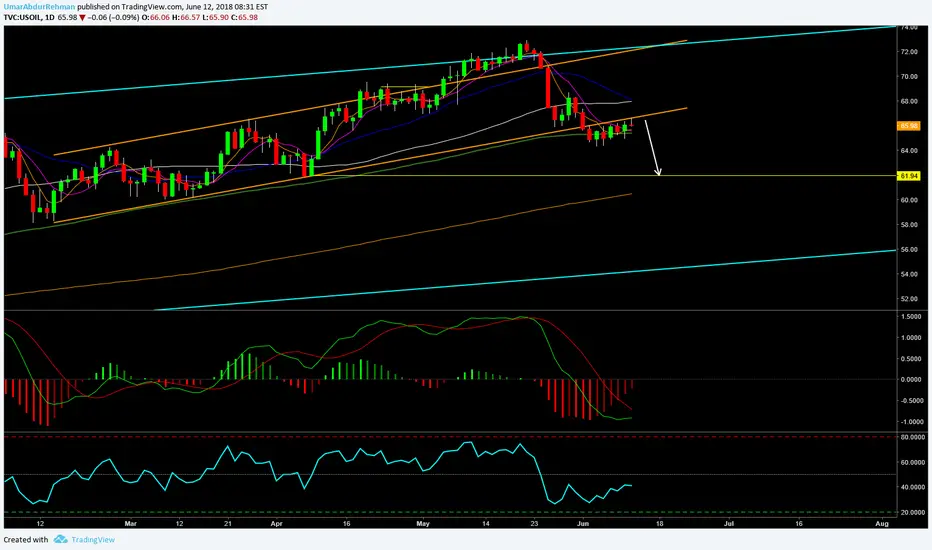
Crude Oil downside to continueCrude Oil have been strong from last year with succession of new tops and lows-whilst it just broke the multi-days bullish channel and undergoing a linear compression setup. Price action and momentum indicators are suggesting the downside to continue towards the prior support area around 61.94. I am looking to short this market around 67.27-66.20 with stop around 68.69, for a target to 61.94 over the coming days.
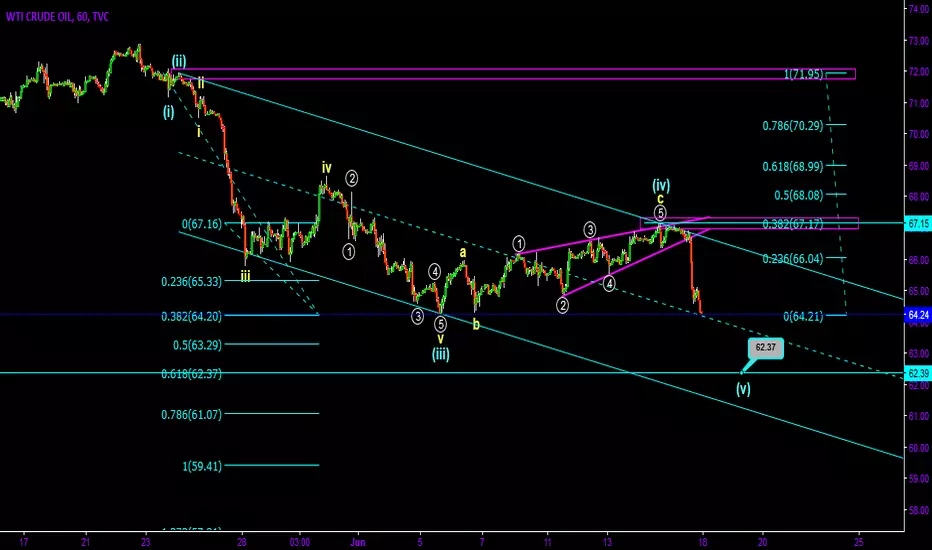
Crude Oil Elliott Wave IdeaUpdate to this previous idea >
I believe wave 4 completed at exactly 0.382 of wave 3 (blue waves) with an ending diagonal for wave C and now in wave 5 to 62 area
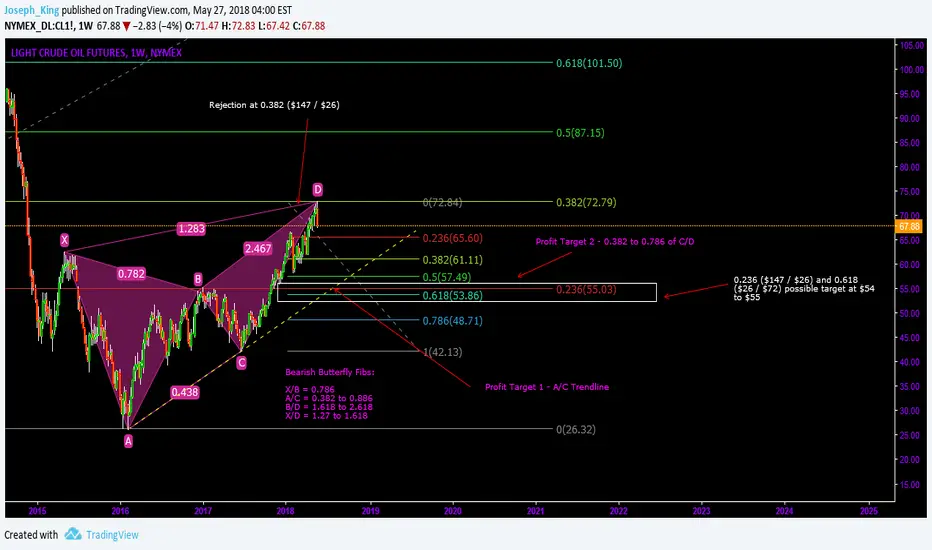
Crude Oil Bearish ButterflyIt appears that a bearish butterfly hasn't completed with perfect Fibonacci rations at 7290 as well as .382 of $147/$26.
Crude oil may now correct, either to 0.382 of the C/D line or deeper, possibly back to .236 of $147/$26 and 0.618 of $42/$73.
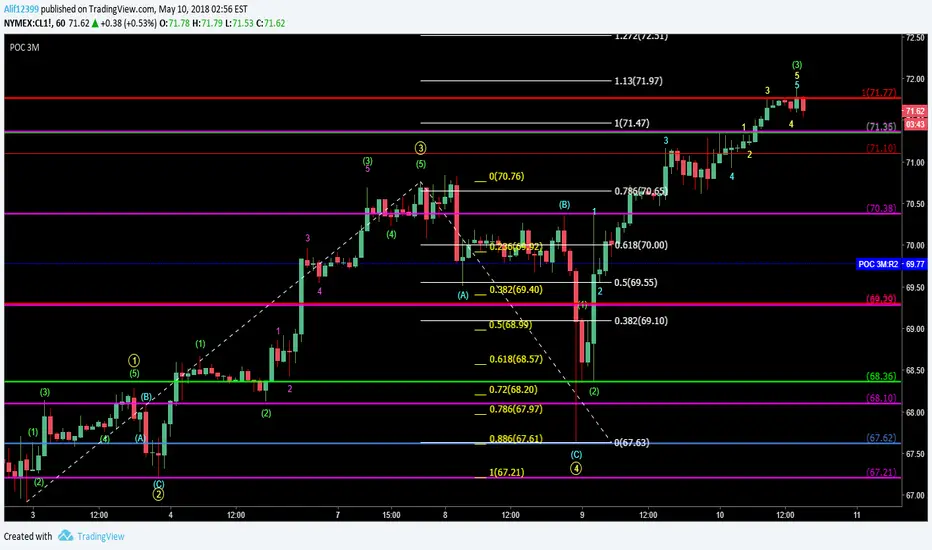
Short the Impulsive Wave!The current price movement could be the BIG B (with subwaves abc in it) of wave 4 or it could be the start of wave 5. Nevertheless, it's impulsive (5 legs). The plot are just for the nearby targets. The targets in the white boxes could be lower/higher. Those are just high probabilities.
Wave 5 About To End (Alternative Wave Count)Thanks to @manish_damani for his comment on my previous post entitled "Monthly Wave Count For Crude Oil"
This chart is an alternative wave count for my previous chart:
There is a solid ground that we are around the top of wave 5 of wave C, instead of wave 3. The reason is...there is an ending diagonal (refer to the turquoise converging lines at the right side of the chart). As stated in the notes from Elliott Wave International,
" An ending diagonal is a special type of wave that occurs primarily in the fifth wave position at times when the preceding move has gone "too far too fast," as Elliott put it. A very small percentage of ending diagonals appear in the C wave position of A-B-C formations. In double or triple threes (to be covered in Lesson 5), they appear only as the final "C" wave. In all cases, they are found at the termination points of larger patterns, indicating exhaustion of the larger movement. "
In an ending diagonal, wave 5 often makes a throw-over. In other words, throw-over happens because the market makers (the big boys) want to get more contracts to sell. So they push the price synthetically above the majority expectations to hit the stop loss of other traders. Therefore, in my opinion, it's quite hard to predict where the top will be.
Nevertheless, often there are throw-overs, but at times there might be no throw-over too. :)
Anybody would like to share on your short entry plan? Jeff Kennedy taught to entry short (sell stop limit) below wave 4 in the ending diagonal. But the stop loss is huge (above the top of wave 5), especially if throw-over occurred in wave 5 of the ending diagonal.
Any suggestion(s)?
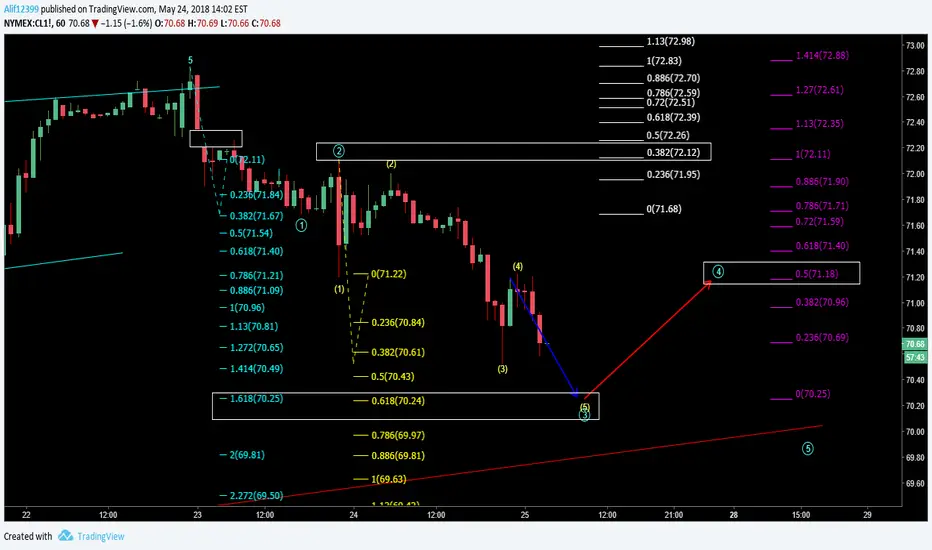
Wave 4 Might Have Started (alternative wave count)This idea is valid ONLY if price breaks 70.66. If price doesn't break 70.66 and rebound, my preferred wave count is still this one:
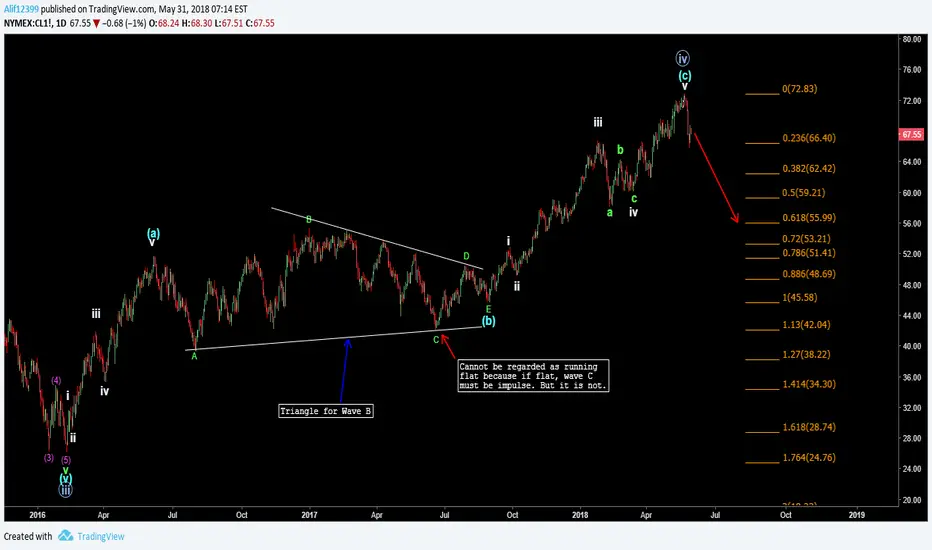
Monthly Wave Count For Crude OilI believed we are in wave 4. Wave 4 can be a double / triple tree. That means it is possible we are still in the subwave c of A. Soon, wave B will start. Bearish divergence at monthly, weekly and daily tf are so obvious. Be careful for those who are thinking that price will keep on going up until USD100. Anything is possible in this world but...let's be practical. :)
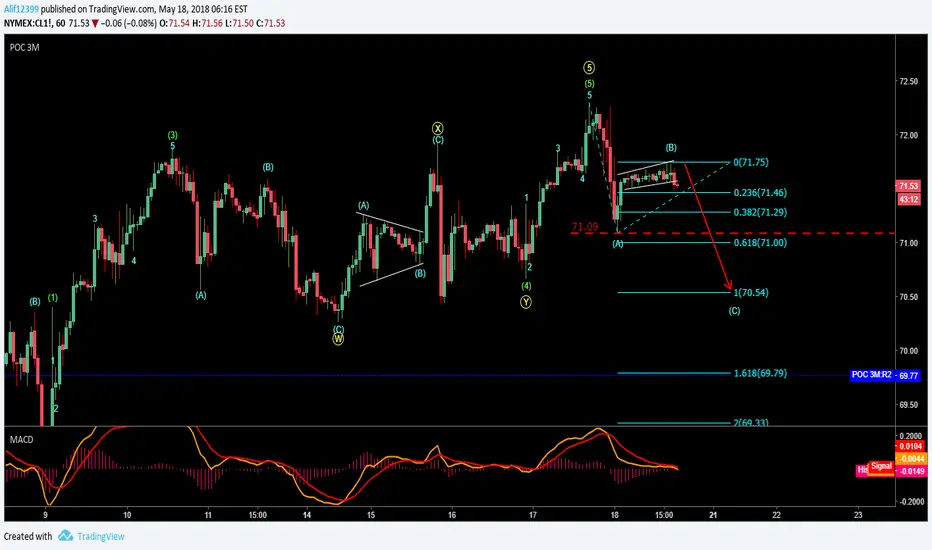
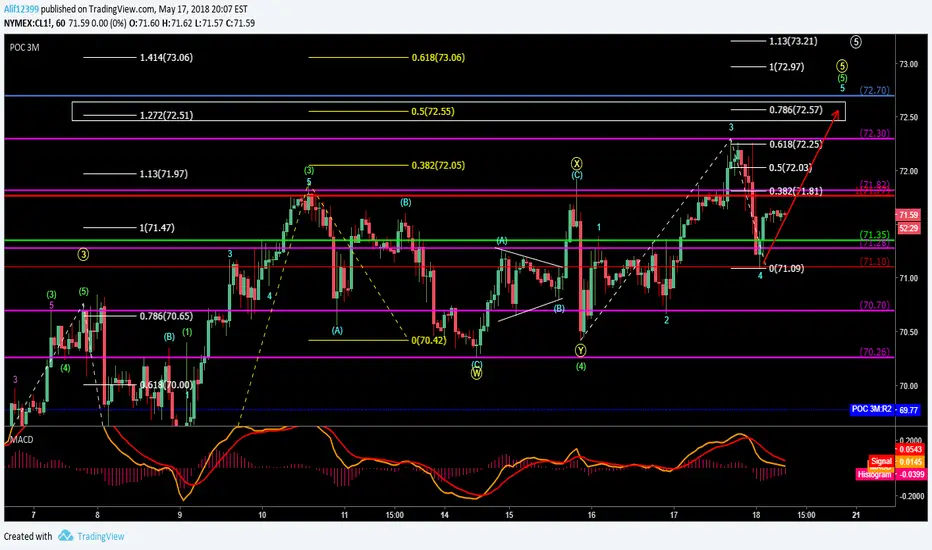
Wave 4 Was A Running FlatX went higher than top of wave 3 (green in bracket). Y made 5 legs (impulse) but didn't went down below W. And then price kept on making higher highs. That should gave us a hint that wave 4 was a running flat. Look out for the confluence of fibo levels in the white box and the blue horizontal line at 72.70. That might be the next target.
Crude OilCrude have been in strong uptrend since last year, but for now short term momentum indicators suggesting a small retracement, but however the medium term trend is still strong, so i am expecting a test of 72.95 over the coming days or so. I would be building a long position around 65.74, with a tight stop below 65.03, targeting 72.95.

Crude Oil Elliot Wave Idea Most of the recent big moves in oil have been preceded by some sort of triangular consolidation, possibly same scenario now
Wave 4 of Wave 5 CompletedI believed Wave 5 of 5 had started. The first target should be 38.2% (yellow fibo level on the right). Need to check for confluence with the white fibo levels on the left and count your wave at smaller tf to estimate the peak of wave 5.
Wave 3 of Wave 5 Completed There is a possibility that wave 3 of wave 5 of Wave C in Wave 4 has been completed. We can wait for wave 4 to bottom and long again. I don't expect price to climb much further. You can check the momentum at Weekly tf. Bearish momentum is obvious at weekly tf.