BRIEFING Week #31 : S&P ATH may have been a TrapHere's your weekly update ! Brought to you each weekend with years of track-record history..
Don't forget to hit the like/follow button if you feel like this post deserves it ;)
That's the best way to support me and help pushing this content to other users.
Kindly,
Phil
Crypto-trading

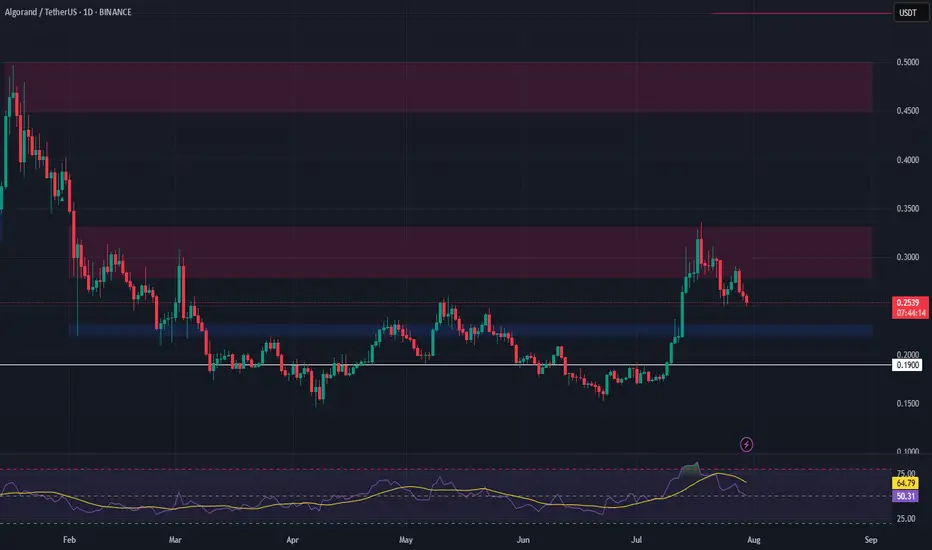
ALGO Swing Trade – Waiting for Pullback to Key SupportAfter a 100%+ surge, ALGO is now retracing and approaching a critical support zone. A dip into this area could offer a strong entry for the next leg higher.
📌 Trade Setup:
• Entry Zone: $0.22 – $0.23
• Take Profit Targets:
o 🥇 $0.28 – $0.33
o 🥈 $0.45 – $0.50
• Stop Loss: Just below $0.19
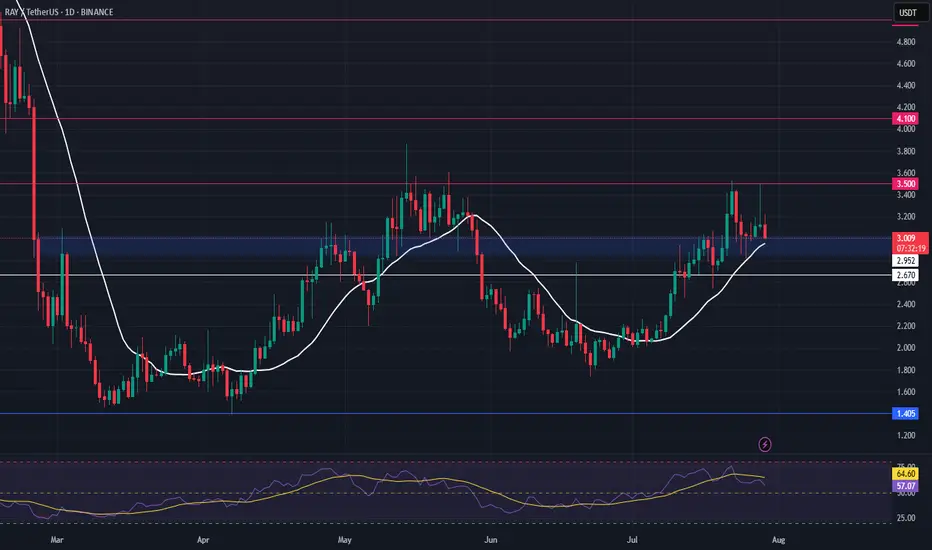
RAY Swing Trade – Key Support Retest in PlayRAY is pulling back toward a major support zone, offering a solid opportunity to position for a bounce as market structure remains constructive.
📌 Trade Setup:
• Entry Zone: $2.85 – $3.02
• Take Profit Targets:
o 🥇 $3.50
o 🥈 $4.10
• Stop Loss: $2.67
Ethereum Eyes $8K After Bullish BreakoutEthereum (ETH) is setting up for a powerful move. After hitting a multi-month high last week, ETH pulled back into a higher-low formation—strengthening the newly established bullish trend.
Money flow is shifting: with recent crypto legislation, Ethereum is now benefiting even more than Bitcoin, marking a notable change in market dynamics.
📈 Technical Highlights:
✅ Short-term target: $4,800–$5,000 (new all-time highs)
✅ Long-term potential: $7,000–$8,000
🛡️ Key support: $2,800–$3,000 (bullish as long as this holds)
📣 Takeaway:
Ethereum’s trend is firmly bullish. As long as support holds, pullbacks could offer strong entry opportunities for both swing traders and long-term investors.
#Ethereum #ETHUSD #Crypto #Trading #TechnicalAnalysis #CryptoTrading #EthereumPrice #Altcoins #Bullish #Breakout

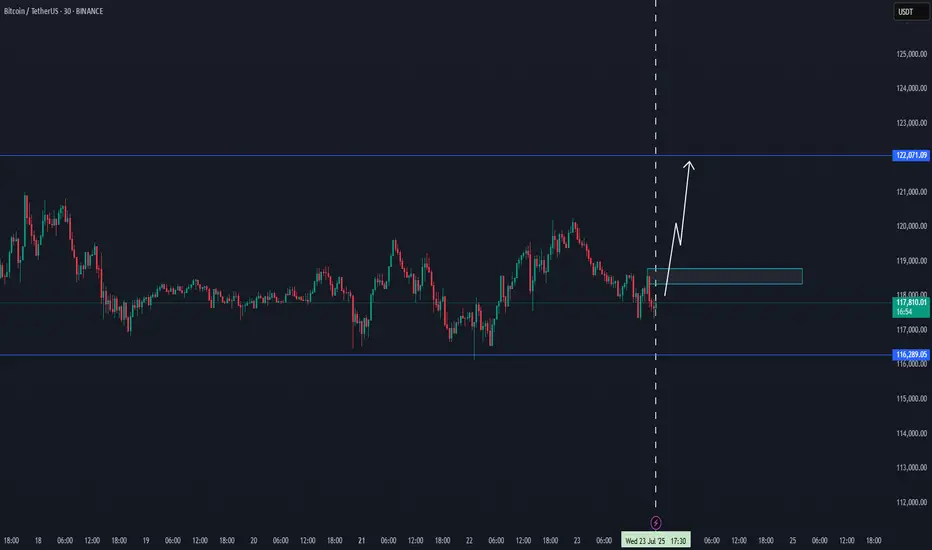
BTC NEW VOLUME TREND 122KThis is a small time frame update, where BTC can try to target 22K again in the coming time frames. Since the last 15H breakdown volume, BTC can enter new uptrend volume
From the box level, there is a good chance for a new uptrend.
HOOK Testing Red Resistance & Forming Double Bottom🚨 HOOK Testing Red Resistance & Forming Double Bottom 🔴📈
HOOK is currently testing the red resistance trendline and has formed a bullish double bottom pattern, which could indicate a potential reversal.
🎯 If breakout is confirmed:
✅ First Target – Green line level
📊 A confirmed breakout of both the resistance trendline and the double bottom structure could signal strong bullish momentum.
Watch for confirmation before entering! 💼💸

Ethereum: Breakout Holds Strong | Next Targets $4K, $7K+Last week, three major crypto bills cleared the U.S. House of Representatives—and Ethereum (ETH) is emerging as the biggest winner from this legislative momentum.
ETH recently broke out of a rounding bottom pattern and hasn’t looked back. Momentum continues to build, and it’s now outperforming most other major assets.
📈 Technical Highlights:
✅ Short-term target: $4,000
✅ Long-term potential: $7,000–$8,000
🛡️ Key support: $2,700–$2,800 (bullish as long as this holds)
📣 Takeaway:
Ethereum’s breakout remains intact. Pullbacks into support could offer high-probability setups for swing traders and long-term investors.
#Ethereum #ETHUSD #Crypto #Trading #TechnicalAnalysis #CryptoTrading #EthereumPrice #Altcoins #Bullish #Breakout

BRIEFING Week #29-30 : BTC stalling, ETH & then Alts ?Here's your weekly update ! Brought to you each weekend with years of track-record history..
Don't forget to hit the like/follow button if you feel like this post deserves it ;)
That's the best way to support me and help pushing this content to other users.
Kindly,
Phil

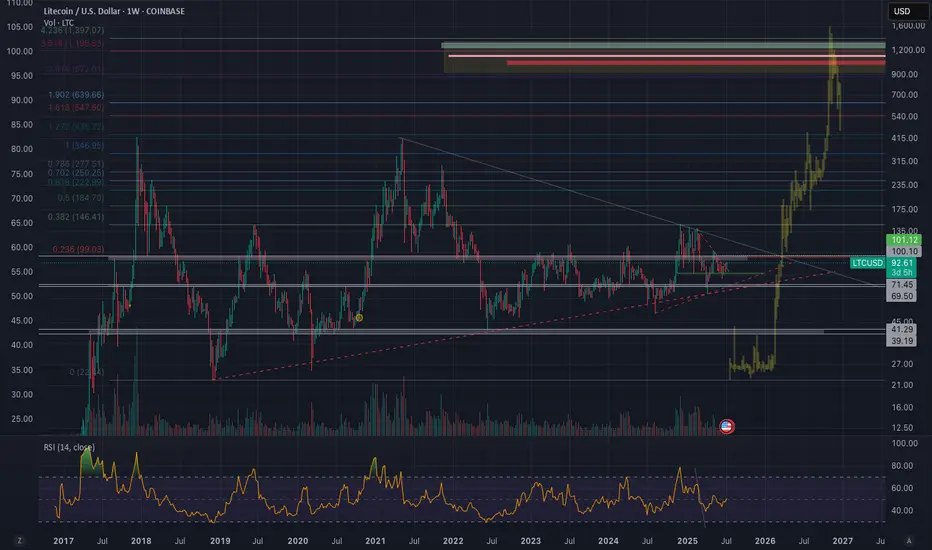
Litecoin to $1100 (12X) In This Coming AltseasonBased on tried and true fractals, multi-fib confluences, and historical price action, Litecoin is poised to hit prices between $900-1500 this cycle. The multi-fib confluences are pointing to $1100-1200 range as the most likely target. This is expected over the next 6-12 months if things continue to play out how I am expecting. As of today SEC approval of a LTC ETF is imminent but yet to be actualized.
BRIEFING Week #27-28 : Distancing from US MarketsHere's your weekly update ! Brought to you each weekend with years of track-record history..
Don't forget to hit the like/follow button if you feel like this post deserves it ;)
That's the best way to support me and help pushing this content to other users.
Kindly,
Phil

BRIEFING Week #26 : Are we going for a Bubble ?Here's your weekly update ! Brought to you each weekend with years of track-record history..
Don't forget to hit the like/follow button if you feel like this post deserves it ;)
That's the best way to support me and help pushing this content to other users.
Kindly,
Phil

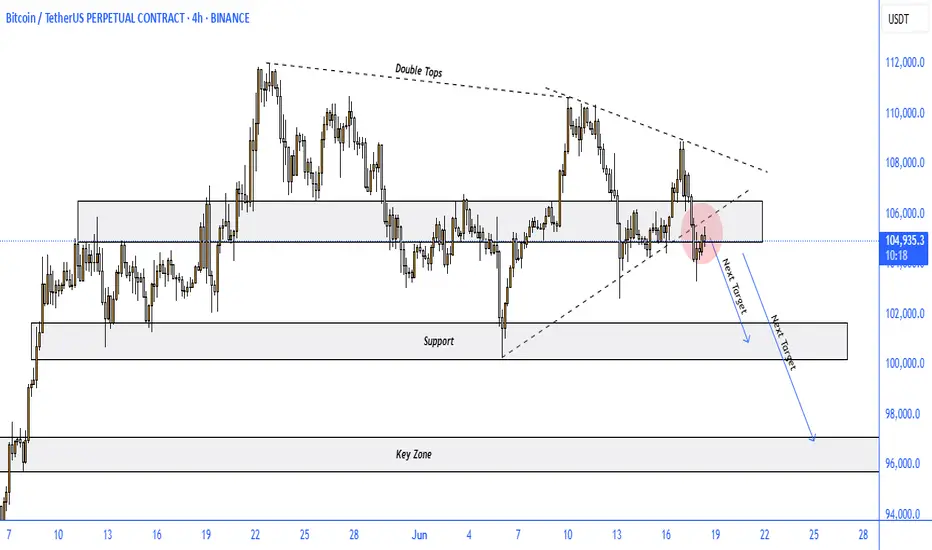
BITCOIN BEARISH SETUPTechnical Analysis Summary:
Pattern Formation: The chart shows a descending triangle pattern with double tops, indicating bearish pressure at resistance levels.
Breakdown Confirmation: Price has broken below a key ascending trendline (shown in dashed line) and retested the breakdown area, forming a bearish rejection (highlighted red zone).
Key Zone: The price is currently trading around $105,075, just under the previous support-turned-resistance zone (~$106,000). This confirms a failed bullish structure and strengthens the bearish outlook.
Targets:
First Target: Around $101,000–102,000, aligning with the next visible support zone.
Second Target: Around $97,000–98,000, which is a major support / key zone based on prior structure.
Bias: Bearish in the short term, as long as price remains below the $106,000 resistance zone.
Trade Setup Outlook:
A short position is implied by the arrows.
Best entries are around retests near $105,500–106,000 with stops above the recent highs (~$107,000).
Conservative profit-taking at the first target, with extended TP near the key support zone.
BRIEFING Week #25 : Heading into Summer ModeHere's your weekly update ! Brought to you each weekend with years of track-record history..
Don't forget to hit the like/follow button if you feel like this post deserves it ;)
That's the best way to support me and help pushing this content to other users.
Kindly,
Phil

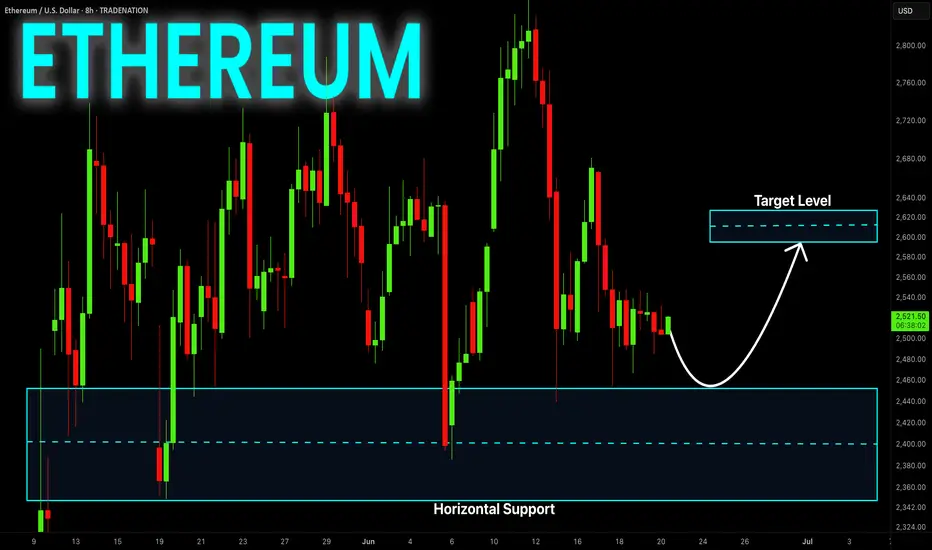
ETHEREUM Risky Long! Buy!
Hello,Traders!
ETHEREUM is consolidating
Above the horizontal support
Area around 2360$ and we
Are already seeing a local
Rebound from the level
So as we are bullish biased
A further price growth
Is to be expected
Buy!
Comment and subscribe to help us grow!
Check out other forecasts below too!
Disclosure: I am part of Trade Nation's Influencer program and receive a monthly fee for using their TradingView charts in my analysis.
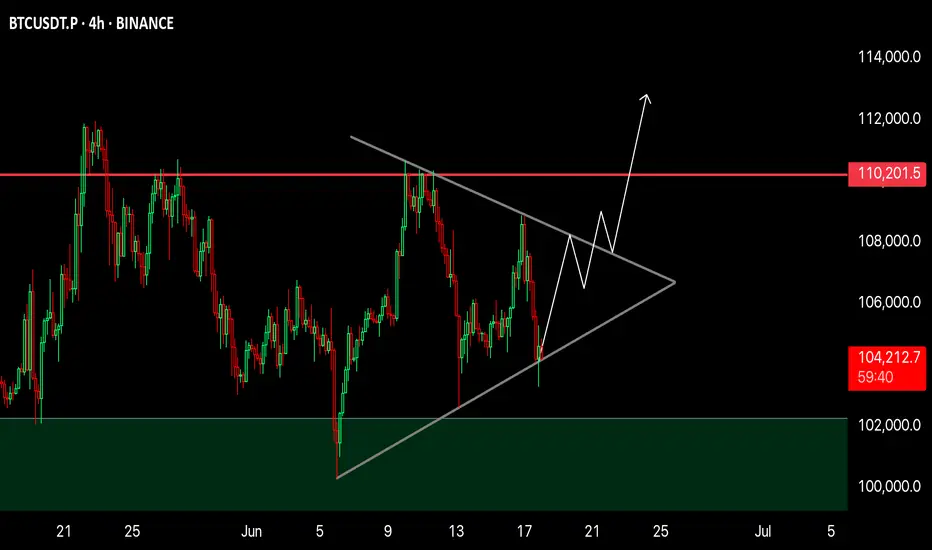
BTC 4H Analysis📈 BTC 4H Analysis – Symmetrical Triangle Breakout Loading
Bitcoin is currently consolidating inside a Symmetrical Triangle, forming higher lows and lower highs – a classic sign of volatility compression.
🔹 Structure: Symmetrical Triangle
🔹 Support Holding Strong – bulls defending the zone
🔹 Breakout Expected Soon
🔹 Major Resistance: $110,200
🔹 Breakout Target: $112,000+
Price is coiling up. Break above the triangle = strong bullish continuation likely.
🚀 Eyes on breakout — next move could be explosive!
NFA | DYOR
BRIEFING Week #24 : is Stagflation Coming next ?Here's your weekly update ! Brought to you each weekend with years of track-record history..
Don't forget to hit the like/follow button if you feel like this post deserves it ;)
That's the best way to support me and help pushing this content to other users.
Kindly,
Phil

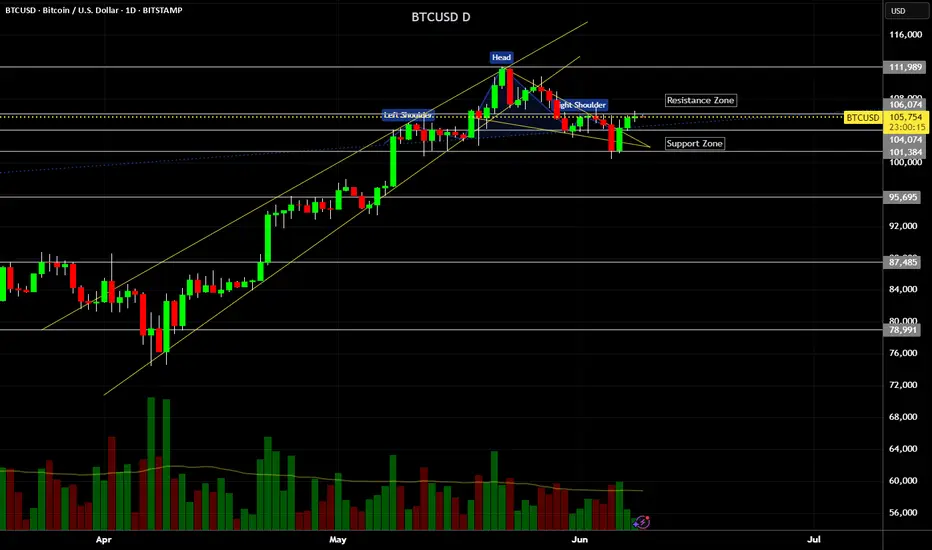
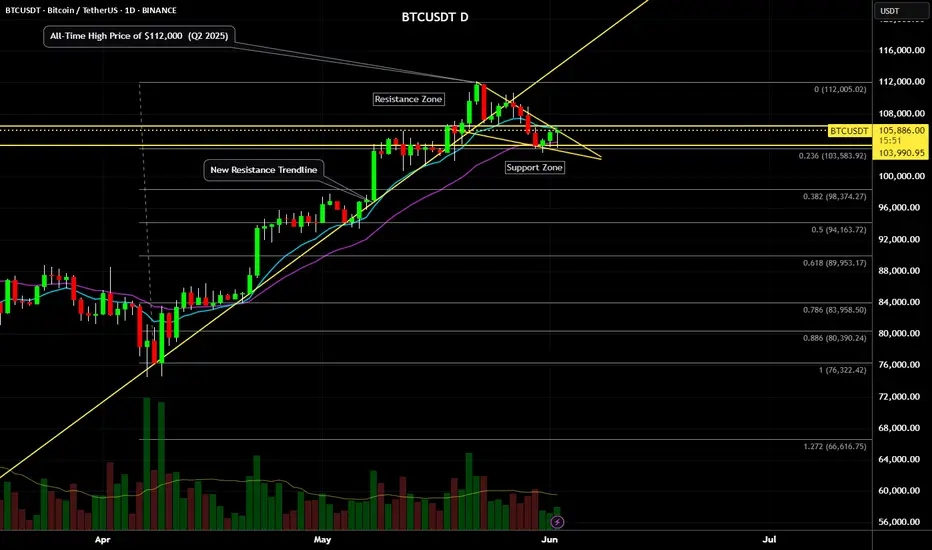
Bitcoin (BTCUSD) - Daily Price Consolidation Under ResistanceBitcoin (BTCUSD) price has been in a short-term downtrend since June 2025.
Price is currently consolidating under $106,000 resistance.
Watching to see if an evening star candle pattern prints on the daily chart, for a very-short-term pullback.
Support targets: $105,000, $104,000, $101,000, $100,000.
Resistance targets: $107,000, $109,000, $110,000, $112,000.
Bitcoin has been correlating with the USA stock market, tech stocks, consumer sentiment, and breaking news.
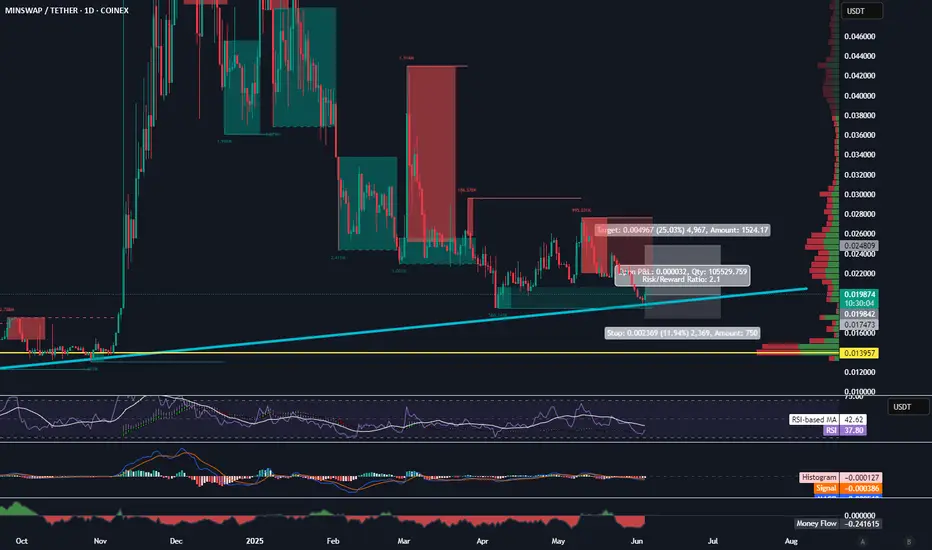
Minswap looks like a good entry here.Trading Fam,
I'm seeing great potential on this Minswap entry.
First, we're oversold on all lower indicators.
Secondly, we're back inside of a green liquidity block.
Third, we're on excellent support (aqua trendline).
This trade is a no brainer. I'm setting my target for an easy 25% profit target at which point I'll take half off and let the rest ride a bit longer, trailing my stops as I go.
Stew
Bitcoin (BTCUSDT) - Price Testing 26EMA and 12EMA - Daily ChartBitcoin (BTCUSDT) price is currently testing the 26EMA and 12EMA price levels on the Daily chart.
Bitcoin price has been in a medium-term uptrend since April and May 2025.
However, a short-term downtrend pullback has occurred and the price recently bounced up from the 26EMA zone ($104,000).
A morning star candle price pattern printed above the 26 EMA support line.
Large buyer volume could confirm the price candle pattern and Bitcoin price could rally up above 12EMA resistance ($106,000).
If price continues to reject and fall below $106,000 the downtrend would likely continue into June 2025.
Breaking news and stock market correlations could affect the price of Bitcoin and cryptocurrencies.
Tariff news and trade deals are supposed to occur throughout June and July 2025.
BRIEFING Week #22 : Still waiting for OilHere's your weekly update ! Brought to you each weekend with years of track-record history..
Don't forget to hit the like/follow button if you feel like this post deserves it ;)
That's the best way to support me and help pushing this content to other users.
Kindly,
Phil

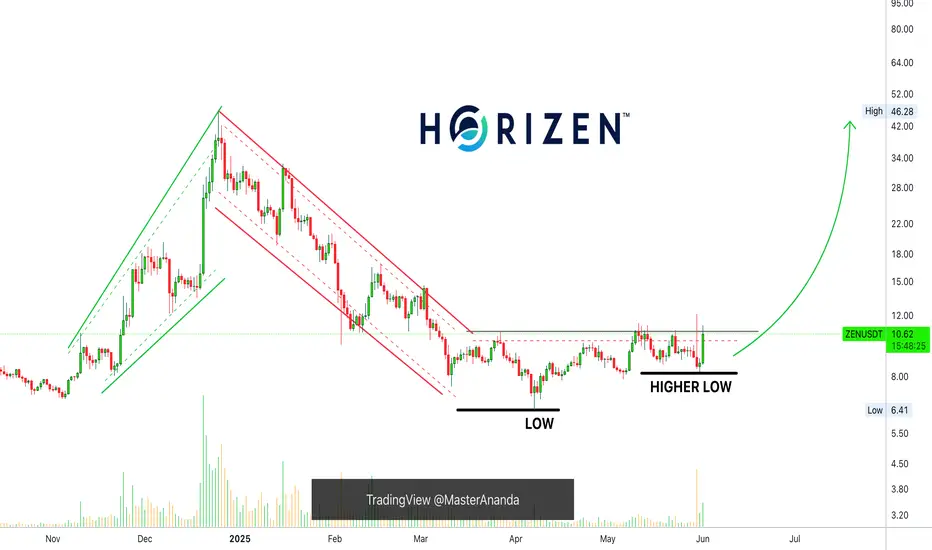
Horizen: What You Need To Know About The Altcoins—Experts Only!A shakeout is a market move where the whales (exchanges) create volatility in order to rattle unprepared traders and investors.
If you use a limit stop-loss and you are clueless, the exchanges and market whales can see your orders and they use this to their advantage. Since they own all of the coins and everything basically, they can move the market. They produce a massive amount of pressure until everybody freaks out.
Those with too much leverage gets their positions liquidated. Everything lost. That's fine, it is their fault for being too greedy. Learn from your mistakes. Take the loss and move on. Nobody to blame. Just a lesson and a learning experience.
Those with a tight stop-loss limit order get to sell at a lower price and secure a small loss, sometimes between 10-30%.
Those patient, @MasterAnanda readers and followers, get to watch from a distance and even buy more when prices are low. No loss.
Let me get back into conspiracy theory mode.
So the market produced a bottom and is set to grow long-term. Very stupid and greedy people start to become very aggressive and decide to buy with 15, 18 and even 20 or more X.
We have no compassion for these people because this obviously greed, too much of it. And of course, this can never work.
The market is like a living being. Like a horse or a camel. It feels it has too much weight on top of it and if it wants to go the long ride, it has to get rid of this weight. The shakeout only lasts a few days but more than 1 billion USD was removed from the market. This is all leverage. This has nothing to do with buyers, investors or spot traders ok?
So these were literally gamblers that lost money. This is not a casino, this is a financial market. Learn to play the game or get REKT.
The way to play is to buy and hold.
The way to play is by participating, being part of the market and accumulating.
Of course, there is nothing wrong with gamblers but if you do gamble, there is a very strong risk involved.
While a gambler can lose everything in one single bet. A spot trader can hold and if prices drop, simply wait. The worst case scenario ends up being a long wait.
It is a shakeout and look at this chart, ZENUSDT. Two days later, the market is back up—full green. We have a higher low.
This is only the start. It will get harder and more complex as the bull market develops.
Please, whatever you do, do not use margin or leverage if you don't know what you are doing, the results is never anything good.
The only reason why you would use leverage is "to earn more money." "To earn more," "to earn fast." How did that go?
In the quest for fast money, big money, you ended losing hundreds of thousands in less than a month.
It can take 2-3 months to earn a sure 100-300%.
It can take 3 weeks to have your entire position liquidated.
Anyway, stay away from leverage if you can't keep it below 5X.
If you do go there, just know that you will not make it out alive. Everybody is thinking that they can beat the professionals, but the professionals are trading 24-7, you are on a phone and only check-in every few days. By the time you try to adapt, everything is gone. You are not buying from an exchange, you are competing against them and it is a losing game, they hold your money, your history, your data, your coins. They will always beat you because they know everything that you do, and you know nothing about how they work.
They'll give you a great website, lots of numbers, lots of cats and dogs and the illusion that you can make money easily without much effort. You lose money and they make billions.
If you want to win, play long-term.
Only use leverage when you have been successfully trading spot for 2-3 years, minimum. And when you do start with 3X.
By the way, if you don't have time to plan, to read, to prepare, you won't have time to get paid.
This is the most advanced game in the whole world. It is a money game. Only a very small percent are successful at it. Think before you believe you can come ahead without any effort, you are playing against us—we own the market.
Thank you for reading.
Namaste.
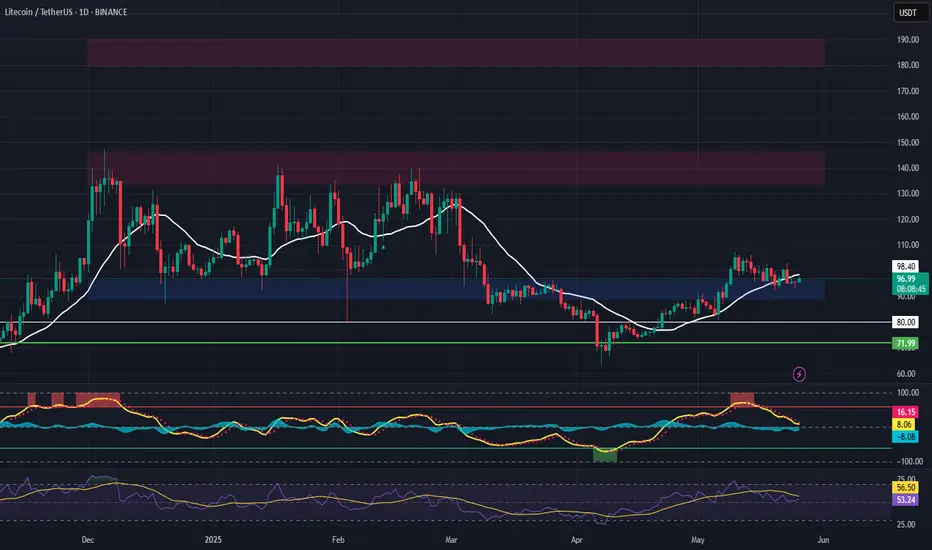
LTC (Litecoin) – Swing Long Setup from Support ZoneLTC is currently pulling back into a key support area between $89 – $96, which has historically provided strong bullish reversals. The zone aligns with a potential higher low on the daily timeframe, making it a solid area for a risk-reward favorable swing long.
🔹 Entry Zone:
$89 – $96 (structural support and previous demand zone)
🎯 Take Profit Targets:
🥇 $133 – $146 (key resistance and prior local highs)
🥈 $180 – $190 (macro range highs and psychological barrier)
🛑 Stop Loss:
Hard stop at $80 (clear break of structure and invalidation of higher low)
BRIEFING Week #21 : Watch out for ComoditiesHere's your weekly update ! Brought to you each weekend with years of track-record history..
Don't forget to hit the like/follow button if you feel like this post deserves it ;)
That's the best way to support me and help pushing this content to other users.
Kindly,
Phil
