BTC/USDT – 2H Chart Update!!BTC/USDT – 2H Chart Update
Breakout Confirmed:
BTC has broken above the descending trendline but is currently facing resistance at around $ 119,500.
Support Zone:
Strong ascending support between $ 117,000 and $ 118,000 remains intact.
Moving Average:
Price is currently testing the 2H MA (~$118.3). Holding above this could confirm bullish continuation.
Outlook:
If BTC holds above $ 118,000, a move toward $ 123,000–$ 125,000 is likely.
Failure to hold may retest $117K support.
Bias: Short-term bullish unless price breaks below ascending trendline.
Thanks for your support!
DYOR. NFA
Crypto

Ethereum Name Service Easy $131 Target · $208 Possible or HigherEthereum Name Service really took off in late 2023. March 2024 did nothing to this project. Here we can see an extended period of higher highs until December 2024. Many projects produced a major high in March 2024 to turn bearish until recently. In December, all of these produced a lower high. You can see how different this chart looks. This is a strong project the chart is saying.
There was a strong correction between December and April, this was a marketwide event. You can see how ENSUSDT moved below 0.786 Fib. retracement for several months just to recover. In June it remained below this level only briefly, for two weeks, and we are now full green.
Last week's candle closed above 0.618 Fib. retracement and we are back in the bullish zone. Full blown bullish as Ethereum Name Service is trading at the highest price since January 2025. Everything shows the market being ready for additional growth.
The recovery above support never supports a crash but instead a bullish continuation. For a crash, we would see a rejection or very weak action around resistance. Instead, we have full green candles with rising volume. Perfect conditions for higher prices. Just what we need and want to see.
The targets here are good, $131 and $208. I don't think this will be the end though and we have another wait and see. I think between $285 and $361 is a better prediction, these targets are also shown on the chart.
How far up do you think ENS will go?
Namaste.

Stacks · Major Flush Reveals End of Correction · New CycleStacks all-time high was hit April 2024. This ATH comes as a long-term double-top because it happened within the same November 2021 peak price range.
After a major wave there is always a correction. A correction can happen in any direction. If the trend is bearish, the correction is an up-move. If the trend is bullish, the correction is a down-move. Very simple.
The 2021 all-time high is the natural end of a major bullish cycle and thus a correction follows. The correction lasted from November 2021 until November 2022. Naturally, a major market bottom signals the start of a change of trend.
Here STXUSDT produced a bullish cycle from November 2022 until April 2024, 504 days. In April 2024 we have a new major high and this signals the start of a bearish wave. The bearish wave went from April 2024 through April 2025. The end of the down-move would signal the start of a new bullish cycle but, how do we know the down-move is over? Answer: A major market flush.
On the 12-May week there was a major market flush with a session reaching lower than the 7-April low. This is the bottom signal. It reveals itself as a bottom signal because instead of a new lower low close the week recovered and closed very high. After a higher low in June compared to April we now have four green weeks and we know what the rest of the market is doing so we can predict easily a bullish continuation; a price increase.
The size of the drop between April 2024 and May 2025 reached -92.49%. That's a huge drop. Almost all the gains from the previous 504 days bullish cycle was erased. The market has no reason nor need to move lower, for what? There is no need to dig for anything down there and that's the signal that reveals the bottom is in. Because the correction was so strong, we can expect a change of trend. We are aiming up.
Stacks major market flus in May 2025 reveals the correction is over. With the end of a strong bearish cycle confirmed, we can now expect a strong bullish cycle to develop next. If we go by past history, we can see sustained growth, it can happen for years or in the least many months.
How long will the bullish cycle last?
I don't know.
From March 2020 to November 2021 we have 630 days. The other cycle I just mentioned lasted 504 days. We can use these numbers to make some predictions but it is hard to say because market conditions are not the same.
504 days from May's low into the future gives us a date of September 2026. 630 days puts us at February 2027.
If we go by the law of alternation, we had a long cycle in 2020/2021 so this time we get a short one, say 38% or half the past bull market, this would give us 239 and 315 days. These two will give us dates between January and March 2026 for a new all-time high or cycle top.
Now, I cannot predict how long the bull market will last but I can predict that prices are going up. Since we know we will have a major rise lasting at least 6 months, the next logical step is to buy and hold. When Stacks starts trading 1,000% up, you won't care how the long bull market will last, you will just be very happy and grateful with the results.
The easy target is $6.19, but if we get an extended bull market we can go to $9.83 or even $13, or higher. It all depends on how it all develops, but we are going up. We are talking profits between 600% and 1,400% coming from current prices.
Thanks a lot for your continued support.
Namaste.

Artificial Superintelligence Alliance (FET) Enters Bullish PhaseThere is always really high volume on this chart. FETUSDT trading is very active and this is always a good signal regardless of the overall picture. It means there is interest in this trading pair. Some pairs you can see have absolutely no volume and you know only bots are trading it. When volume is high, you know there are some people buying and selling behind the scenes and when the market goes on a trend, it tends to produce wild moves. So high volume is always good.
The trend is the uptrend next. We already saw a major downtrend starting March 2024. After a low in August 2024, the classic dead-cat-bounce led to a lower high in December and then the final bottom, just two months ago. This is the correction end and bottom and from this bottom we grow. Market conditions are changing.
The bearish phase is over and it lasted more than a year. One year and one month. We are now entering a new phase and it will be a bullish cycle. How long will it last? Can the bullish cycle last just 3 months while the bearish cycle lasted 13 months? These are good eye opening questions. It shows that we might be setting ourselves up for an entire year of growth.
Actually, can be 4 months, 6 months, 8 months, 12 months or more... It doesn't matter, we are going up. Artificial Superintelligence Alliance —FET.
Namaste.
Jupiter & The Exponential Moving Averages · Volume BreakoutFirst I looked at a pair and it was struggling to move past certain long-term EMAs. Then I opened up Jupiter, JUPUSDT, and I can see it moving forward... This is a bullish development.
Just today a multiplicity of bullish signals came together. JUPUSDT broke above its May 2025 high. Hitting the highest price since March, almost 5 months ago.
After a higher low 22-June, JUPUSDT rallied and continued to gain strength. After 9-July, it started to break, one by one, all the moving averages on this chart. These levels were working as resistance.
First EMA55 was conquered after eleven days struggling below. Then EMA89 was conquered one day after, the blue dotted line on the char. Four days later the action moved above EMA144 followed by MA200 and EMA233 yesterday; today, JUPUSDT is trading above all those major levels, with the highest price in five months.
This is as good as it gets and it reveals the intensification of a newly developing bullish wave. This wave will transform into an uptrend and this uptrend will lead to a major bull-run. The bull-run will go hiiiiigh reaching a new all-time high, the end of the bullish cycle; the entire process can take anywhere between 4-6 months or 8-12 months or more. It really depends on the overall market condition, Bitcoin and how active is the project developers team. This can all work together to produce something great.
Volume is starting to rise now. This means that it is still very early in this game.
We are just entering the bullish zone. After a major high is confirm, we can see very strong exponential growth.
While at first it takes months for prices to grow 2-3 levels up, when the wave is advanced we can see several levels increase in a matter of weeks and then it keeps on intensifying until the market goes crazy and that's when you see euphoria and greed. It is still early, but it doesn't hurt to be prepared.
Keep a calm and sane mind, you will need it to maximize profits and close as many as possible successful trades.
Namaste.
Uniswap Exits Opportunity Buy Zone · $73 & $118 2025 ATH TargetUniswap is finally out of its long-term opportunity buy zone, a trading range that was activated first in 2022 and remained valid for a long time.
After October 2023, UNIUSDT produced two bullish moves but each time fell back into this zone. Orange/brown on the chart. Notice how this zone matches price action happening below EMA89, EMA55, MA200, EMA144 and EMA233. As Uniswap turned bullish and fully confirmed, it broke above all this major levels.
Last week, it managed to close above the really long EMA233 and this week the action is staying above. Currently $10.30.
Notice waves "1" and "2" these are relatively small waves. Something will happen with #3. The market evolves exponentially. Instead of another similar wave going a bit higher, it will be something like 2021. Not like 2021 in the sense that it will reach similar price levels, but in the sense that it will be completely out of proportion with what you saw in the last several years. Prices will go off-the chart.
We can think of resistance as a new all-time high being found around $73 and $118, but this time I only want to call your attention to this moment now. The fact that market conditions are changing and it is still early when we focus on the long-term.
I just realized that I might be seeing things differently and it is hard to visualize, for someone without the actual experience, what is about to happen. But despair not because that is the one reason why I am here and why you are reading this. I am here to alert you, remind you and prepare you for an event before it happens. In this way, you can profit and achieve your financial goals. I want to give you value in exchange for your trust. Will you trust? Uniswap is going up. Crypto is going up and it will be the best since 2021. Possibly the best bull market in the history of Crypto, the new regulatory framework and global adoption is saying so.
Thanks a lot for your continued support.
Namaste.

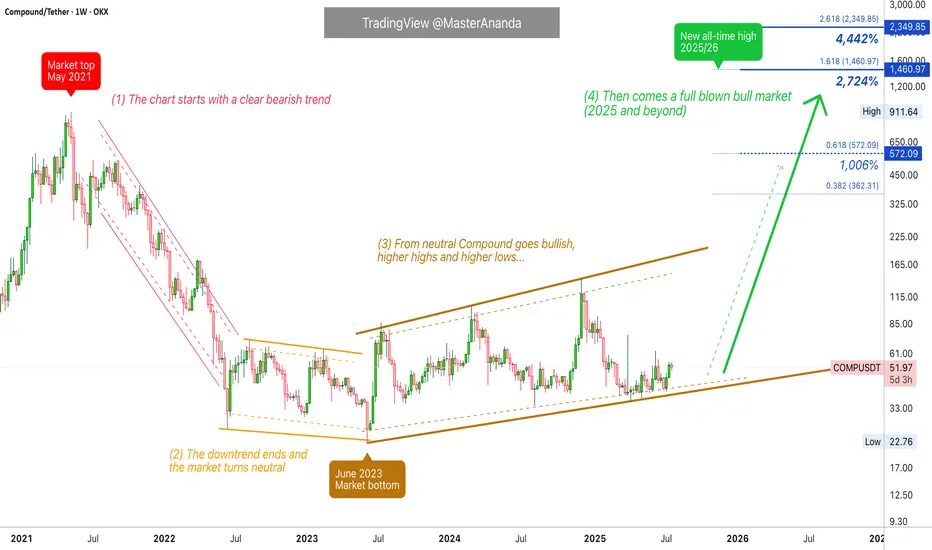
Compound Full Market Cycle · 1, 2, 3 & 4 (PP: 2,700% - 4,442%)This is the full long-term Compound (COMPUSDT) chart.
1) The market top happened May 2021. Notice how the bull market in 2021 ended early compared to 2025. While May signaled the start of a bear market, in 2025 we are already in July while trading at bottom prices.
High prices, a new all-time high, signals the start of a descent and bear market. COMPUSDT dropped from May 2021 until June 2022, more than a year. A shy lower low happened next around June 2023, a technical double-bottom.
2) Between June 2022 and June 2023 we have a neutral period, sideways. This is a "lost year."
3) Market dynamics change after June 2023. COMPUSDT stops producing lower lows and instead starts a bullish consolidation phase. Higher highs but still sideways. No major uptrend. This period lasts from June 2023 until present day, July 2025.
The pattern will break with a strong close above $150 followed by a sustained uptrend.
4) This is the 2025 bull market which can extend beyond this year into 2026, hopefully. Here instead of neutral or sideways, we should see a major uptrend as the mirror image of the 2021 downtrend. Also, a new all-time high is needed and expected to end this cycle. When the new all-time high hits, bearish conditions develop and the next bear market starts.
Potential for growth is huge, between 28 and 45X.
Thank you for reading.
Namaste.
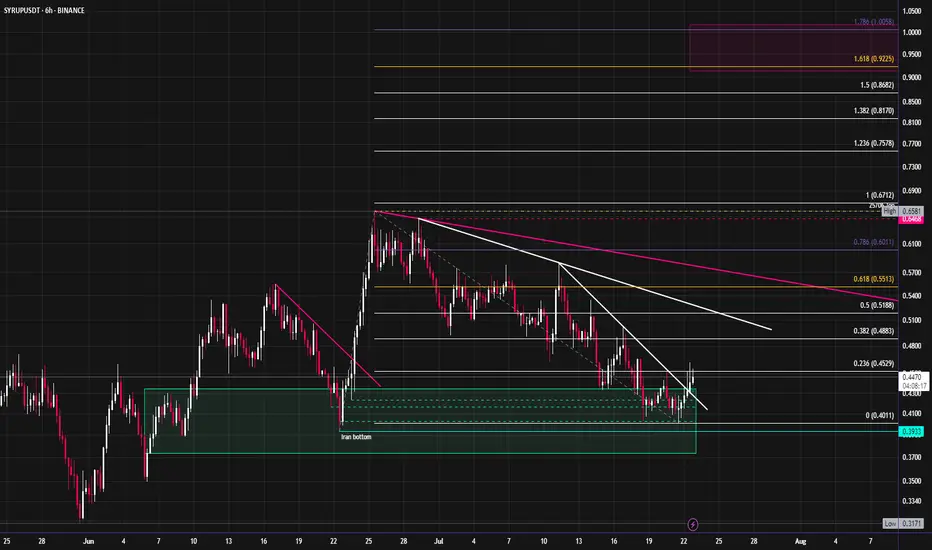
Syrup looks ready to start moving towards new ATH'sCRYPTOCAP:SYRUP has started to break out of its downtrend after revisiting the June lows. It has outperformed most of the market since April, with this month's pullback being an exception. I expect an aggressive move up into new highs. The fibs around $1 look like a good target for the short term, this would also be ~1b mc.
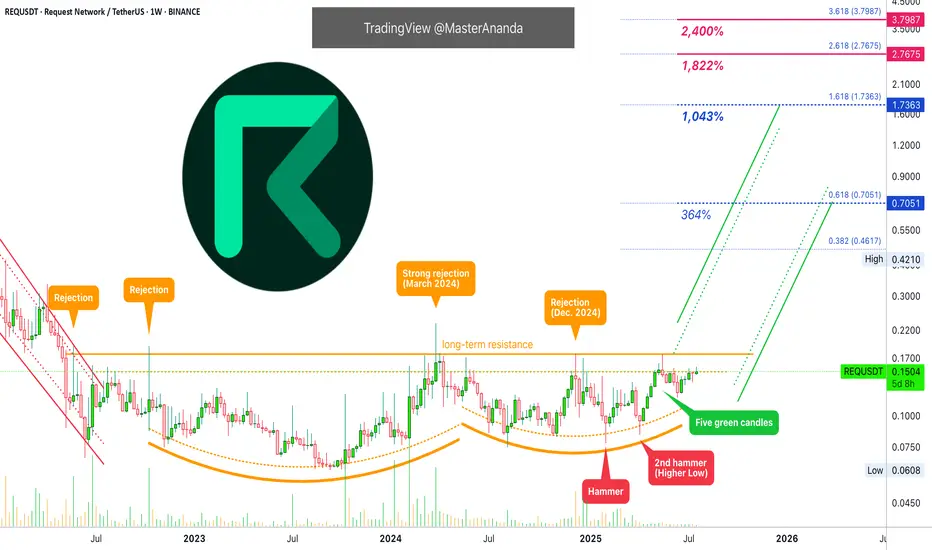
Request Network Has 1,800% Potential for Growth (Lev. Setup)This is a chart setup that I am opening with leverage. It is not available on many exchanges and this reduces risk for swings and shakeouts. The action has been strong.
Request Network (REQUSDT) produced a strong higher low in June compared to February and April this year. Many pairs produced double-bottoms or even a lower low in June. A higher low definitely reveals strength. This is what we have here.
The consolidation period has been going for 1,169 days. This is the exact same number we found on the DigiByte chart, more than three years. Three years of consolidation can lead to a very strong bullish cycle. So strong that it is hard to visualize but it will happen.
I am mapping a 1,800% target but just to be safe, I also have the 2,400%. Again, when the market lasts this long in the accumulation phase, it is because it is preparing for something great. The action is about to start within weeks or days.
The last barrier is the long-term resistance (orange) line on the chart. Once this level breaks, immediately you can expect +300% to 500%. After this initial boom, you can enjoy slow and steady growth for months. That's where we are headed. This will not only happen to Request Network but for most of the altcoins, Bitcoin is already up.
Retraces and corrections should be considered an opportunity to buy-in, rebuy and reload.
Namaste.
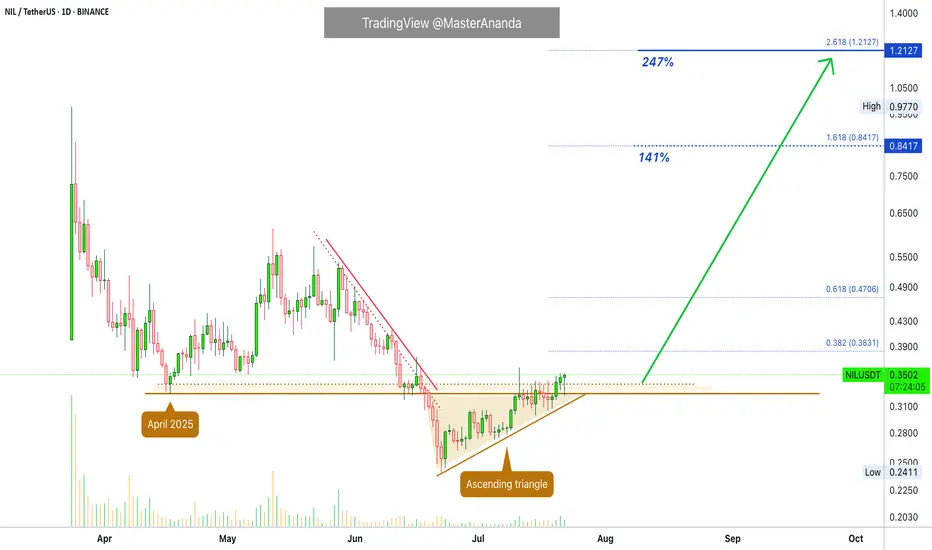
Nillion Token · Time Sensitive · Easy & Fast 247% ProfitsI am seeing many charts like this one with fully confirmed signals and ready to produce a strong advance exceeding 100-200% growth. The full move can develop within 2-6 weeks. Can be less if the action is very strong.
We are looking at Nillion Token (NILUSDT) on the daily timeframe. Our attention is called to two signals mainly: (1) A low mid-April and (2) an ascending triangle.
The ascending triangle is a classic reversal pattern. Since this pattern is complete with the action moving above the mid-April low, we have a fully confirmed bullish bias. There is also the current candle with a long lower wick. Sellers started the day but the bulls are ending it on a high note.
The beauty of this chart setup lies in the risk and potential for profits. Very low risk because the signals are strong, and profits can come fast because the bullish move is already advanced.
Get in and get out. Easy chart, easy profits, easy win, easy trade.
Thanks a lot for your continued support.
Namaste.
THETA Long Swing Setup – Accumulation Phase Near BreakoutTHETA is still consolidating in a range, but momentum is quietly building. A break above $1.07 followed by a higher low would confirm structural reversal. We’re eyeing the $0.95–$1.00 zone for a clean entry on retest, offering solid risk-reward if support holds.
📌 Trade Setup:
• Entry Zone: $0.95 – $1.00
• Take Profit Targets:
o 🥇 $1.60 – $1.70
o 🥈 $2.10 – $2.20
• Stop Loss: Daily close below $0.90

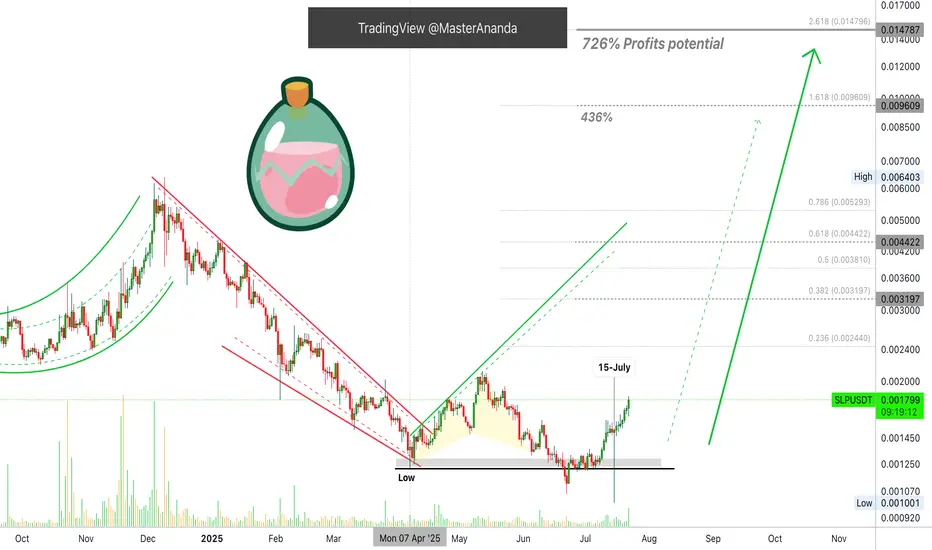
Smooth Love Potion 726% Easy Target & Technical AnalysisAs you already know the main low happened 7-April. It is always the same date but we are looking at a different pair so please, bear with me. Stay with me and continue reading because you are going to love the results. The technical analysis can be repetitive and that is only because I like to keep it simple using signals, systems and technics that work. I don't care about three hundreds indicators as long as the market moves in my predicted direction.
The low happened in April and then we have two challenges of this level, lower lows. In June two days closed below (black line on the chart) just to recover. There you have a strong bullish signal. A failed signal on the breakdown. Then again on 15-July there is a very long lower wick session and this is truly the most bullish signal ever. On this date there was massive selling and the action reached the lowest ever just to recover, the day closing green. When you see a candle like this, you know for certain and for a fact that the bearish move is done, not possible anymore.
Strong selling did happen, so strong that it created a major low—outside the broader marketwide pattern—but everything was bought within hours. Since all the weak hands, all leveraged positions, all stop-losses, everything was activated on that move, what is left is a bullish wave. There is no liquidity left on the downside so the market has to grow next, and this is exactly what is happening.
Now, very easy within months we can see 400% and even 700% growth. Of course, this will be far from the end. These targets are based on the daily timeframe. If we consider the long-term picture, Smooth Love Potion (SLP) can grow so much more. If you are interested in such numbers and projections, boost this post to let me know. If enough people want to see it I can publish a new chart with the new all-time high and beyond.
Thank you for reading.
SLPUSDT has been growing since June 22, an entire month. The price pattern is very similar to what I just explained on Toncoin, a major boom will develop in the coming weeks. It can be just a few days from now, say 2-3 days, or it can take a bit longer but it is getting close, so close, that you can obviously see pricing rising right now and the green candles are getting bigger... It will only get better.
Thank you for the love.
Namaste.
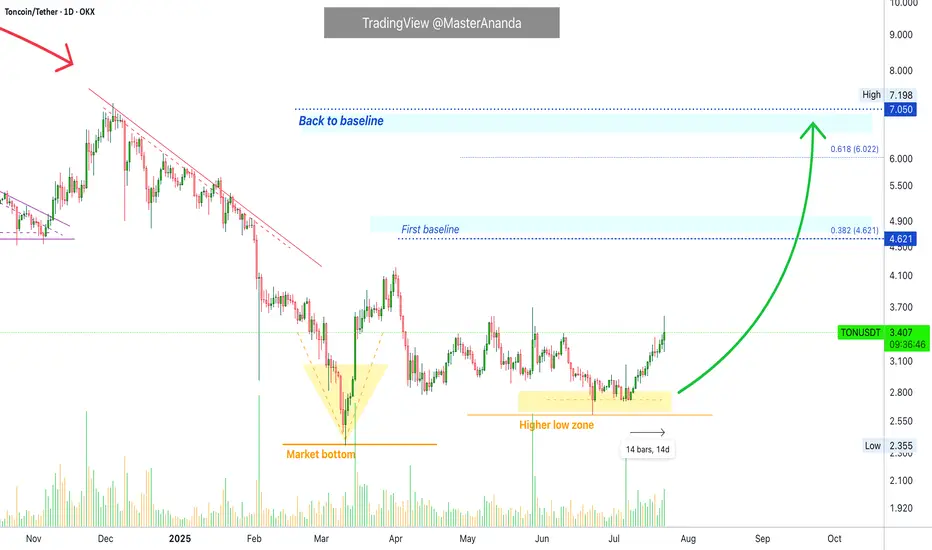
Toncoin Update · A Closer Look · Major Move in the MakingConsider this, Toncoin has been growing steadily for fourteen days straight. The growth is slow, steady and patterned, but it keeps on happening. Notice no strong sudden jump but still, straight up. This is how the bottom is missed.
At times, we buy and we are waiting for a sudden jump but this almost never happens. The way it works, in a bull market, we get a long drawn out build-up of bullish momentum. After weeks, or sometimes even months, of prices slowly rising, then we get the sudden jump. This is to say that we are getting close.
Toncoin will continue in this pattern for days, can be weeks or even months; but at one point, there will be a major advance producing such amazing growth. Consider Bitcoin Cash on the daily timeframe for an example.
There is one more thing we need to do but I will leave this for a different publication. We need to consider the true all-time high potential.
As you might be aware, we've been looking together at "conservative" and "easy" targets for the next high and bullish wave, we are leaving this approach behind. Now it is wise for us to consider 'true' potential, 'optimistic' and 'real' targets, the highest possible, etc. So we are going to be looking at how far up Toncoin can go in the coming years and months.
Your support is highly appreciated.
The action now indicates that a major move is in the cards for this pair. If you want to catch one of those waves where you see +100% or +200% within weeks, you can sit on your TON tokens, this will be it.
It is going to happen but keep in mind that patience is key.
After you buy you hold, wait long and the market takes care of the rest. The wait is worth it when you consider the amazing profits and results that can be achieved. You deserve the best.
Keep going; keep in insisting; keep trying, keep learning, keep pushing, keep growing. We are going to achieve our goals. If you stay around long enough, the market will give you exactly what you want.
Money? peace of mind? More time to do the things you like?
Not having to leave your home to work? It is possible with Crypto.
Thanks a lot for your support.
Namaste.
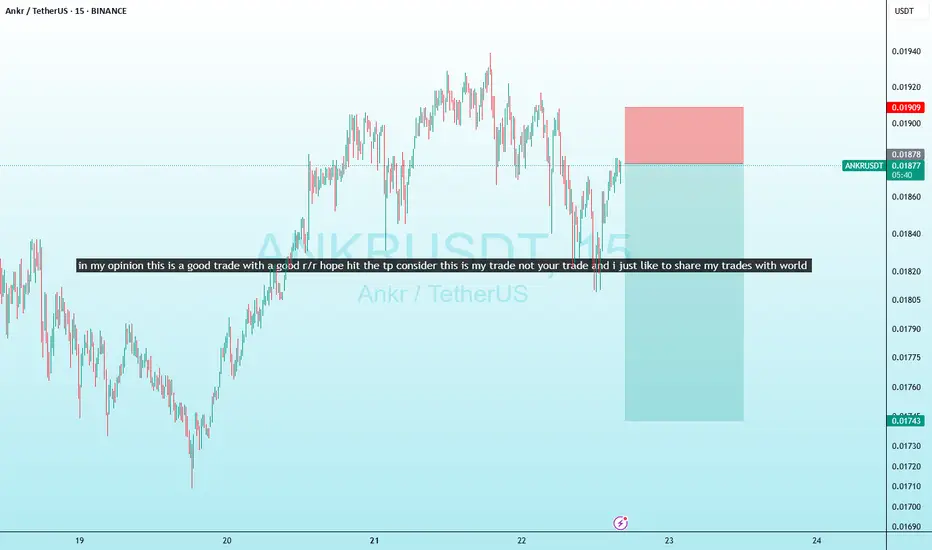
ankr short trade in my opinion this is a good trade with a good r/r hope hit the tp consider this is my trade not your trade and i just like to share my trades with world
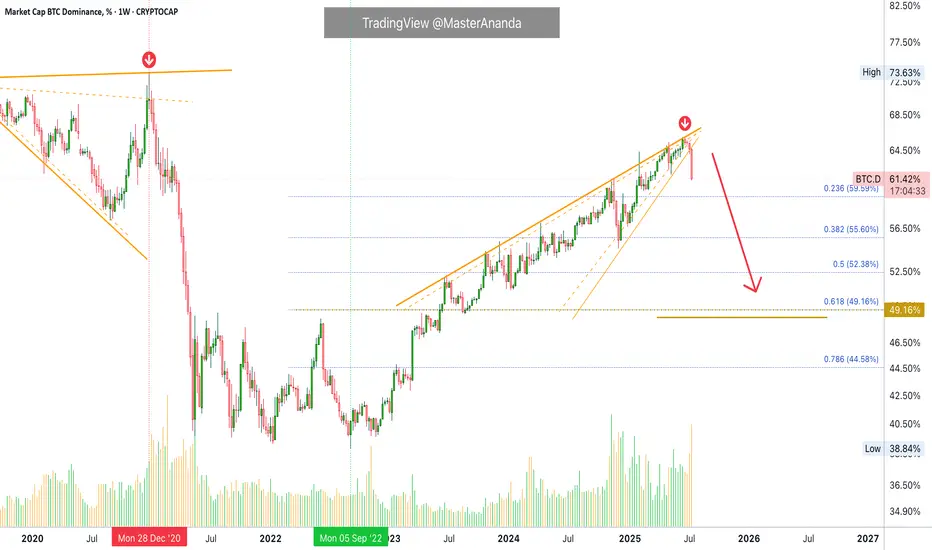
Bitcoin Dominance Weekly · Highest Bearish Volume in YearsThis week Bitcoin Dominance Index is producing the highest bearish volume session since February 2021. More than 4.5 years.
This week we have the strongest bearish action since June 2022. We can say that the altcoins market bull market is not only fully confirmed but already underway. We are already experiencing the best altcoin season since 2021 but it is still early, this is only the start.
Bitcoin Dominance is set to produce the strongest drop in many years and this only happens when the altcoins go ultra-bullish.
Bitcoin is moving sideways right now near resistance. As Bitcoin does this, the altcoins continue to move forward. This is classic bull market dynamics. When Bitcoin consolidates at a high price, the altcoins tend to explode. You can expect this pattern to continue to repeat for months to come. There is more good news though.
The fact that the altcoins are growing, perfect examples right now are Ethereum and Litecoin, is a bullish signal for Bitcoin.
It is not like the altcoins will grow and then Bitcoin will drop, no. Bitcoin consolidates and the altcoins grow, when Bitcoin stops consolidating it will move forward and hit a new major high, that is a price just around $134,000 and $136,000. When Bitcoin hits this price the altcoins continue to grow, back and forth. This is the most bullish the market has been since 2021. We will have to wait and see where this will all lead but new all-time highs are expected across all major projects and then some. Bitcoin is already in new all-time high territory but we need a new all-time high on Solana, Litecoin, Ethereum, Cardano, and so on. XRP is already at a new all-time high but it has much more to give.
If you visit @MasterAnanda, you will find up-to-date analyses for all these altcoins with new updated not conservative but realistic and good optimistic targets.
I will continue to share updates throughout the entire bull market. This is only the start. Get ready because the best is yet to come.
Namaste.
Ethereum to $8000On the monthly chart, Ethereum has reached major resistance at $3,800 again and, in my opinion, can break through this time. This is the final leg to $8,000 soon.

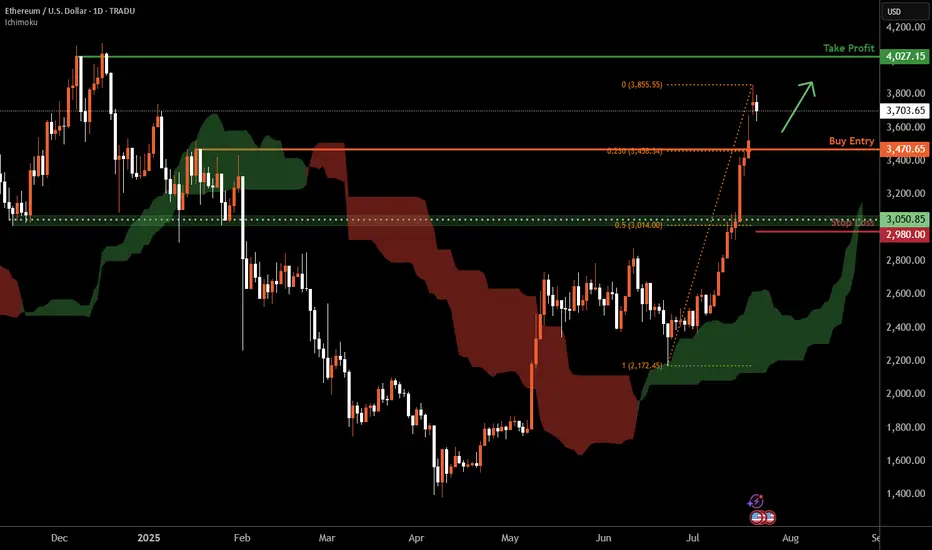
Ethereum D1 | Potential bullish bounceEthereum (ETH/USD) is falling towards a pullback support and could potentially bounce off this level to climb higher.
Buy entry is at 3,470.65 which is a pullback support that aligns with the 23.6% Fibonacci retracement.
Stop loss is at 2,980.00 which is a level that lies underneath a a pullback support and the 50% Fibonacci retracement.
Take profit is at 4,027.15 which is a multi-swing-high resistance.
High Risk Investment Warning
Trading Forex/CFDs on margin carries a high level of risk and may not be suitable for all investors. Leverage can work against you.
Stratos Markets Limited (tradu.com ):
CFDs are complex instruments and come with a high risk of losing money rapidly due to leverage. 66% of retail investor accounts lose money when trading CFDs with this provider. You should consider whether you understand how CFDs work and whether you can afford to take the high risk of losing your money.
Stratos Europe Ltd (tradu.com ):
CFDs are complex instruments and come with a high risk of losing money rapidly due to leverage. 66% of retail investor accounts lose money when trading CFDs with this provider. You should consider whether you understand how CFDs work and whether you can afford to take the high risk of losing your money.
Stratos Global LLC (tradu.com ):
Losses can exceed deposits.
Please be advised that the information presented on TradingView is provided to Tradu (‘Company’, ‘we’) by a third-party provider (‘TFA Global Pte Ltd’). Please be reminded that you are solely responsible for the trading decisions on your account. There is a very high degree of risk involved in trading. Any information and/or content is intended entirely for research, educational and informational purposes only and does not constitute investment or consultation advice or investment strategy. The information is not tailored to the investment needs of any specific person and therefore does not involve a consideration of any of the investment objectives, financial situation or needs of any viewer that may receive it. Kindly also note that past performance is not a reliable indicator of future results. Actual results may differ materially from those anticipated in forward-looking or past performance statements. We assume no liability as to the accuracy or completeness of any of the information and/or content provided herein and the Company cannot be held responsible for any omission, mistake nor for any loss or damage including without limitation to any loss of profit which may arise from reliance on any information supplied by TFA Global Pte Ltd.
The speaker(s) is neither an employee, agent nor representative of Tradu and is therefore acting independently. The opinions given are their own, constitute general market commentary, and do not constitute the opinion or advice of Tradu or any form of personal or investment advice. Tradu neither endorses nor guarantees offerings of third-party speakers, nor is Tradu responsible for the content, veracity or opinions of third-party speakers, presenters or participants.
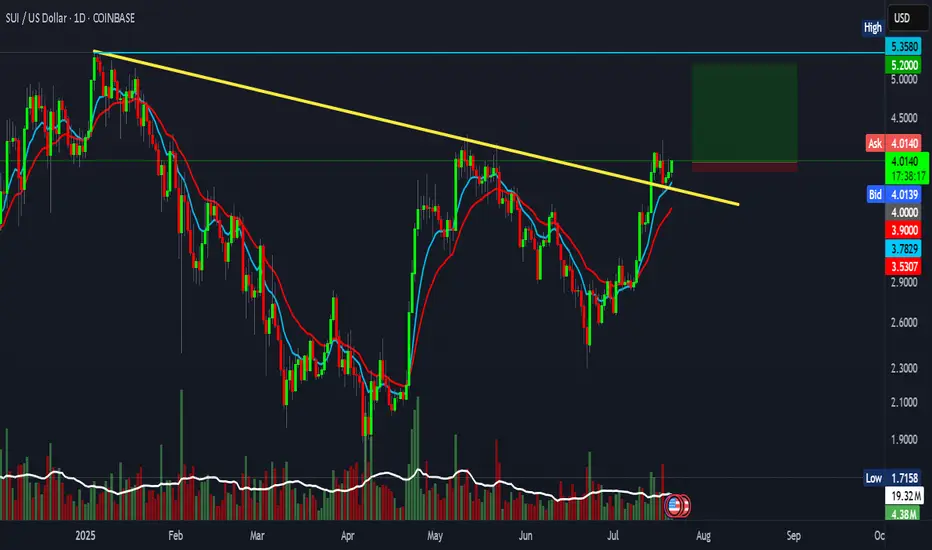
12R setup forming on SUITime to send it after that big channel retest? Clean 12R setup
Entry: 4.0
SL: 3.9
Target: 5.2
IMXUSDT – Major Breakout or Another Painful Trap Ahead?Yello Paradisers, is this the real start of a powerful bullish reversal on #IMX, or just another classic setup to liquidate impatient traders before the true move begins? The next few days will decide everything.
💎#IMXUSDT has broken out of a falling wedge, which is a typical bullish reversal structure, and is now retesting the strong demand zone between $0.45 and $0.49. As long as the price holds above this level, the bullish scenario remains intact, with $0.659 as the first key resistance to watch.
💎A clean break above $0.659 could open the way toward $0.734, while the critical resistance zone at $0.843 will be the ultimate test of whether IMX can shift into a sustained uptrend.
💎However, the invalidation level sits at $0.401. If this level fails, expect a fast move back toward $0.30, which will likely wipe out many traders who jumped in too early.
This is exactly where most retail traders get trapped. They either chase the move too late or panic-sell too early.
MyCryptoParadise
iFeel the success🌴

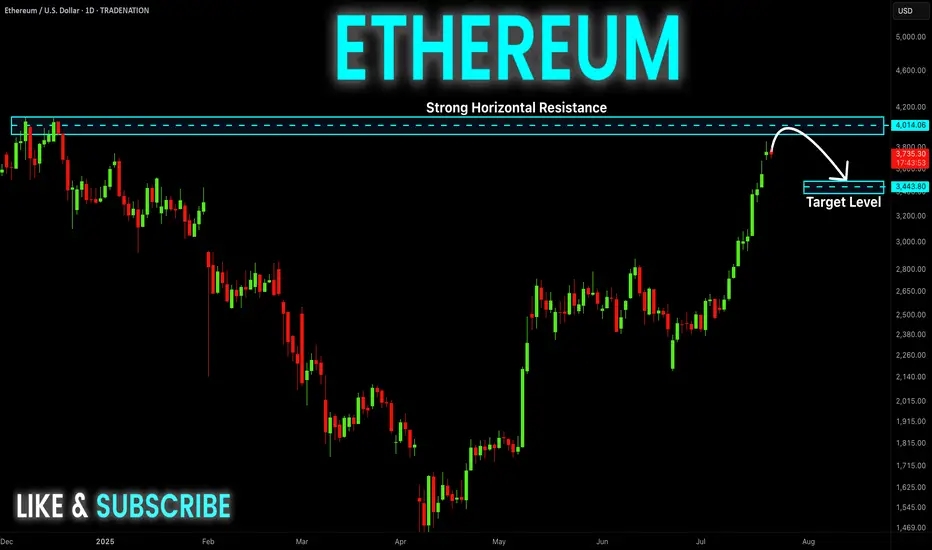
ETHEREUM Resistance Ahead! Sell!
Hello,Traders!
ETHEREUM is trading in a strong
Uptrend and the coin has grown
By more than 70% since the last low
So the coin is locally overbought
And after it retest the horizontal
Resistance of 4100$ we will be
Expecting a local bearish correction
Sell!
Comment and subscribe to help us grow!
Check out other forecasts below too!
Disclosure: I am part of Trade Nation's Influencer program and receive a monthly fee for using their TradingView charts in my analysis.
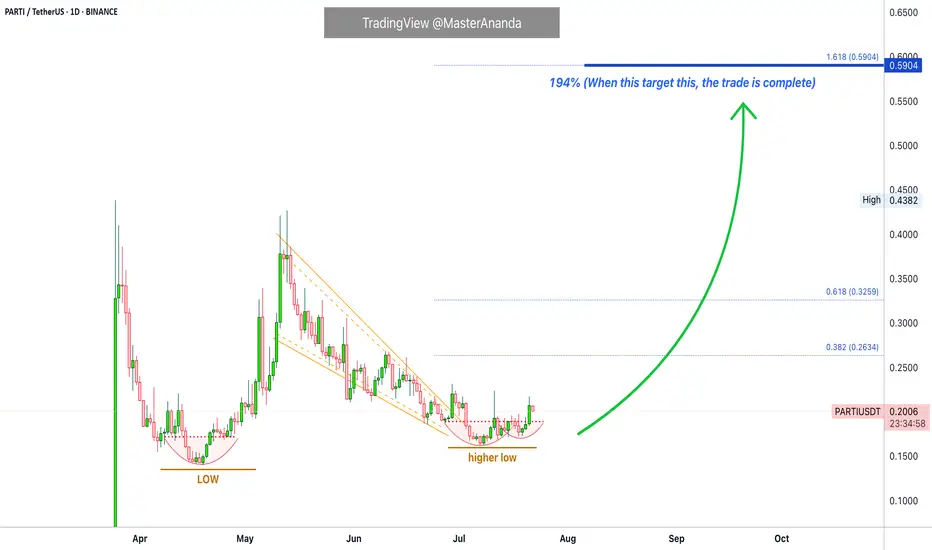
Particle Network Short-Term Trade Setup @194% Profits PotentialHere is the thing, the young charts we are using for the short-term trades, and this makes sense because we can't make much of a long-term prediction with no data ok?
Let's trade!
Basic and simple. I can't do it any other way so you will see me repeating the same. The truth is that simple works. If you can't explain something in a simple manner, it simple means you don't understand it well enough. Well, I understand this thing nicely because I will make it so simple for you, that you have to agree and even a three year old can say, "True, Master is right, I agree with his interpretation of the chart."
Low and higher low. Beautiful.
A bullish wave leads to a correction. The correction ends in a higher low. This confirms the bullish bias. The higher low is the place that will launch the next leg up. Minimum target is always the 1.618 Fib. extension. This is mapped on the chart as 194%, once it hits, the trade is closed and over. Take the profits and move on.
Thanks a lot for your continued support.
Thank you for reading.
Namaste.
Adventure Gold 679% Easy Target, High Profits & TA (8X Lev)I can translate all of the signals and all the chart data but the truth is that "bullish" because that is what the chart is screaming to me. The chart is saying "bullish" and my intuition is telling me that Adventure Gold (AGLD) is going to move next.
Notice I continue to pick the ones trading low near support. Those trading within the "opportunity buy zone" for our trades. When it comes to those already moving, I only give updates. When it comes to buying and trade-numbers, I choose the ones with low risk vs a high potential for reward.
AGLDUSDT has been closing green four weeks slowly rising, but prices remain very low. This is a bullish type of consolidation. It is a tricky signal because it might look weak but the truth is that this pattern tends to transform into a bullish explosion. The choice is yours.
I give you the chart, the translation, the basics, the training, the learning, the entertainment, the inspiration. I give you peace of mind and the right price. You have to take care of the rest. I can show you the door, but you have to cross it. You have to buy and hold, and be ready to sell when prices are at resistance or near resistance where I show in these charts.
We are a team. It is a huge sacrifice to be able to read the charts without losing focus, without going crazy due to all the distractions, all of the attacks and all of the stress. I have to develop a Buddha kind of meditative mind to be able to keep up and give you only the best. You know I can do it because I've been doing it, the results will speak for themselves, but is it not easy. I have to give my life for these charts and this market, but it is worth it if you take action and use this information to achieve your goals and financial success.
Thank you for reading. We are in this together.
I love you, truly. We've been together for so long, and this is only the start.
Namaste.

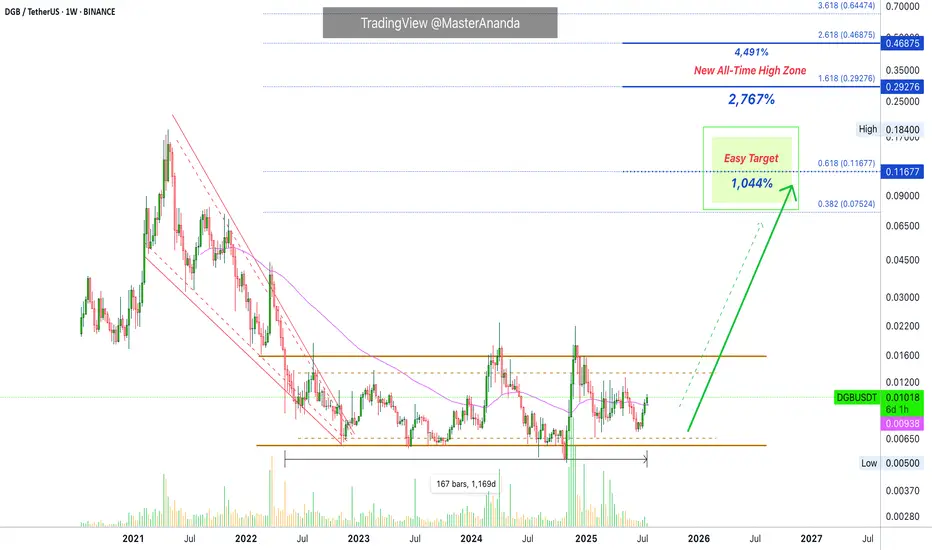
DigiByte Update · Optimistic New ATH · 1000%, 2800% & 4500%I will explain everything. The technical analysis, why I believe DigiByte can grow beyond 2,700%, and the overall Cryptocurrency market conditions.
Good evening my fellow Cryptocurrency trader, I hope you are having a wonderful day.
First, let me tell you that DigiByte (DGBUSDT) is fully bullish confirmed based on technical analysis. In simple terms, the action is happening above EMA55 weekly and we have higher lows since November 2024 and three weeks closing green.
Since there are now new lows in 2025, this clearly shows a lack of bearish trend. There is no bearish trend but neither a bullish trend, the market has been sideways. DigiByte has been sideways now for 1,169 days. And this is the reason why a new all-time high is possible in this year and bullish cycle. This is simply the strongest consolidation phase ever in the history of this market.
A 1,044% target at $0.116 is very easy indeed and should be hit without a question. But the fact that the market has been neutral for so long opens the doors for a massive bullish cycle and this is why we are aiming higher. Just as a new all-time lows can be hit within a bearish period, new all-time highs can be hit within a bullish cycle. Consider $0.29 or higher.
Just consider inflation, how much the world changed in the past four years. All the advances when it comes to regulations and acceptance towards this market. A new all-time high is only logical and easy to conceive. It is also supported by market sentiment, marketwide action and technical analysis.
DigiByte will not stay behind. It will surely perform just as you expect or even beyond. The Cryptocurrency market tends to surprise, it always go beyond our expectations.
Thanks a lot for your continued support.
Namaste.