Cronos 2025/26 New All-Time High Revealed · PP: 1,140%Cronos has all the classic signals ready, confirmed and combined. RCC. And this opens the doors for a major advance which will not be shown fully on this chart. That is because I am using the linear chart for perspective but the log chart is needed to see all the major targets. Just trust, it is going to move very high in this bullish cycle run.
Good afternoon my fellow Cryptocurrency trader, I hope you are having a wonderful day.
Didn't I told you that you would see so much growth, that you will become complacent at some point? We are not there yet, but we will get there and you will have new challenges to face. Believe it or not, taking profits, using your earnings, will be one of the hardest things to do but the only right choice. A win is only a win when you close when prices are up.
Just as you cannot incur a loss unless you sell when prices are down; you cannot secure a win unless you sell when prices are up. When a pair grows 1,000%, you should take profits, period. When a pair growths 500%, it is wise to secure, 10%, 20%, etc. A plan is needed to achieve maximum success.
How you approach the market will depend on your goals, your capital, your trading style, which projects are available to you in your home-country, and so on.
A long-term investor does not need to sell, can continue to buy, accumulate and hold for a decade or more. Can you see? Each strategy is dependent on the person behind it.
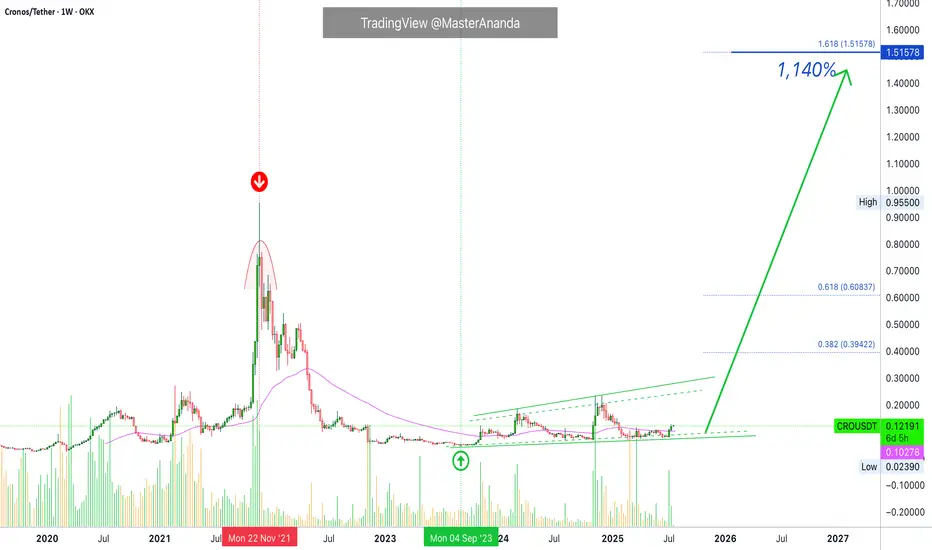
CROUSDT · Trading weekly above EMA55 while still near the bottom. The bottom is revealed when we compare current candles size and location to the 2021 high price.
Last but not least, notice how each time there is a strong increase in trading volume the weekly session ends up closing green. Bullish volume is dominating this chart. A long-term accumulation phase.
Without further ado, the next and easy all-time high target is $1.51 but it can go much higher. Total profits reaching 1,140%.
Thank you for reading.
Namaste.
Crypto
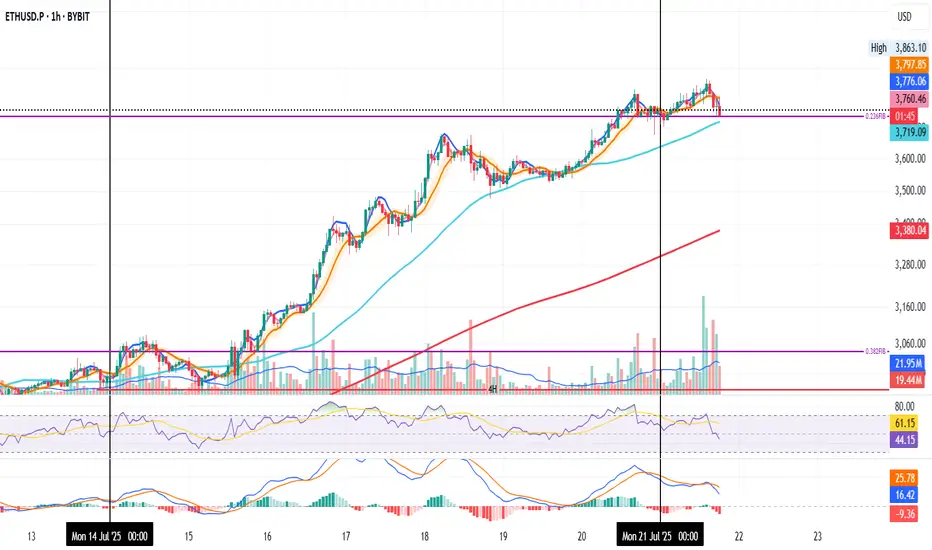
ETH on the 1H and the 0.236 Fib level
Could be a retest. Could be a fakeout. Could be the start of a move down.
RSI and MACD are both dropping.
SMA < MLR < BB Center confirms a downtrend.
50MA is sitting below the Fib level.
200MA is far below at $3,400, but rising quickly.
If tonight’s candles start closing under the Fib level, the warning gets louder.
If not, more upside remains likely.
Always take profits and manage risk.
Interaction is welcome.
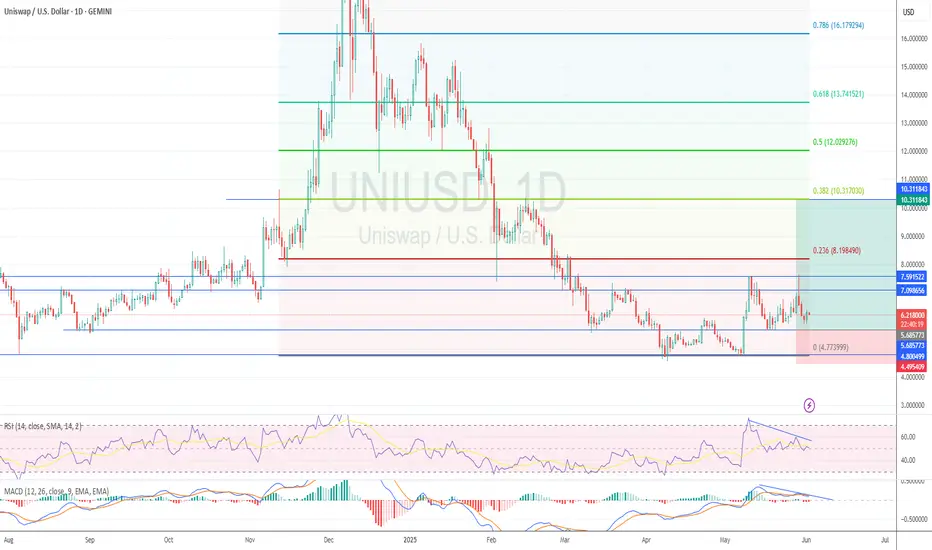
$UNI - $10 from here?Hi guys! 👋🏻
🔔I'll be trying this setup for Uniswap
🔔 We have bounced from the strong support at $4.80, which we retested in April 25 and May 7 forming a pattern impersonating a double bottom
🔔 With the current chart pattern and levels, I'll be expecting a jump with a target on $10.
🔔 Might drop to $5.70 before another move upwards.
✊🏻 Good luck with your trades! ✊🏻
If you like the idea hit the 👍🏻 button, follow me for more ideas.
BTC Update – Short-Term Pressure Building
Bitcoin is still being pushed down below the BB center.
RSI is trending lower, and MACD is nearing a bearish crossover.
PSAR is hovering close to price, a warning sign.
This could still be a pause before the next leg up — but don’t ignore the signs.
And just a thought: Trump Media buying $2B in BTC might’ve marked a local top.
Prepare in advance.
Always take profits and manage risk.
Interaction is welcome.

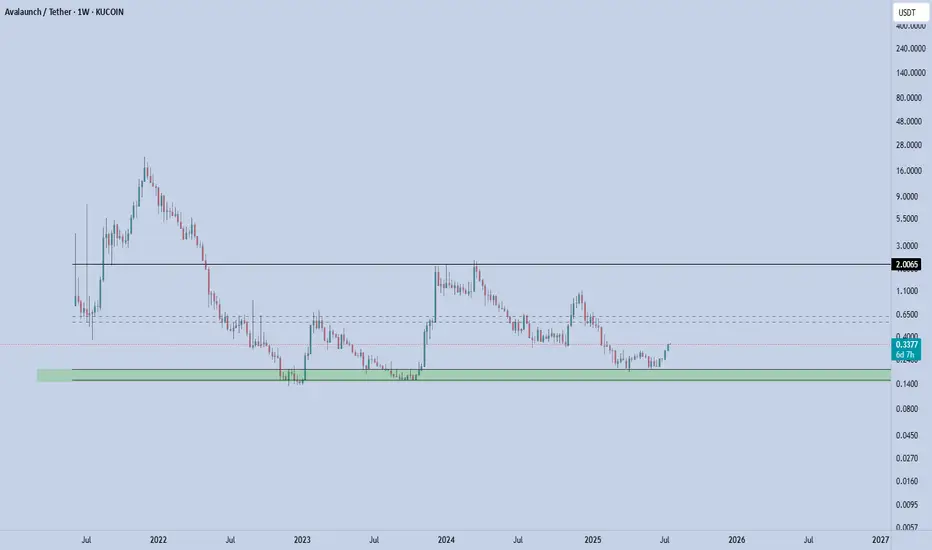
XAVA - Rebound in Play XAVA coin is currently stabilizing in a key support zone — the bottom of the defined channel, which has proven to be a strong and reliable support area. Price recently bounced from this level, confirming buyer interest.
From here, the next immediate target is the mid-range of the channel. If price manages to break above and hold the mid-channel, the next upside objective becomes the top of the channel.
Key Levels
Support (Channel Low): 0.15(invalidation below this level)
First Target (Mid-Channel): 0.56-0.62
Second Target (Channel High): 2
📌 Risk Management: A clean break below 0.15 invalidates this setup. As long as this level holds, the structure remains constructive and favors rotation toward higher levels within the channel.
luna long positionin my opinion this is a good trade with a good r/r
hope hit the tp
consider this is my trade not your trade and i just like to share my trades with world

UMA · $6.65 Easy Target · Much Higher Possible Late 2025 · 1220%$6.65 is actually a very easy and conservative target. We tend to cap profits potential when we approach the market using leverage. When doing spot, we get all the targets all the way to a new all-time high—price discovery—and beyond.
Here we have a very strong bullish chart setup. Consider this. When the action recovers above long-term support we know this to be bullish. I just mentioned this signal on APEUSDT.
UMAUSDT moved below not only August 2024 but also October 2023. It has recovered, it is trading back above both levels and this is truly as good as it gets. We can see a break above EMA55/89 (3D sessions) coupled with rising volume and very, very strong full green candle. This type of action reveals the start of a major bullish advance.
I think UMA can easily hit $10, $17 and $23. Somehow I am getting the feeling that $23 will not be the end of the bull market for this pair. Which means that it can go higher... We will have to wait and see of course. Growth potential is always unlimited. There is no limit to the upside. Anything can happen. We are open to see maximum growth in the coming months. The strongest bullish cycle in the history of Crypto.
Thanks a lot for your continued support.
Namaste.

Solana About To Gain Bullish Momentum Towards $420, Later $1000+It seems like Solana has been taking forever to grow, to recover; it seems like a long time. Let's do some maths. The bottom was in 7-April and we are now on July 21. 98 days. A little over three months. That is how long it has taken Solana to move back above $200. Seeing that the all-time high is $295, this isn't a long time, we are getting close to resistance and this resistance will break easily just as it happened with Bitcoin. Solana is set to grow to $420 mid-term and this bull market is likely to give us a target of $620 and potentially $1,000. $1,000 is the bright spot we want to hit on the bull run phase.
Why aim so high? Because the correction was really small in comparison to Solana's major bullish cycle since 2022. Solana crashed and crashed really hard but this hard-crash led to the strongest bullish cycle ever. Only in January 2025 did Solana stop too breathe and it did so by doing a 60% drop-market flush. With this drop over, Solana can produce the continuation of its long-term, eternal bullish cycle. Higher and higher, week after week, month after month.
If you are a Solana holder I just want to tell you to be patient on this pair. All the gains that have not been done in the past will be fulfilled in a matter of days. Solana will catch up with the rest of the giants and grow strong. Once Solana is up there at a new all-time high, the rest of the market will continue to grow.
Think of Solana behaving just like Bitcoin; when it reaches high up, instead of crashing we can experience some consolidation followed by additional growth. When we are close to the true cycle top, money will flow out of these big projects into the smaller ones, creating a major bull run.
All is good and perfect and it is early still today. Think about it, would it be late to buy below $200 when you know the potential is 1K?
Thanks a lot for your continued support.
Namaste.

Apecoin Technical Analysis · New All-Time High & Easy TargetsAs I told you just recently, the moving averages can be used in different ways. The main way is to gauge the market bearish or bullish potential and this is the classic way. The second one, less conventional, is to know how advanced is a trading pair within the current cycle.
Before everything was growing, we would confirm a pairs bullishness by looking at EMA55, EMA89, EMA144, MA200, etc. But now that we have a confirmed bullish bias, we can use these same moving averages to see how much room there is left for growth. For example, here APEUSDT is trading below EMA55 weekly. This is great news. This reveals to us that this pair is still early. As we know the entire market will move upwards based on the classic four years cycle—a bull market every four years, or the fact that a bull market happens the year after Bitcoin's halving—catching a pair before a major breakout can be life changing, profits can be huge.
But we still need some bullish signals though so let's look at those. Apecoin moved below its August 2024 market bottom. This is bearish. Once the action is happening back above this long-term support level the bullish bias is confirmed. Currently, APEUSDT is trading above its August 2024 low.
Another good and strong bullish signal is the classic rounded bottom pattern. On the 7-April low a rounded bottom pattern formed to produce a reversal. Notice how the trading volume is much lower on the last low compared to previous action. If the market was set to continue lower long-term, the lowest point would have high volume. Lower lows with decreasing volume signals that the bearish trend is losing force. This is already confirmed here because Apecoin produced a higher low in June and has been closing green several weeks.
Technical analysis coupled with marketwide action. Apecoin is set to grow strong long-term.
Thank you for reading. I hope you find this information to your liking. I hope you make tons of profits in this bull market cycle and fulfill all of your goals. You are appreciated.
Namaste.

Ethereum: Breakout Holds Strong | Next Targets $4K, $7K+Last week, three major crypto bills cleared the U.S. House of Representatives—and Ethereum (ETH) is emerging as the biggest winner from this legislative momentum.
ETH recently broke out of a rounding bottom pattern and hasn’t looked back. Momentum continues to build, and it’s now outperforming most other major assets.
📈 Technical Highlights:
✅ Short-term target: $4,000
✅ Long-term potential: $7,000–$8,000
🛡️ Key support: $2,700–$2,800 (bullish as long as this holds)
📣 Takeaway:
Ethereum’s breakout remains intact. Pullbacks into support could offer high-probability setups for swing traders and long-term investors.
#Ethereum #ETHUSD #Crypto #Trading #TechnicalAnalysis #CryptoTrading #EthereumPrice #Altcoins #Bullish #Breakout

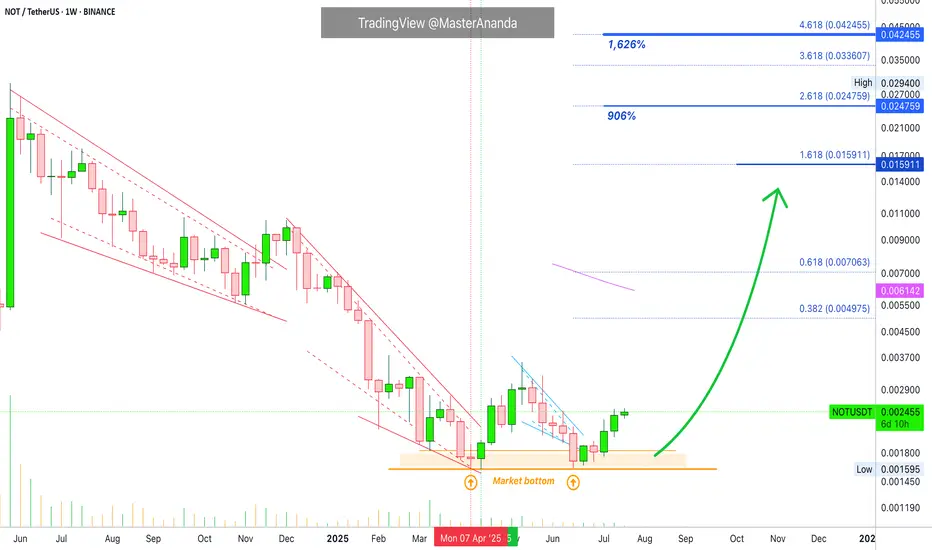
The Truth About Notcoin · Still Trading At Bottom PricesDid you miss Notcoin's bullish wave? No you didn't because it is still very early in this game. This is the beauty of the Cryptocurrency market, you can even wait for confirmation and still have access to countless opportunities.
I just showed you some charts for Cardano, XRP, Ethereum, Solana and others. What difference do you notice between those and Notcoin? Yes you guessed it right; the former are trading very high up while the latter is still trading at bottom prices.
Notcoin is still trading at "opportunity buy zone" prices because the action is happening below its May 2025 high. The trading is also happening below EMA55 and in this instance this means that it is super early. Early not bearish because we know the market is moving up based on Bitcoin Dominance Index (BTC.D), Bitcoin and the Altcoins. Everything already confirmed what we have been predicting for months.
So, NOTUSDT is set to produce a 20-30X strong bullish wave. The market is making this clear and is asking you, what will you do? How can your life change with this information that you have ahead of the masses?
While for you it might be the norm to know that "Crypto is going up," many, many people are still unaware, millions of people, and they will only join the market when prices are trading 500% to 600% up. After this we would still have the bull run.
Since you are reading this now, you have great timing and you are ahead in this game. But this opportunity buying zone won't be available for much longer, it will be gone in a matter of days. Some pairs will give us at least a few weeks to buy low, the rest of the market will start to move ahead and just several days from now, marketwide bullish action will be the norm.
You know the future in advance. Take action. Make it happen. You can change your life for the better. You can produce outstanding results.
You have what it takes to succeed in this game.
Plan ahead and you will be able to collect huge profits.
It is better to hold several projects long-term rather than switch around between pairs. Just a friendly advice.
Thank you for reading.
» Beginners should simply hold, watch and read.
» Experienced market participants should trade.
» Experts should be using leverage and pyramiding.
This is the opportunity we've been waiting for.
Namaste.
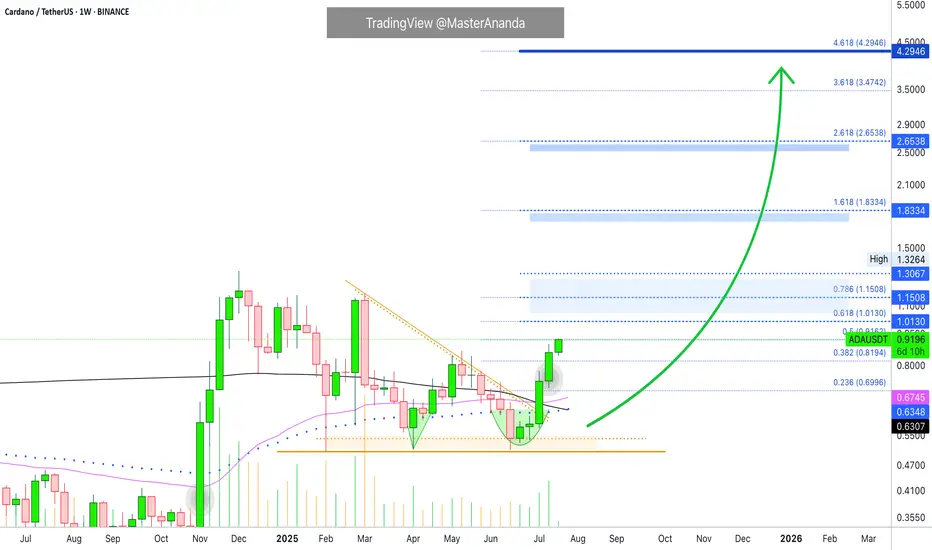
Cardano Update · Straight Up · New ATH & MoreCardano is easy to predict. We already have three great examples. Remember Bitcoin Cash? It has been growing straight up for 100+ days. Cardano will do the same. What about XRP? It is already trading at new all-time highs and Cardano is in the same group/category; big market capitalization. Then we have Ethereum which is the most recent example, as predicted, it is moving straight up. No retrace nor correction which is normal because it went sideways for months before the current bullish breakout.
Cardano has now four green weeks and this is the fifth one. This one will not be red which means straight up.
Technical analysis
I already told you about EMA55 and EMA89, weekly timeframe, ADA is trading above. MA200 as well. Notice the descending triangle on this chart. This was the consolidation period and it already broke bullish.
Targets & new all-time high
Expect ADA to continue growing until it hits the highest prices since 2021. $1.83 and beyond. Once this level is conquered, we can start rooting for a new all-time and this will happen with a high level of certainty.
Cardano will easily reach $3 and move beyond $4. I think it can go much higher...
I will do a new publication with updated new all-time high projections. The targets above are valid for the coming months.
Just a friendly update.
And thank you for your continued support.
(If you enjoyed this post, follow!)
Namaste.
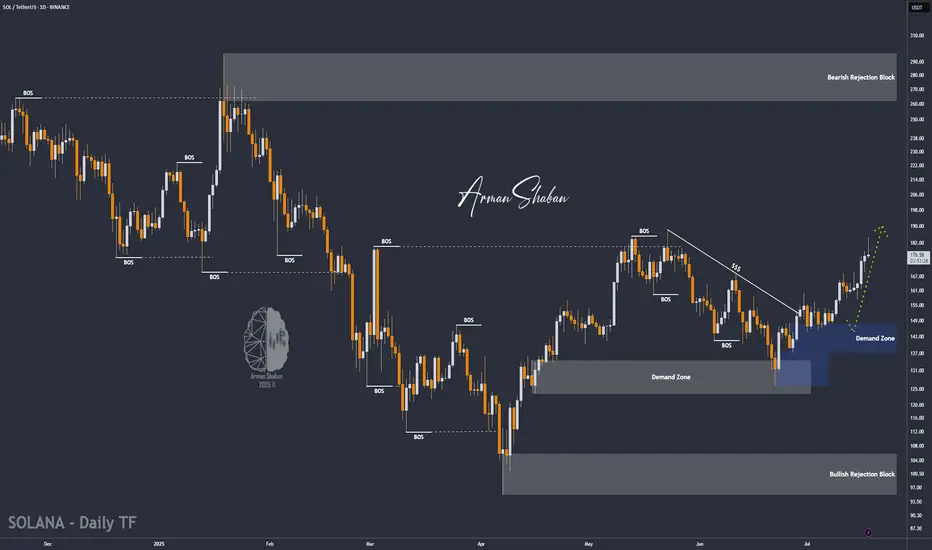
SOL/USDT | Next Bullish Leg Ahead if Key Support (READ)By analyzing the Solana chart on the daily timeframe, we can see that today the price climbed to $184, almost hitting the next target at $187, before facing a correction. It is currently trading around $176. If Solana manages to hold above the key support zone between $168 and $174, we can expect the next bullish leg to start, potentially extending up to $227. The previous analysis remains valid, with the next upside targets at $187, $220, and $263.
Please support me with your likes and comments to motivate me to share more analysis with you and share your opinion about the possible trend of this chart with me !
Best Regards , Arman Shaban
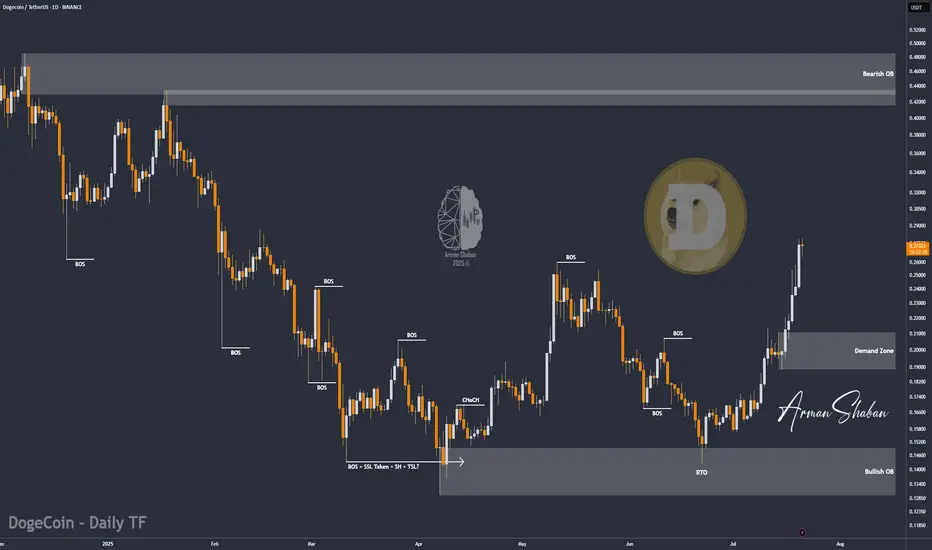
DOGE/USDT : eyes More Gains – Mid-Term Targets Up to $0.70! By analyzing the Dogecoin chart on the daily timeframe, we can see that since our last analysis around 7–8 months ago, the price started its rally from $0.10 and surged over 370% to reach $0.48. After that, it corrected back to around $0.13 and is currently trading near $0.27. If Dogecoin manages to hold above $0.25, we can expect further upside movement in the mid-term. The next targets are $0.287, $0.32, $0.41, and $0.70.
Please support me with your likes and comments to motivate me to share more analysis with you and share your opinion about the possible trend of this chart with me !
Best Regards , Arman Shaban
BTC/USDT LONG SET UP (BITCOIN)Entry Price 1: $118,000
Entry Price 2: $116,500
Stop Loss: $115,000
Take Profit 1: $121,000 (Close 25%)
Take Profit 2: $124,000 (Close 50%)
Take Profit 3: $127,000 (Close 75%)
Take Profit 4: $130,000 (Close 100%)

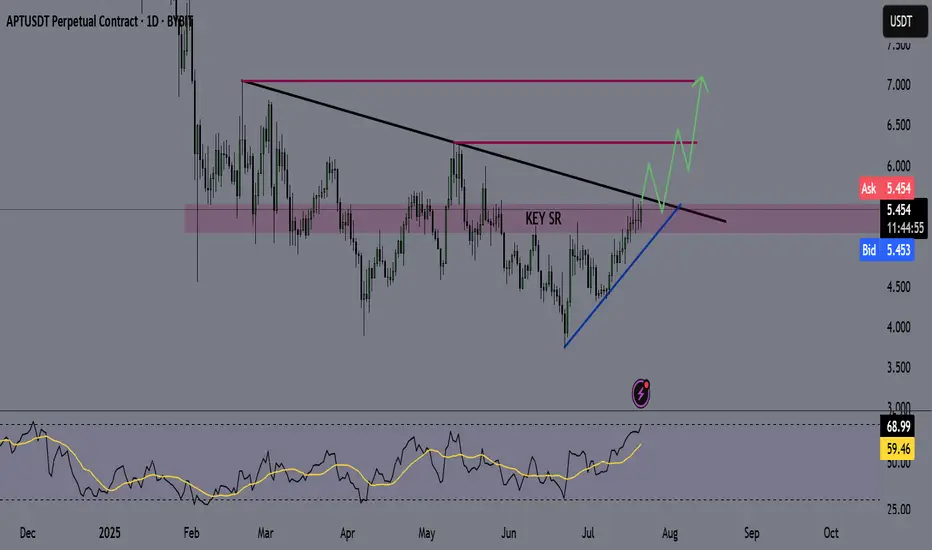
APT - APTOS Coin - Swing Long Idea📌 Fundamental Sentiment:
The entire crypto market is rallying, alongside other risk assets. This momentum is largely driven by U.S. policy expectations — specifically, Trump’s increasing pressure on Powell to resign and aggressively push for rate cuts from the Federal Reserve.
📌 Technical Analysis:
Price is currently testing the HTF supply zone with strong momentum. Additionally, it’s approaching a long-term bearish trendline that has dictated the downtrend since February 2025.
📌 Gameplan:
I want to see:
A clean breakout above the HTF supply zone with daily candle closure.
A confirmed break and close above the HTF bearish trendline on the daily timeframe.
If both confirmations align, I’ll start preparing for swing long setups, potentially riding into the early stages of a 2025 altseason.
—
🔔 Like & Follow for more daily updates. Feel free to drop your thoughts in the comments!
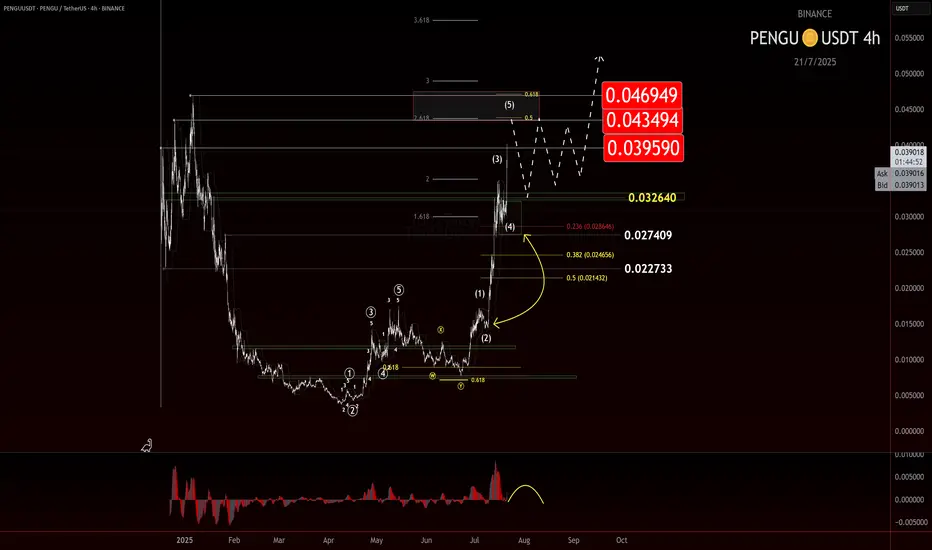
$PENGU: Taking Profit and Watching for a TurnIf you find this information inspiring/helpful, please consider a boost and follow! Any questions or comments, please leave a comment!
PENGU has made a strong move off the 0.007 level, now it just popped cleanly out of consolidation beneath the key LOI at 0.032. That break gave us the signal we needed for continuation, and so far, the price has followed through nicely.
But now, we’re approaching a zone where things could get a bit trickier.
This advance is starting to look like a classic wave 3 impulse, and while there’s no clear confirmation of a top yet, signs are beginning to flash caution. That means it’s time to start watching for potential topping behavior—especially if we move into a broader consolidation phase.
Here’s what’s on my radar:
• Wave 3 Exhaustion?
Still unconfirmed, but this could be the final leg of the wave 3 structure.
• AOI or Key Level Rejection
A stall or strong reaction near resistance could be a red flag. Channel parallel being reached.
• Bearish Divergence on the EWO
Momentum isn’t keeping pace with price. That’s often a precursor to a deeper pullback.
No need to force the next move here. This thing could just keep ripping up, but I am being extra cautious here. Not only to look for a potential top, but if a retrace is given, a potential long add to my current trade. Taking profit at these levels makes sense, especially given the early entry from 0.012 and my trade plan.
As always, trade what’s printed, not what’s hoped for. Stay nimble.
Trade Safe!
Trade Clarity!
21/07/25 Weekly OutlookLast weeks high: $123,220.24
Last weeks low: $115,718.15
Midpoint: $119,469.19
New BTC ($123,220) & SPX ($6,315) ATH last week! We're really seeing progress being made on all fronts now, bitcoin saw its sixth week of net inflows into BTC ETFs ($2.39B).
The week began strong hitting the new ATH very early and then settled into a tight range to cool off. Altcoins however surged in relation to BTC to break out of HTF downtrends and begin to make up lost ground. One of the beneficiary's of this price movement has been ETH, breaking out from a multi year downtrend against BTC and hitting $3,800 in its USD pair.
For this week I do expect much of the same for BTC as momentum is with altcoins for now. However, as those altcoins reach HTF resistance levels it becomes very important for Bitcoins chop to be accumulation for the next leg up and not distribution for the way down. With so few pullbacks the threat of a sudden correction is present but the probability drops should BTC look to press higher with strong demand.
The ECB Interest rate decision takes place on Thursday but no changes to the 2.15% rate is forecast. In terms of news there are no planned upsets that I can see.
Good luck this week everybody!

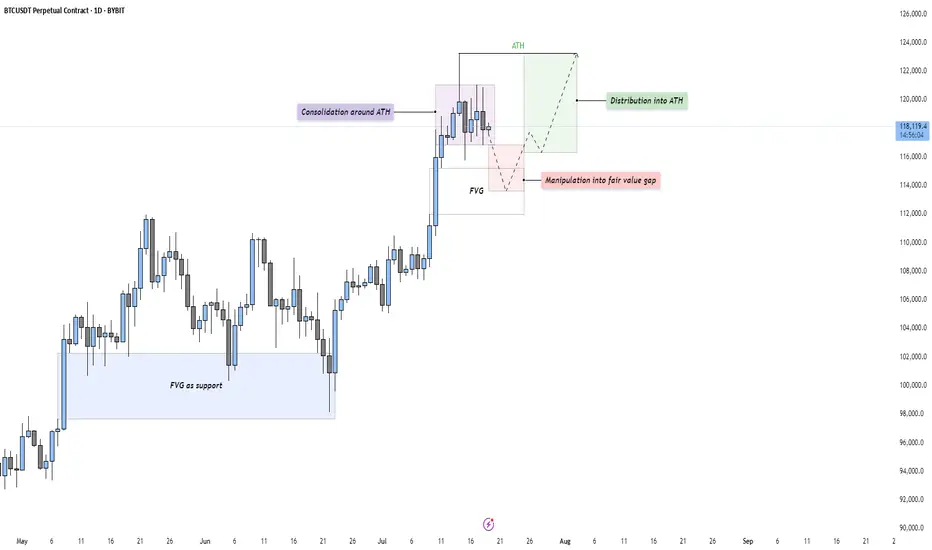
BTC - Consolidation, Manipulation & DistributionMarket Context
After a strong impulsive rally, Bitcoin is currently consolidating just beneath its All-Time High (ATH). This type of consolidation following an extended move higher often indicates indecision in the market — a pause that either leads to continuation or reversal. The current structure suggests that price is building energy for the next leg.
Consolidation and Liquidity Above ATH
The price action is tight and sideways around the ATH, which likely means liquidity is building above. Many stop-losses and breakout orders are sitting just overhead — classic conditions for a Buy Side Liquidity Sweep. This range may serve as a trap for early breakout traders, providing an opportunity for smart money to manipulate price lower before taking it higher.
Fair Value Gap Retest Scenario
Below the current range, we see a Daily Fair Value Gap that aligns with prior bullish imbalances. A move down into this Gap would represent a manipulation phase — shaking out weak longs before rebounding. The Gap also acts as a potential support level where buyers might be waiting. If price reaches into this zone and reacts strongly, it may offer a high-probability long setup.
Distribution or Reaccumulation?
While this could be interpreted as distribution beneath resistance, it’s equally valid to consider it a reaccumulation phase — a temporary markdown into demand before a fresh expansion. If the market dips into the Gap and quickly reclaims the range, it opens the door for a clean breakout above the ATH and continuation toward the 124,000–126,000 region.
Final Thoughts
Price rarely moves in a straight line. It pauses, retraces, and often tricks participants before making the real move. This type of consolidation presents opportunity — but also demands patience and clarity.
If you found this breakdown insightful, a like would be much appreciated! And I’d love to hear your thoughts in the comments — are we about to sweep down into demand, or is the rocket already on the launchpad?
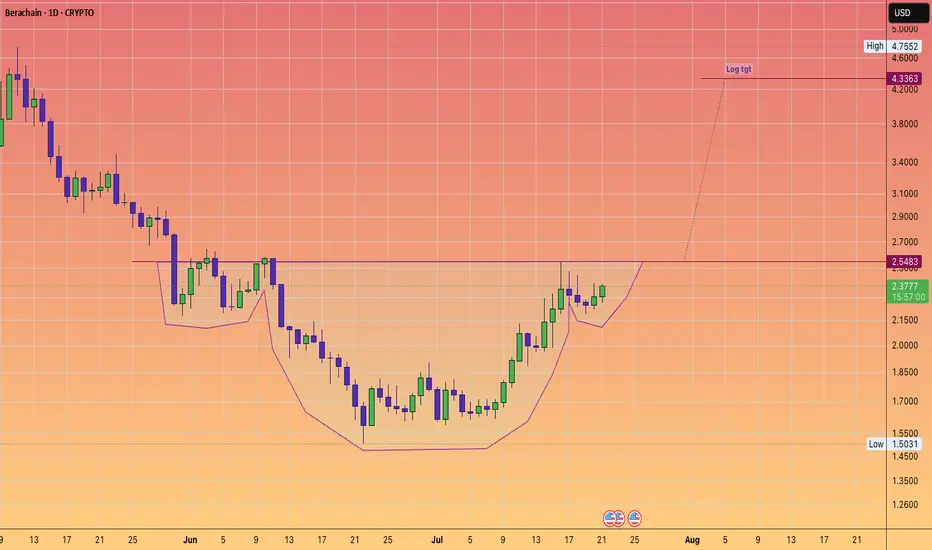
Berachain MOGGING the bears! Back to over $4#InverseHead&Shoulders
clean setup
log tgt provided.
sorry its altseason 100 things going on
no lengthy description needed :)
Digibyte $DGB Breakout watch. Bullish surge ahead?Digibyte appears to be reawakening, and a long accumulation phase appears to be ending.
If we scroll back to the beginning of the chart we can see the massive cup and handle and the subsequent moonshot to 5 cents.
I think 5 cents will also come back into play, in these coming weeks and months a healthy 5X.
As we know technically Digibyte is known for speed and decentralisation and UNDERvaluation.
Their much loyal supporter base deserve another moon mission.

Bitcoin monthly RSI CYCLEEvery time Bitcoin peaked in previous cycles, its monthly RSI exceeded 90. In this cycle, the RSI hasn't surpassed 75, but I expect a breakout through 75 to at least 86 in the coming months.

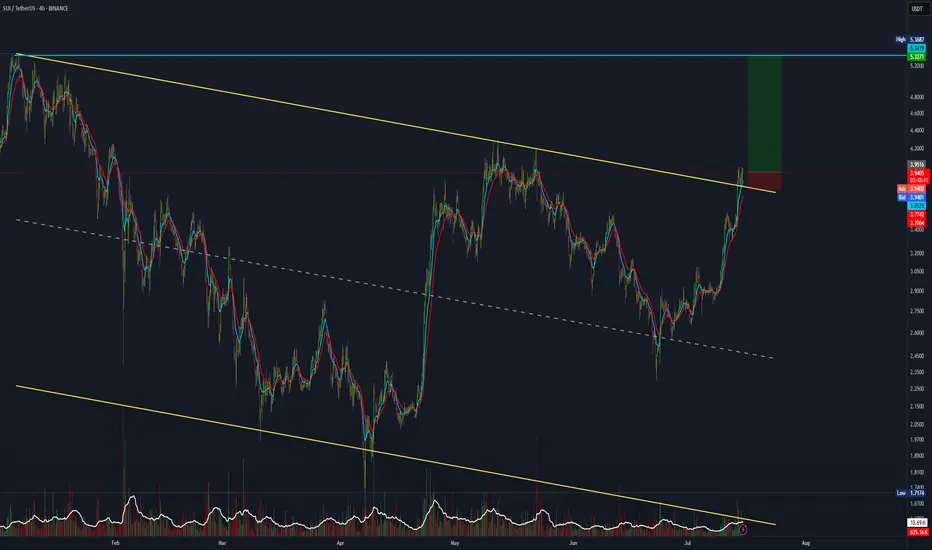
SUI trade setup with a 7:1 risk-to-reward ratio.SUI has broken out and retested the major channel. If you're bullish, this 7:1 R:R setup is worth considering.
Entry: 3.94
Stop Loss: 3.77
Target: 5.30.