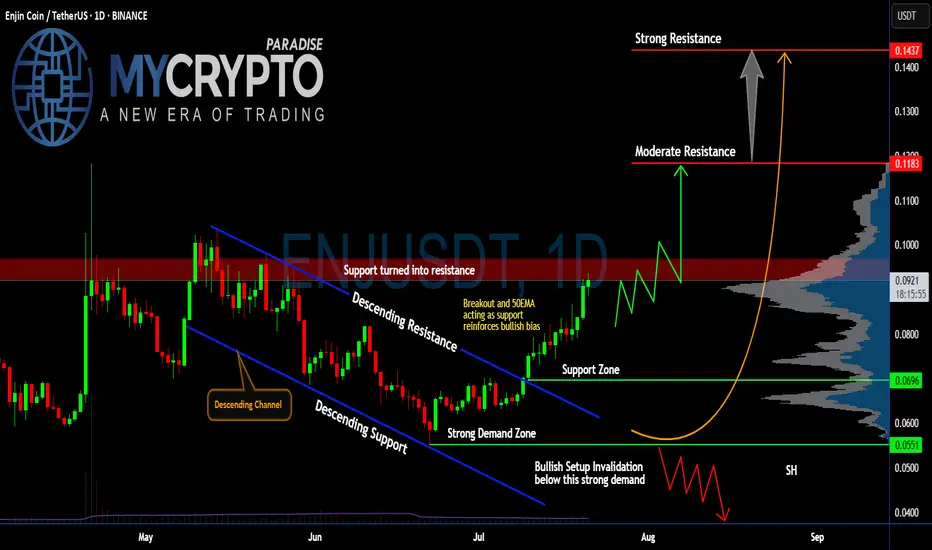
Will #ENJ Soar Further or a Trap is Set Ahead? Watch Closely Yello, Paradisers! Is this breakout on #ENJUSDT the start of a strong bullish reversal, or just another trap before a brutal flush to shake out late buyers? Let’s break it down:
💎After weeks of bleeding inside a clear descending channel, #EnjinCoin has finally broken out of the descending resistance, showing the first real bullish momentum in a while. Price is currently trading around $0.0917, with the 50EMA now acting as fresh support—this adds weight to the bullish bias for #ENJ.
💎If bulls can break above the resistance zone (previously support) between $0.091 and $0.096, we could see a push toward the moderate resistance at $0.1183. That’s the first major hurdle where sellers are expected to step in. A clean breakout above this level would open the door for a larger move toward the strong resistance at $0.1437, where a heavy supply zone sits, and profit-taking will likely accelerate.
💎The strong demand zone between $0.0551 and $0.0696 has been respected multiple times in the past, with aggressive buying every time price dipped into it. This is classic accumulation behavior, which often precedes stronger impulsive legs up—if volume keeps supporting this move.
💎But don’t get trapped, Paradisers. If the price breaks back below $0.0696 and especially loses the strong demand at $0.0551, the bullish setup for #ENJUSD will be invalidated. That would likely trigger a deeper correction, pushing us back toward $0.04. We’ll wait patiently for the next high-probability setup before taking any new positions.
Stay patient, Paradisers. Let the breakout confirm, and only then do we strike with conviction.
MyCryptoParadise
iFeel the success🌴
Crypto
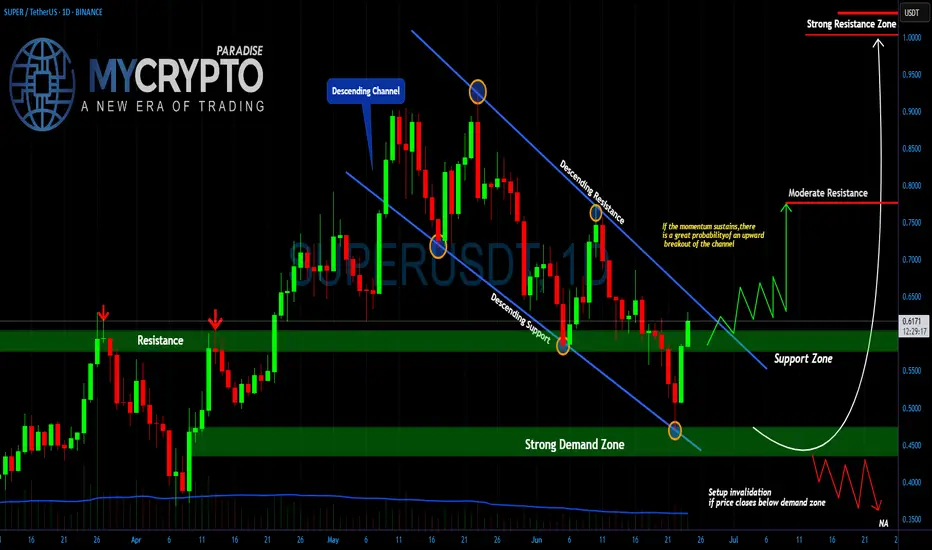
SUPER Breakout Incoming or Just Another Trap Before the Flush?Yello, Paradisers is SUPER about to explode out of this structure, or are we being lured into a fakeout before the next rug pull? This setup is too clean to ignore, and the next few candles will tell us everything.
💎The daily chart on #SUPERUSDT reveals a well-respected descending channel that has dictated price action for over two months. After multiple rejections from the upper boundary and rebounds off the lower trendline, the price has now shown its first serious signs of momentum since bottoming in the strong demand zone around $0.45–$0.50. This zone has held firmly, marking the third time price has bounced from this key level a textbook area of interest where buyers consistently step in.
💎What's notable here is the confluence between the demand zone and the descending support line. The most recent bounce was not only from this dual-support area, but also accompanied by a shift in momentum that has pushed the price back toward a critical inflection point the resistance-turned-support zone at $0.58–$0.62. This level has acted as resistance before and now becomes the level to reclaim for the bullish scenario to stay valid.
💎If the price breaks and closes above the upper boundary of the descending channel and holds above the $0.60–$0.62 region, the path opens toward the moderate resistance at $0.75. Should bullish momentum continue, we could be looking at a retest of the psychological and historical strong resistance zone near the $1.00 mark where we’d expect both aggressive profit-taking and liquidity to build up.
💎On the flip side, any failure to break out and sustain above the current resistance would likely send price back down to retest the demand zone. If the structure gives in and closes below $0.45 on the daily timeframe, this would invalidate the bullish thesis completely and could trigger a sharper drop toward $0.35 or even lower as the broader market liquidates over-leveraged longs.
MyCryptoParadise
iFeel the success🌴
OFFICIAL TRUMP Last Barrier · $30 or $100 Next · MixedThe last barrier is on now. The last barrier as in the last and final resistance level TRUMPUSDT (OFFICIAL TRUMP) needs to conquer before a major rise. Will this rise reach $30 or $100 or higher? Continue reading below.
Make sure to boost this publication and follow to show your support.
Hah! Resistance is confirmed as EMA89, what a drag. This is the blue dotted line on the chart but notice something else. Look at the magenta line, EMA55. TRUMPUSDT is trading above EMA55 but below EMA89. Bullish and bearish. Bearish and bullish. Mixed?
There is nothing mixed.
The main low happened 7-April. A higher low in 22-June. Can you see?
This is not mixed, this is bullish confirmed.
If the market were to move lower, then in 22-June we would have either a test of the 7-April low or a lower low. The fact that the drop stopped higher means that buyers were present. People were actually expecting for prices to drop and once they dropped they bought everything that was being sold. Prices couldn't move any lower because people were buying up. These are smart trader, smart money; experience for sure.
They managed to buy some tokens at a lower price within the "opportunity buy zone." This zone is available no more and now we have the mix of resistance and support; EMA89 and EMA55. What happens next?
Based on the previous signal I just showed you and marketwide action, Bitcoin super strong, we know that TRUMPUSDT will follow and break-up. Yes! Massive growth.
Both targets are good and will hit. Short-term, we will see a challenge of $30 and long-term we will see $100 and beyond.
Thanks a lot for your continued support.
Namaste.

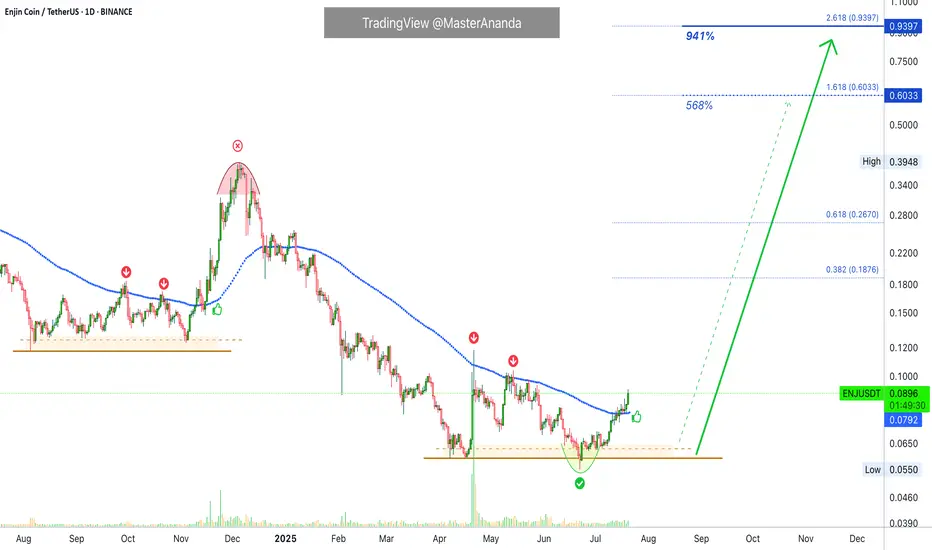
Enjin Coin Ready for a Truly Major Advance · PP: 941%Technical analysis is truly an exact perfect science, when mastered. If you master this tool you can use it successfully to make very strong and accurate predictions.
If you can make one prediction right, then the tool works.
If you can make several correct predictions, then the tool being valid is confirmed.
If some predictions fail, we have to assume our interpretation is wrong rather than the tool. If the tool is the one at fault, then all predictions would be either wrong or random. And since we can make thousands of highly accurate predictions, it means the tool works.
Back in late 2024 ENJUSDT was rejected twice at EMA89 resistance. As soon as it broke above this level it produced a strong advance. This wasn't enough and the market moved lower. As it reached a major low point in April and June 2025, the same conditions showed up.
ENJUSDT was rejected twice below EMA89 as resistance, notice the red arrows on the chart. Currently, Enjin Coin managed to conquer EMA89 and this is bullish. Looking at past history and knowing what we know about EMAs, this means that the doors are open for a strong bullish wave.
Enjin is set to produce a major advance and this is already confirmed. Just like late 2024 but much stronger, prices will go much higher because we are in the year of the bull market, post Bitcoin halving, every four years. Marketwide growth is happening and will only increase. This pattern has never been broken, it is already happening, it is confirmed and guaranteed.
Namaste.
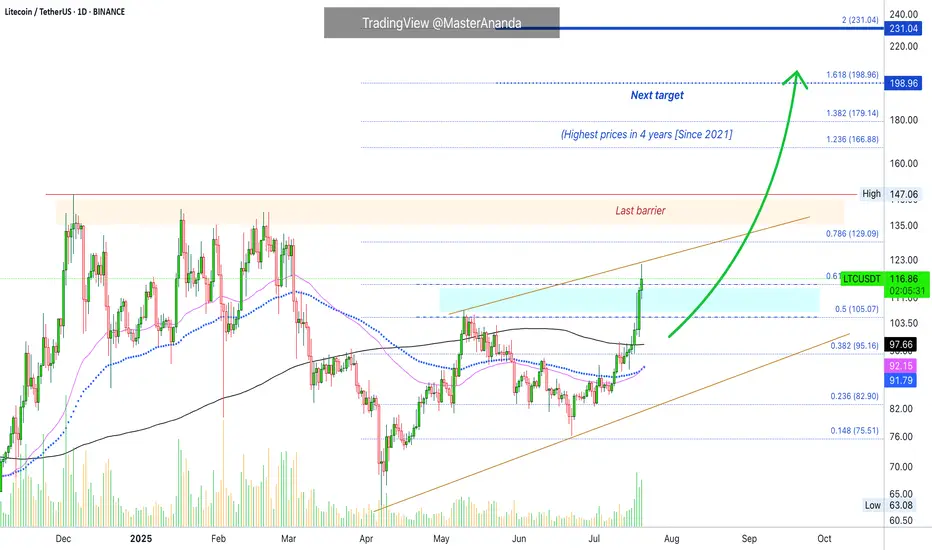
Litecoin's Path Beyond $200 Revealed · Daily TimeframeWe looked at Litecoin on the weekly timeframe which is the long-term picture, but we also need to consider the daily to see what is happening up-close.
As soon as we open this chart we have three signals that stand out:
1) Litecoin is now trading above MA200 safely and rising. This is a very strong bullish development and supports additional growth.
2) Trading volume has been rising significantly being now the highest since February 2025. The difference is that in February we were in distribution, resistance being confirmed with prices set to move lower. In this case, the action is rising from support and volume is rising rather than dropping.
3) May's peak has been broken. Many pairs are still trading below their high in May. Those that broke this level are the ones moving first and this signal exudes strength. Litecoin is now one of the top performers specially in the group with a big market capitalization.
The next barrier is the December 2024 high at $147. Short-term the next target is $129. As soon as the former breaks, we are going to be looking at the highest price since 2021.
Litecoin is fighting resistance today, 0.618 Fib. extension at $115. It is trading above this level but the confirmation only happens at the daily close. If it closes above, bullish confirmed. It if closes below, it means that there will need to be some struggling before higher prices. This struggling can last a few days just as it can extend. Seeing Ethereum and how it is moving straight up, Litecoin is likely to do the same.
Overall, conditions are good for Litecoin on the daily timeframe.
Thank you for reading.
Namaste.
BTC Weekly Recap & Outlook 20/07/2025📈 BTC Weekly Recap & Outlook
Market Context:
Price continued its bullish momentum, fueled by institutional demand and supportive U.S. policy outlook.
We captured solid profits by following the game plan I shared earlier (see linked chart below).
🔍 Technical Analysis
✅ BTC made a strong bullish move, breaking into new all-time highs.
📊 The daily RSI entered overbought territory, which signaled the potential for a short-term retracement or consolidation.
Currently, price is ranging, and RSI is cooling off. That tells me the market is likely building energy for the next leg up — but not before a significant liquidity run.
🎯 Game Plan
I'm watching for one of two potential setups:
1️⃣ Liquidity Sweep to the Downside
- A run of the daily swing low
- Into the most discounted range (0.75 Fib zone)
OR
2️⃣ Tap into the Weekly FVG Zone (marked with the purple line)
Either move would create the liquidity and energy needed to fuel a breakout above the equal highs (EQHs) marked by the black line.
🚀 Target
First Target: EQHs (Black Line)
Second Target: Price Discovery (new ATHs)
💬 Let me know your thoughts or drop your own chart ideas below!
📌 Follow for Weekly Recaps & Game Plans
If you found this useful, make sure to follow for weekly BTC updates, market outlooks, and detailed trade plans based on structure and liquidity.

ETH 1H – Breakout or Bull Trap ?
ETH just broke above the 0.236 Fib with a strong push.
✅ Trend structure remains bullish:
MLR > SMA > BB Center.
But something feels off...
🔍 Volume surged late — likely short liquidations.
OBV didn’t confirm — it's still lagging.
RSI is extended. Structure looks tired.
Could be a liquidity grab above recent highs.
If price closes back below the Fib, momentum could fade fast.
📌 Key zones to watch on a pullback:
– 1H 50MA
– Previous support clusters
We’ll be here to watch it unfold.
Always take profits and manage risk.
Interaction is welcome.

Ontology Back Above Final Bottom · Crypto, The Future of MoneyOntology is now trading back above long-term support. Long-term support was established by multiple lows in 2022, 2023 and 2024. In 2025, ONTUSDT broke briefly below this level. This drop ends up being a "stop-loss hunt event." Once the action recovers above long-term support, the market is confirmed ultra-bullish and ready to grow long-term.
Long-term growth is what you see projected on the chart with targets at 1,000% and even beyond 2,000%. Can be higher of course.
A massive rally is expected because of the prolonged consolidation period. The longer the accumulation phase, the stronger the bull market that follows.
If the market was set to enter a new bearish cycle, instead of a recovery above long-term support we would get a rejection and this rejection would lead to lower lows. Instead, ONTUSDT moved below just to recover. This recovery is all we need to go all-in.
Notice we have two full green candles and we are about to close this week. This is the start of very strong, major bullish action.
Good afternoon my fellow Cryptocurrency trader, how are you feeling in this wonderful day?
The altcoins market continues to heat up but as can be seen from this chart, you've seen nothing yet. Yes, some pairs are really advanced and this is only good because we know the rest of the market will follow.
The sequence goes like this: First Bitcoin moves. Then Bitcoin remains high, strong trading near resistance. This signal is taken by the top 25 altcoins and they start to move forward as well. When the top altcoins move forward and remain strong, the medium sized capital projects then start to grow. Finally, the small size and the rest of the market moves forward.
The previous bear market was brutal.
The last consolidation period is the largest and longest ever.
Fundamental conditions continue to improve.
While Cryptocurrency was considered a crazy innovation, technological porn, things are different now. We have laws and regulations coming out in all the major nations of the world supporting the adoption and development of Crypto. Humanity continues to adapt, grow and evolve.
With a new regulatory framework now in place, it is only a matter of time before Crypto takes over the world. We don't use cash anymore... We use electronic transfers and credit cards; these are also coming to an end.
We will say next: We don't use card anymore, we simply make transfers using our computers and phones. It is more efficient, it is easier and we already have a cell phone so we don't need to hold a card or a bunch of paper to buy stuff.
Crypto is free. Crypto is new. Crypto is accessible. Crypto is young... Oh, and it has amazing room still left available for growth. We can become rich through Crypto.
Thanks a lot for your continued support.
Namaste.

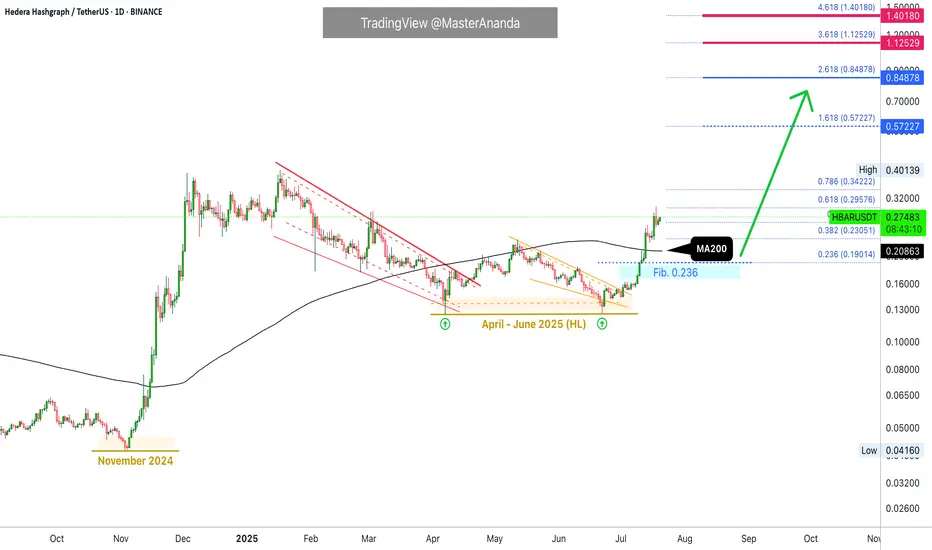
Hedera Update · Keep Holding · No Selling, YetHedera (HBAR) looks awesome. The action and chart right now is one of the best in the market. I love the fact that the candles are moving straight up. This can be equated to how FUN Token (FUN) has been performing in the past month. What one does, the rest follows.
The most interesting signal comes from MA200. Trading is happening above this level and that's all we need to know. When HBARUSDT broke above it, any bullish potential and bullish signals become fully confirmed. It is not a question of "if" anymore but instead a done deal. Growth is expected to happen for a period ranging between 3-6 months once this signal shows up.
This means you can see a strong retrace in a month and still, you remain calm and hold because you know higher prices are still possible. This means that if you see a correction after three months, you can take profits of course but still know that the top is not in. It will take a while before the entire bullish process is complete.
The top is not only calculated based on time duration but also on price levels and marketwide action. Depending on how the rest of the market is doing; looking at Bitcoin and at what price the pair in question is trading can help us confirm if the top is in. For now you just keep on holding.
Each chart/project/pair needs to be considered individually. If your technical analysis ability is lacking, you can always contact me and I will publish an update for you. If you publish news articles, videos, trade-signals or even TA, you can come to me for confirmation, ideas or just inspiration and I will take care of the rest. Once you have your update you can decide what actions to take. It is still early in this game.
The initial portion of the bull market is long gone. Here it started in November 2024, you can see it as the "market bottom." We are on the second portion now in 2025. The year started with a correction and the correction ended in April-June with a very strong higher low. Projects like this one reveal super-strength compared to the rest of the market, it happens with the top 100.
If you consider some of the smaller projects I've been sharing, you see double-bottoms compared to 2024, 2023 and even 2022 and even new all-time lows. Here the low in 2025 is far away from November 2024 and this is good news. That is why I say that each chart/pair needs to be considered individually because conditions are not the same for each project. The market has now thousands of good projects and tens of thousands of trading pairs. It is impossible to say how one will move based on the other because they are just too many and too far away.
The bigger picture and the general bias, yes, bullish all across. Exact resistance and support levels, where to sell, where to buy; should I continue to hold? This is what needs to be considered individually.
Your support is appreciated.
If you enjoyed, please follow.
Namaste.
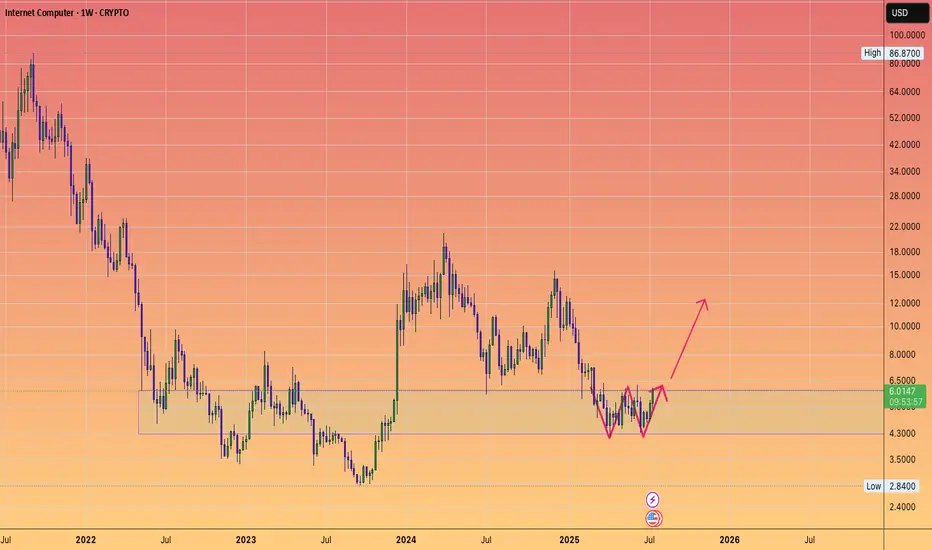
ICP still in the reload support zone....W pattern.
I like it down here.
Low risk accumulation block given the backdrop of #altseason going on.
Enjoy.
;)
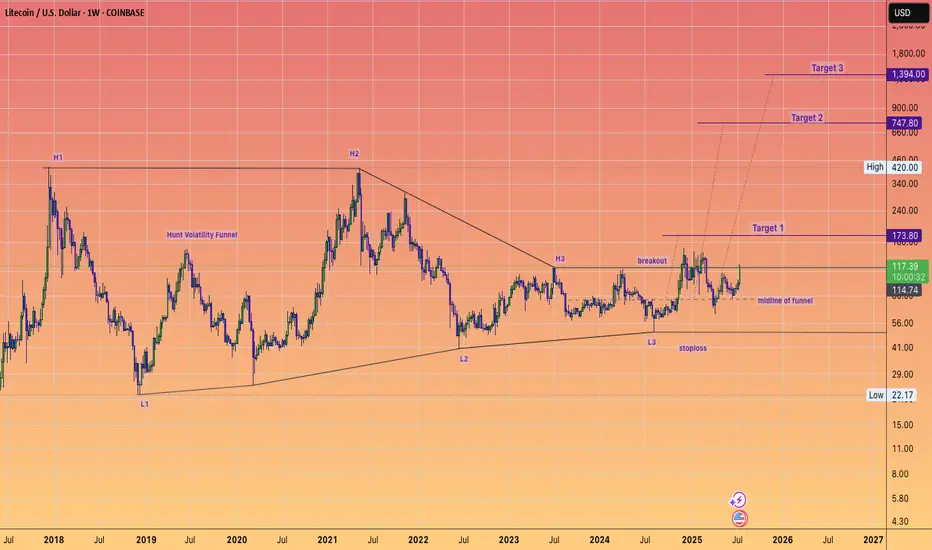
Litecoin has maintained it's HVF and can STILL do a 10X...in the coming years.
This is a massive pattern formed over 7 years and I expect over performance of target 3 ultimately.
The day to week price action really does not matter when you have beautiful setups like this.
Keep stacking at these low prices.
@TheCryptoSniper
ETH roadmap to 5000!Ethereum Wave 3 in Play? Eyes on the $4500 Target
Ethereum may currently be progressing through a wave 3, which is often the strongest leg of an impulse. The structure so far supports that idea, and based on standard projections, the most likely target sits near $4500.
If price can break and hold above the 4k level, we could see a consolidation forming above the previous high. That would be a constructive sign and might set up the next leg higher.
But there’s still a chance ETH struggles to clear that level. If that happens, consolidation could form just underneath, which would still be acceptable within a wave 3 framework. What matters next is the shape and depth of the pullback.
Wave 4 will be the key. A shallow or sideways correction would keep bullish momentum intact. A deeper pullback doesn't ruin the structure, but it does mean we’ll need to watch support zones more closely.
If wave 4 behaves well and broader market conditions stay supportive, then a final wave 5 could bring ETH into the $5000 region. That’s the upper edge of this current roadmap, based on conservative assumptions.
Stay flexible. Let the structure guide the bias.

3 Wins to Glory.You guys know my long term Targets for ETH.
What I wanted to highlight is the angle of the Banana zone has been remarkably consistent on the Log chart.
Granted we only have 2 - 2.5 data points
But note how even in 2025 the run is adhering to the approx 60 degree angle of attack, after breaking out of their respective W's.
something to monitor.

Time to Peel Some Gains — BananaUSDT Ripening at the Midline
📈 Technical Overview:
BananaUSDT is currently testing the midline of the descending channel. A confirmed breakout above this level could trigger a bullish move toward the top of the channel, which aligns with our secondary target. Until the breakout is validated, the price may continue to range within the current structure.
🔸 Watchlist Status:
Setup is not confirmed yet — keep this on your watchlist and wait for a clear breakout above the midline.
📍 Next resistance: Top of the channel
📍 Invalidation: Rejection at midline or breakdown below recent support
📉 Risk Management:
Enter only after confirmation, and risk no more than 1% of your capital. Always define your stop-loss.

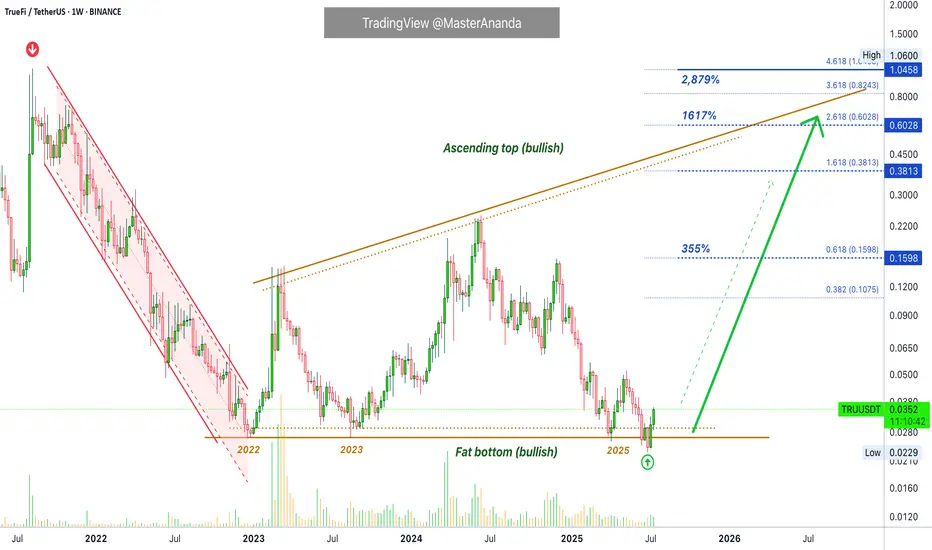
TrueFi · Bitcoin vs the Altcoins · Low Risk vs High RewardsTrueFi is trading at bottom prices. Notice the big difference between this pair and the ones that are trading high, near resistance or at a new all-time high. This is the difference I want to point out to new buyers.
If you are entering the market just now, you should be considering pairs like this one rather than the ones that are already pretty advanced. This is because the ones trading low/near support have more room available for growth, higher profits potential and very little risk. When prices are trading near the bottom, there isn't much room to go lower. When prices are trading high, even with marketwide bullish action, a correction can develop anytime.
We look for pairs like this one to buy and hold.
The second consideration is related to growth potential. While Bitcoin is awesome; Bitcoin is crypto; Bitcoin is great and is here to stay, it is already worth trillions of dollars. If everything goes amazing for Bitcoin, we might enjoy an additional 100% growth before the cycle ends. On an altcoin, in comparison, we can enjoy 1,000%, 2,000%, 3,000%, 5,000% or more. So you need to choose wisely.
A whale can easily choose Bitcoin because of liquidity issues, accessibility, security, stability, accounting, long-term performance, etc. A tiny fish is better off with the altcoins market, they have more room for growth.
Technical analysis
The red channel reveals a downtrend, the previous bear-market. The flat bottom in the following years reveals a consolidation period, long-term. Not a downtrend but creating a base. From the bottom we grow.
TRUUSDT is no longer bearish, moving down, instead it accumulated for years and now that this accumulation phase is over we are ready for massive growth.
We witnessed first a downtrend, then sideways (consolidation) and now comes an uptrend. These are the only three ways in which the market can move. Down—neutral—up.
The logical next step after a downtrend is always a sort of transition period, after this transition the uptrend starts.
We will have an uptrend now, this is what we call a "bull market." Higher highs and higher lows."
If you enjoy the content, you can always follow for more. It is easy and free and you get to receive updates every time I publish a new article.
Thanks a lot for your continued support.
Namaste.
$SHIB Ready to Move?CRYPTOCAP:SHIB has printed confirmed weekly bullish divergence in RSI and is now attempting to overcome the weekly 200EMA resistance.
A High Volume Node lies just above but a close above this will signal a bullish trend ready to move the initial target of the weekly pivot point followed by the 0.0003579 High Volume Node.
Price completed its retracement to the 'alt-coin' golden pocket 0.786 Fibonacci retracement.
Bearish divergence is currently growing on the weekly RSI but will be diverted with a thrust high!
Is it MEME season? CRYPTOCAP:DOGE also looks ready to go!
Safe trading

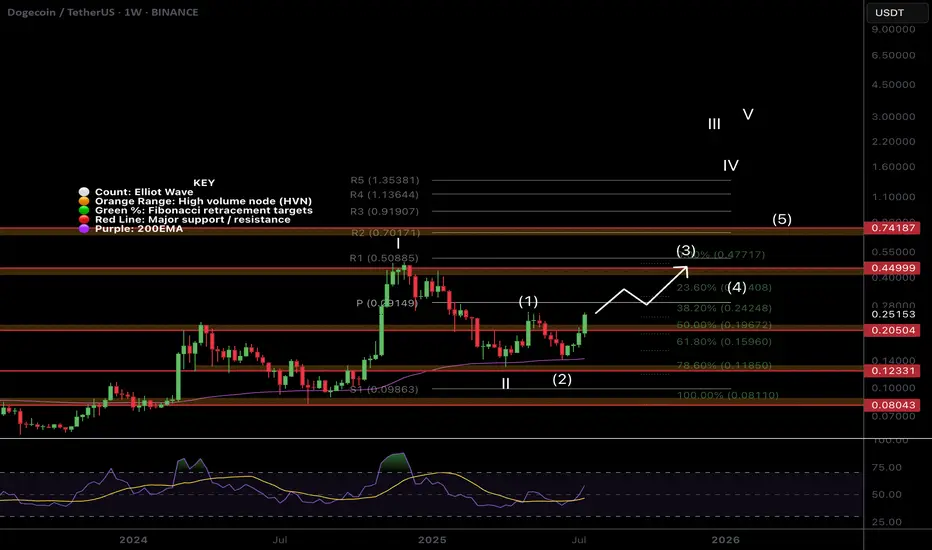
$DOGE Flipping to Bullish Structure!CRYPTOCAP:DOGE is coming to life after a second test of the weekly 200EMA as support and about to make a higher high, cementing in that higher low and flipping the macro structure bullish!
If the count is correct wave 3 of (III) should be powerful! The weekly pivot should put up a challenge as the first resistance before the High Volume Node at $0.45
Safe Trading
BITCOIN - Price can bounce up from support line to $125000Hi guys, this is my overview for BTCUSD, feel free to check it and write your feedback in comments👊
For a long time, the price was trading sideways inside a wide flat range between the $99000 support area and the $112000 resistance level.
After accumulating volume, bitcoin made a strong upward impulse and performed a breakout, pushing above the top of the flat.
Following this movement, the price action began to form a rising wedge pattern, moving between its clear support and resistance lines.
Recently, price tested the resistance line of the wedge and then started a predictable correction back down towards support.
Now, BTC is approaching the support line of the wedge, which aligns with the important horizontal support area around $112000-$113500.
I expect that the price can test this support line and then bounce up to the $125000 resistance line of the wedge.
If this post is useful to you, you can support me with like/boost and advice in comments❤️
Disclaimer: As part of ThinkMarkets’ Influencer Program, I am sponsored to share and publish their charts in my analysis.

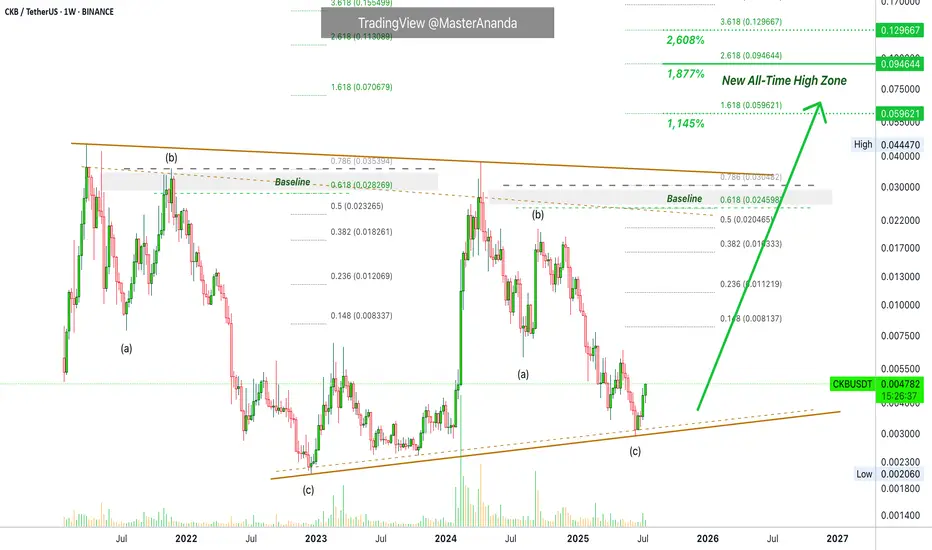
Nervos (CKB) · 1,877% - 2,608% Profits Potential · New 2025 ATHNervos (CKB) is headed first for the "baseline" to produce some 500% growth. This is the start...
Good morning and thanks for taking the time to read.
I appreciate your continued support.
The last four week we have seen rising prices, this is the start. The baseline level on the chart is actually the first wave fully in and complete. Maybe the first and part of the third if we consider a five up-wave structure.
Within a consolidation period, the baseline would be the end of the bullish action. After reaching this level, CKBUSDT would move back down to produce either a lower low or higher low compared to the start of the bullish move. We are not in a consolidation period anymore, we are entering the 2025 bull market phase so things will be different.
Instead of the baseline being an unbreakable resistance, CKB is set to continue higher. It is set to challenge the last all-time high and produce a new all-time high. The chart here shows that this is possible and highly probable.
The major correction between April 2024 and June 2025 was a classic ABC. This means that we are about to experience a bullish impulse composed of five waves. 1,2,3,4,5. The 2 and 4 are corrections. The action happens contrary to the main move/trend. The 1, 3 and 5 are advances and happen in accordance with the main move.
This should be smooth sailing with long-term growth. I am mapping 1,877% profits potential on the chart but there can be more, much more.
Namaste.
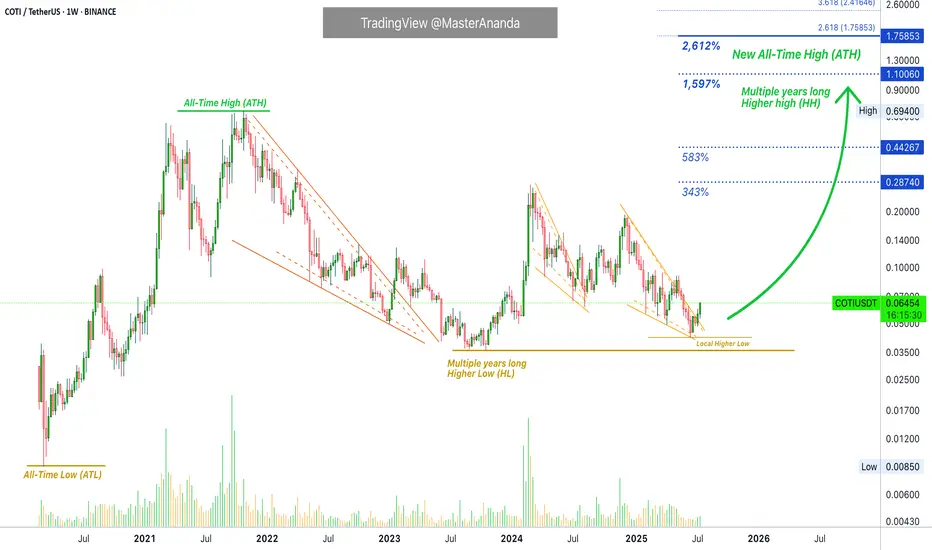
COTI Higher High (All-Time High) Confirmed · 2,612% Pot. ProfitsLet me remind you of one of the classic sayings, "higher lows will lead to higher highs —always."
While some charts are mixed; some projects produce shy lower lows and we don't know if this counts as a true lower low from a TA perspective; other pairs produce lower lows but still have potential for a new all-time high, some pairs produce double-bottoms and the situation becomes mixed; other pairs remain 100% clear. Here we have COTIUSDT with long-term higher lows.
The end of the bear market produced a bottom price that is many times higher compared to the start of the last bull market. A new all-time low (ATL) is simply not a question on this pair. The situation is 100% perfectly clear. Since we have an ultra-strong multiple-years long higher low, we can easily expect a higher high, which simply means a new all-time high (ATH) in the coming months. That's the beauty about TA and Crypto, you can predict the future if you know what to look for.
The easy targets here opens more than 580% profits potential.
COTIUSDT is trading with a full green candle today as it breaks out of a falling wedge pattern. The falling wedge is simply a downtrend. This downtrend is being broken.
On top of the long-term higher lows we have a local higher low, which is between June 2025 and October 2023. This is also long-term but not as long compared to the March 2020 market bottom and all-time low.
All this to say that market conditions are really good for this pair. The chart is super strong. This week we have a full green candle, trading at the top of the range and the session is about to close. When the session closes full green next week will be straight up. You will be witnessing the strongest action on this pair since early 2024 but with a big difference. It will be sustained. In early 2024 the big candles here only lasted three weeks. In 2025 you can have anywhere between 8-16 weeks straight up or even 24-32, etc. Whatever is needed for maximum growth to unravel. You won't be disappointed. You will be happy with the results.
Namaste.
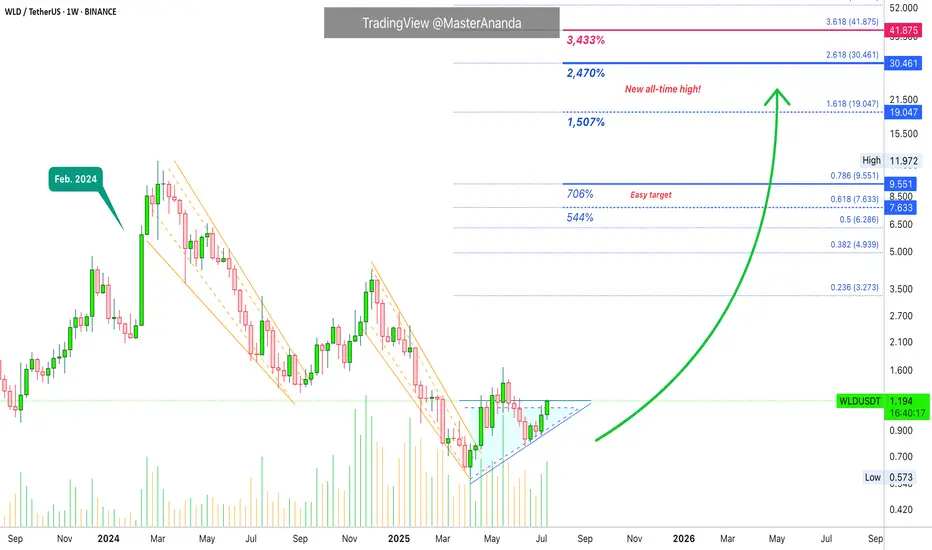
Worldcoin · Sudden Strong Jump · Beyond 2,400% Profits PotentialThe stage is now set. Chart and market conditions are perfect for a strong sudden jump. The type of advance that can change your life.
Good morning my fellow Cryptocurrency trader, I hope you are having a wonderful day.
Worldcoin (WLDUSDT) is still trading at bottom prices but with a perfect reversal pattern complete. The action is moving weekly above EMA8/13/21 and this week is closing green. This type of chart signal predicts astonishing growth. Wait is not necessary anymore.
This growth is already happening because we have two full green candles but this isn't it. The last two candles are full green but small. Things will change for the better. We will have full big green candles, something like February 2024 but instead of just one candle and then the action running dry and the start of a correction, we will have many big green candles coupled with sustained growth. It will be the best you've experienced since joining Crypto. Your profits will go through the roof; your capital will continue to appreciate; everything grows.
Volume is starting to rise as well but still relatively low. We have low volume because it is still early. The thing about "early" is that everything changes in a day. A sudden price jump. So today we are seeing prices below $1.20, in a matter of days WLD can be trading at $3 and then higher. Once the bullish breakout happens there is no going back.
We have an easy target first around 500-700% profits potential. The main stop opens up 1,500% and then we have more. Another strong target opens up 2,470% and this should be achievable in the coming months. I plotted just one more target just in case the speculative wave does what it tends to do best, surprise us all.
Just as a bear market can produce new all-time lows, a bull market can produce new all-time highs. Mark my words. Crypto is going up. Bitcoin is going up. Worldcoin is going up. The entire market is about to have the best yet period of growth.
If you are reading this now, you have great timing. Market conditions will be so much different in just two months. What seems normal today, and abnormal today, will be the norm. When it was a strange happening to see a 700% bullish wave, you will be seeing +1,000% across the entire market and many projects doing many times that long-term. It is hard to explain, but it is going to happen —Guaranteed.
The altcoins market is set to grow long-term.
Namaste.
The Crypto Era- Just updated an old chart!
- If you want to know where we stand, it's clearly outlined on the chart.
Some older Analyses :
- HODL strong!
Happy Tr4Ding !

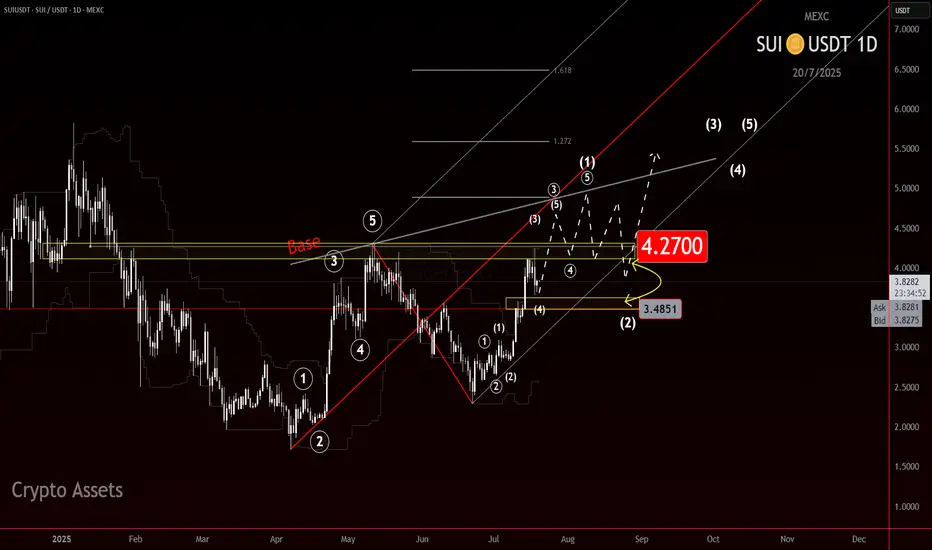
SUI: Calm Before the Wave 3 Surge?CRYPTOCAP:SUI is shaping up to be one of those charts that makes you lean in a little closer.
Right now, it appears to be sitting inside a potential wave 3, but something feels off. It hasn’t exploded yet. And when you’re looking for wave 3 behavior, that’s what you want: speed, commitment, follow-through. A clean surge, ideally in a straight line, that clears doubts and leaves the doubters behind.
We’re not seeing that yet. Right now the move is decipherable at many nested degrees making this move feel cautious.
And that opens the door to some possibilities:
It is a wave 3, just one that hasn’t lit the match yet.
We’re still nesting, multiple wave 1s and 2s stacking before the actual move hits.
Or it's a wave C of a Zig Zag.
As for levels, $4.20 stands out. Whether this turns into a rocket or a reset likely hinges on how price reacts there.
Stay nimble. If this is a true wave 3, it’ll leave no time for hesitation.
Be early, but not reckless.