The SqueezeWhile it is logical to assume that the bulls are the ones about to get squeezed, I am going to be a contrarian and bet on the SHORTs getting liquidated, big time.
Good afternoon my fellow Cryptocurrency trader, how are you feeling this Saturday?
Every now and then, every once in a while the market enters a fight between down and up. When tensions rise, when people become anxious, when greed is strong, that's the time for a market squeeze to develop.
Seeing how good Bitcoin is doing, the strong Ether advance, how the altcoins are moving ahead and the rest, it is easy to rationalize that the market will squeeze all the over-leveraged LONG traders. I will repeat myself again, this is a SHORT squeeze.
Let's wait and see. Prices are going up. 1 Billion in liquidations coming next.
Let the bears run. Let's us start a mini bull-run phase.
Namaste.
Crypto

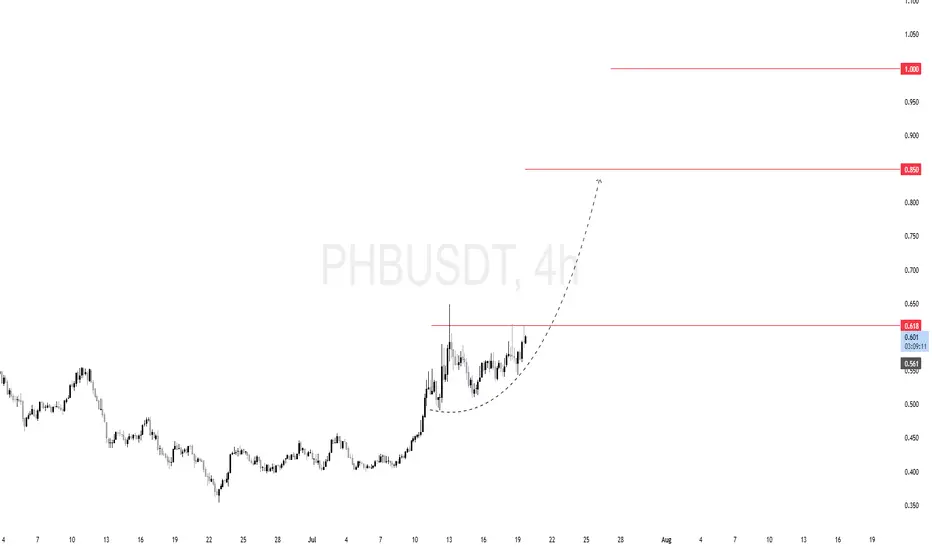
$PHB (PHBUSDT) 4HPrice spent several sessions consolidating below the $0.618 resistance zone. This horizontal level has been tested multiple times, building up buy-side liquidity above it.
We're seeing a rounded base formation — a classic bullish continuation pattern. It signals strong demand and positioning by smart money.
If $0.618 gets cleared with volume, we can anticipate rapid upside movement with the following key targets:
🎯 First target: $0.85
🎯 Final target: $1.00 (psychological level and historical supply)
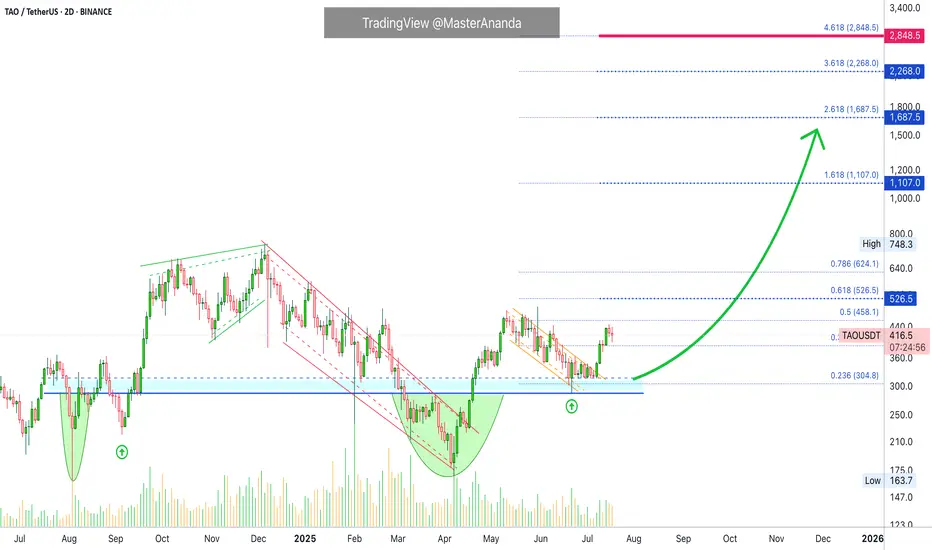
TAO's (Bittensor) True Potential Exposed · How About $3,000?Remember when I kept saying these are "conservative targets"? Why should we look for conservative targets when we know the market will do magic in the coming months? Why?
Let's focus more on realistic targets, optimistic targets, strong targets, good targets, successful targets; higher is better, less is not more.
We've been here many times before. I am happy and grateful to be able to count with your continued support. You can count with my analyses, great entry prices and timing. You can count with a unique market perspective 100% free of outside influences. I am not paid through USAID. 100% independent and everything you see is my mind, my soul, my heart and my spirit. It is my understanding of the market based on thousands of charts, thousands of publications, thousands of successful trades and more than a decade of experience. We are here to win and to trade. We trade to win, make no mistake.
Bittensor's (TAO) bottom is in, a long-term double-bottom; the beauty of TA.
A major low in August 2024. A new low in April 2025. The fact that these two happened at the same price is good news and it is already confirmed. Something as simple as the same level being hit twice helps us predict the future when it comes to the price of this, and others, trading pairs.
With the bottom in we can focus on growth. TAOUSDT is still early considering the bigger picture because the action is still happening below its May 2025 high. But conditions are good, very good I should say, because TAOUSDT is trading daily above EMA55, EMA89 and EMA233, a long-term moving average.
The break just happened days ago. If we are set to experience growth for 3-6 months, minimum, after this signal shows up, this opens the doors for prices much higher to what we've been considering in the past few months.
$1,100 is a good target but an easy hit. Only 30% higher compared to the last major high in December 2024.
$1,687 is the first strong resistance that TAO will face during its bull market bull-run. My bet is that it will break.
Going higher, we can see TAO trading at $2,268 later this year and even higher, just below 3K.
Now, this chart is very young so even while being optimistic we do not have enough data to project higher targets but there is no limit to how far-up a project can go during the price discovery phase. When we enter new all-time high territory and the final fifth (speculative) wave, all bets are off. You can aim for the moon or higher.
Namaste.
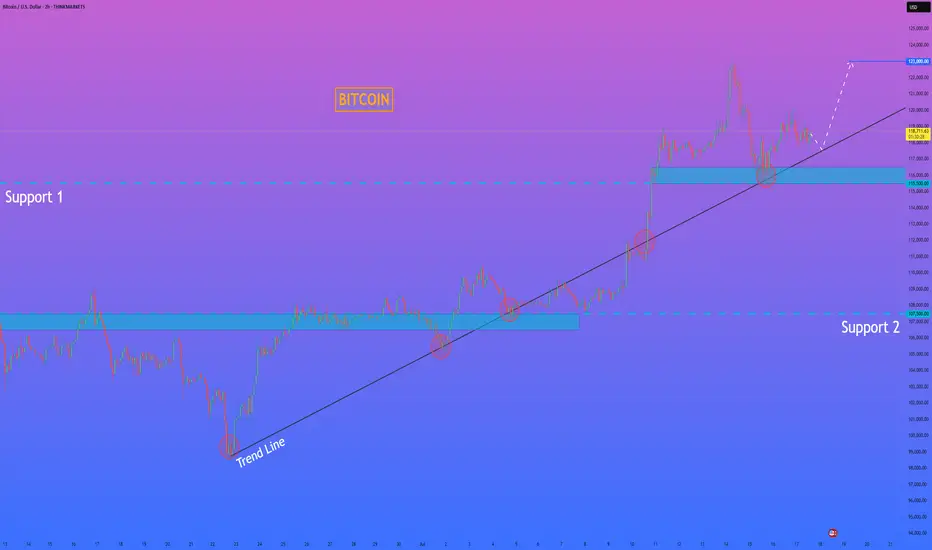
HelenP. I Bitcoin will correct to trend line and then start riseHi folks today I'm prepared for you Bitcoin analytics. The price has been trading in a strong bullish structure, clearly respecting the ascending trend line since the rebound from the 107500 level. Each time the price touched the trend line, it formed a higher low and continued the upward movement. After breaking through the important Support 1 zone (115500–116500), BTC made a strong impulse upward and reached a local high above 122000 points. Currently, the price is making a pullback and moving closer to the trend line again. This area has previously acted as a major point of interest for buyers, and now it's expected to play a key role once more. The support zone and trend line are converging, which makes this level critical for the next move. I believe BTCUSD will bounce from this area and continue its bullish momentum. My goal is set at 123000 points. Given the market structure, higher lows, and strong reaction from the support zones, I remain bullish and expect further growth from current levels. If you like my analytics you may support me with your like/comment ❤️
Disclaimer: As part of ThinkMarkets’ Influencer Program, I am sponsored to share and publish their charts in my analysis.
Avalanche's (AVAX) $229 & $363 Bull Market Potential ExposedStarting from the December 2020 low, Avalanche (AVAX) grew a total of 5,245% to its November 2021 all-time high. Now, if we take the true market bottom, when trading started back in September 2020 with a low of $0.85, total growth by the end of the bull market amounts to 17,152%.
It doesn't matter how you slice it, both are incredibly strong numbers.
Do you really think Avalanche will consolidate for years only to grow 500%, 600% in its bull market? I don't think so. This prolonged consolidation period was a test. Those that remained true to the market; those that continued to hold; those that continued to develop, to build and to grow within the market; all those people will be rewarded, big time.
Let's consider the true potential for AVAXUSDT in early 2026 or late 2025.
The main target is $229. I think missing a new all-time high is out of the question. We are going for the top as the market has been growing behind the scenes for so long. So much hard work has gone into making Cryptocurrency accessible to everybody and this hard work is about to pay off.
This $229 target opens up 880%. Keep in mind that this coming from current prices. If we were to consider the bear market bottom, this number would be much higher, something around 2,564%.
The next target, a "strong all-time high," is open at $363. This would give us a total profits potential of 1,450%.
As you can see, Avalanche is trading at bottom prices with plenty of room left available for growth. It is still very early if you focus on the long-term.
Thank you for reading.
Your support is appreciated.
Namaste.

Litecoin $1,000 (900%) ExplainedBack in 2020, just 210 days of consolidation led to a 1,623% strong bull market. How much different market conditions we have now. Since 2022, Litecoin has been consolidating. The length of this consolidation is now 1,127 days. More than five times the previous consolidation and then some.
How much higher can Litecoin go compared to a past period?
How much more growth can a project produce when it has been building strength for so long?
LTCUSDT is now trading weekly above EMA55. When this happened back in 2020, what followed was sustained growth. Straight up, literally, for a period of 203 days. No stops.
Back in 2020, Litecoin moved above EMA55 first in August just to be rejected. The second time was the good one. This year the situation is the exact same. Litecoin broke above EMA55 in May and was rejected. The second time is happening now in July and this is the good one.
Litecoin is also trading above MA200 fully confirmed and there is a golden cross between EMA55 and MA200. We are very close to a major marketwide bull-run.
$644 in this bullish cycle is a high probability target for Litecoin, but prices can go higher, much higher because market conditions continue to improve and institutions will gain access to Litecoin through Exchange-Trade Funds (ETFs). This means that a standard price projection would be a disservice to us. We are aiming for $1,000+ on this bullish cycle but it can end up closing higher of course.
After the new all-time high is hit, it is normal to see a correction or even a bear market. This one should be short and small compared to previous ones. See you at 1K.
Namaste.

$NEAR Local Still looks corrective..Though the CBOE:NEAR weekly looks good the same pattern on NEAR that I have highlighted here was also found on NYSE:FET and EURONEXT:RNDR local charts that has held these coins back from moving compared to others and appears corrective in nature and they all end at the daily 200EMA on bearish divergence.
Just something to look out for. A rejection in alts now could see fresh lows
Safe trading

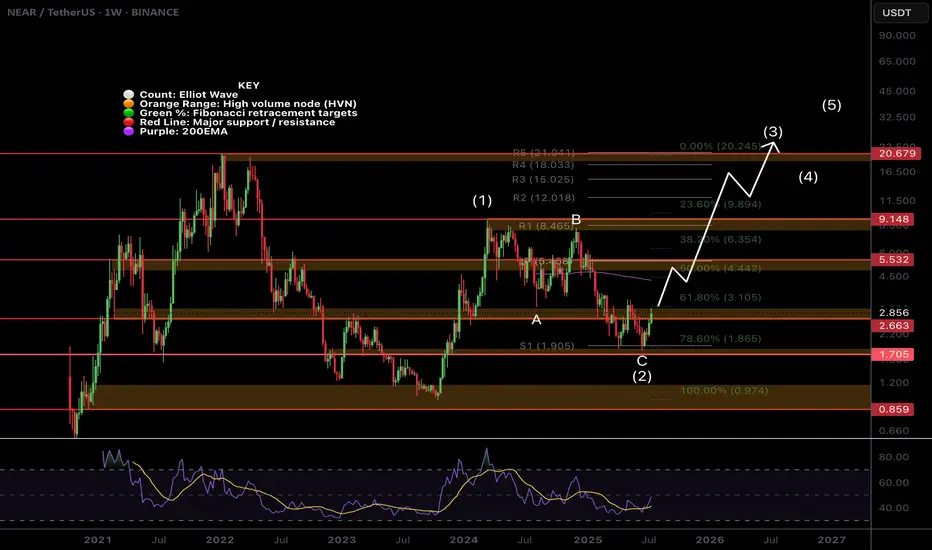
$NEAR Weekly TextBook Elliot Wave!CBOE:NEAR Weekly chart is a great demonstration of the text book motif wave followed by ABC corrective wave.
Bullish divergence has printed on the weekly RSI at the S1 weekly pivot support and the 'alt-coin golden pocket' 0.786 Fibonacci retracement. Price is closing in the major resistance High Volume Node.
The upside target is the newly printed weekly 200EMA followed by the weekly pivot and major resistance HVN just above $5.
A terminal target for this cycle may only see NEAR hitting all time highs around $21, the R5 weekly pivot point.
Safe trading
$RENDER Weekly Brings Clarity!CRYPTOCAP:RENDER weekly chart shows long term strength through the depth of the Fibonacci retracement not even reaching 0.5.
The depth of the recent swing low been so close wave (C) does concern me that the larger correction is not yet over and maybe price does want to visit the 'alt-coin' golden pocket of the 0.618-0.768 Fib retracement Where the would be a High Volume Node (not drawn).
For now the upside target is the weekly pivot but the local chart has a lot of work to do first with daily 200EMA!
Safe trading

$RENDER At Major Resistance!CRYPTOCAP:RENDER has been relatively weak. Looking at the local chart it appears we have finished a wave (3) at the daily 200EMA and descending resistance.
Price has overcome the High Volume Node (HVN) support flipped resistance but a strong at coin pull could see fresh lows for Render.
There is also daily bearish divergence on the RSI.
The Elliot Wave count could also be an ABC corrective wave up which has now terminated.
If its a new motif wave and a major bottom has formed , wave 2 should find support at the HVN, daily pivot and 'alt-coin' golden pocket between 0.168 and 0.782 Fibonacci retracement
Safe trading

Sushi Turns Bullish, Major Support Zone Left Behind · $105 Next?A major support zone from November 2020 has been left behind. The launch pad for Sushi's previous bull market. Let me explain.
Right after SUSHIUSDT became available for trading late August 2020 it started a strong decline. This decline found support at a low point November 2020. To this day, this low remains the strongest and most important support for this pair and it has never been broken on a weekly close, not even once. The level was tested three times: In 2025, 2024 and 2023 and each time it gets tested a bullish wave develops.
From November 2020 through March 2021, 126 days, SUSHIUSDT went ultra-bullish, total growth amounting to 4,864%.
The bullish waves in late 2023 and 2024 were something minimal, whales buying nothing more as there was no continuation. The situation is different today.
Sushi has been accumulating for years and is ready for a full-blown bull market. This week it started trading above EMA55 on a full green candle, coupled with really high volume. This is it, the major bull market cycle and wave. It ends in a bull-run phase.
The November 2020 support is now being left behind. Sushi is preparing and has the possibility of hitting a new all-time high in late 2025. It can happen that the action goes beyond this year and into 2026.
Some pairs can produce an entire bull market bullish wave in 3-4 months. Other pairs can do so in 6 months exact. Some others go for longer and last 8 months while a different set can take 12 months or more. Some pairs have been in bull market territory (higher highs and higher lows) for years... Let's hope the entire market decides to produce long-term growth.
The low in June this year is a higher low compared to April. Here you can see the market variations. Some pairs produced lower lows and others, like this one, produced a higher low. Lower low or higher low makes no difference when it comes to the bigger picture, this is simply a technicality.
We are now entering a massive, marketwide bullish phase. You just need to be prepared for what is coming because this will be the opportunity of a lifetime. While there will always be new bear markets and bull markets, the prices we are seeing now will be forever gone. Crypto will grow so fast and so strong, that the next correction bottom will be really high compared to the most recent major low. Cryptocurrency is going mainstream and is here to stay for the long haul.
Namaste.

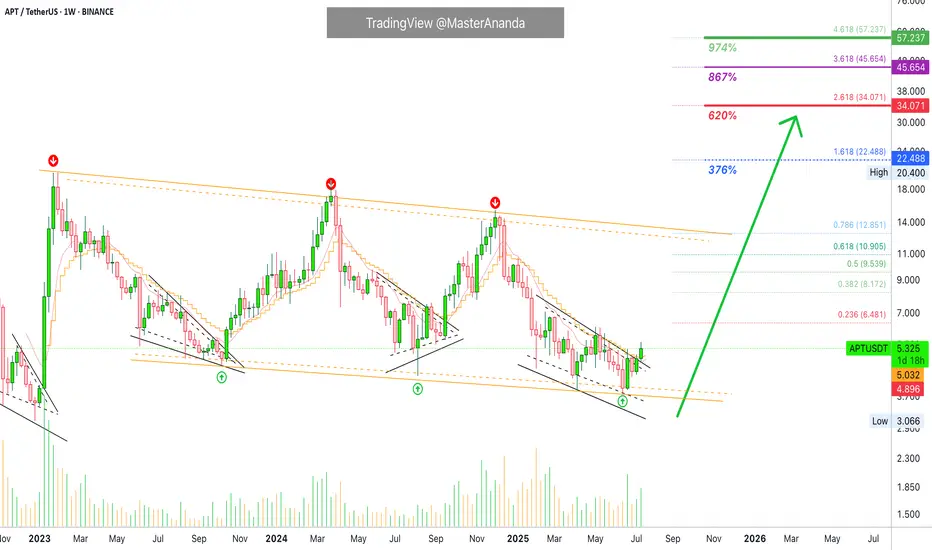
Aptos Bullish Bias Intensifies · Moving Above 2 EMAs WeeklyLast week APTUSDT (Aptos) closed above EMA8 and this week it is trading, and set to close, above EMA13. The bullish bias is becoming stronger; notice the bullish reversal pattern in black. Each time this type of pattern showed up Aptos turned bullish. This is the fourth time and it won't be different. It will be different only in the sense that the long-term consolidation descending channel will break. Instead of resistance being found and confirmed at the upper-boundary of the channel, APTUSDT will produce a new high, a higher high and a new all-time high. You are witnessing the start of the 2025 bull market cycle. Growth potential goes beyond 800%. Total growth from bottom to top can reach 1,000% or more.
Thank you for reading.
Namaste.
Ethereum · No Reason To Stop · Will Continue RisingEthereum will continue rising. Remember Ether is number two and it is awesome, to start, and it follows Bitcoin like darkness follows the light. There is no reason for Ether to move down. There is no necessity for ETH to stop its major advance, in fact, it has been lagging behind and it needs to catch up. Bitcoin is waiting and will continue waiting but it won't wait forever so Ethereum must wake up and is waking up. We are going up.
Ethereum has grown 165% since its 7-April low. This is more than XRP and its capital is twice as much. Boom! The best part? Ethereum will continue growing straight up for weeks and months. It needs to be trading at a new all-time high as soon as possible just so that the market can feel at ease and know, once again, that Crypto is here to stay.
What has been suppressed can't stay suppressed forever. Crypto went through a fight but challenges only made us that much stronger. We are now happy and grateful for everything that we went through because we know that we can take anything the world throws at us.
The chart. Green, green, green straight up. Two months of consolidation. That's the key. ETHUSDT went sideways for almost two months and this reveals what comes next. The advance outside the consolidation range has been happening for 8 days. 60 days of sideways can support at least an entire month of growth. When the entire month is consumed, we can expect a retrace, nothing more, followed by additional growth.
In short, Ethereum will continue rising. If you see a shakeout, know that growth will always resume in a matter of days. If you see a drop, know that this is a bear-trap, the bulls now own the game. If you are in doubt, come read my articles and I will publish something that you will understand and agree is right, so you can continue holding until you can reach the big prize.
The time to sell will come, but it isn't now. Right now is the time to hold strong. Not only Ethereum, but Cardano, XRP, BTC, Dogecoin, Solana and the rest of the altcoins. This is only the start.
I expect Ether will continue rising. $8,000 now looks like such an easy target...
Very good indeed. If you enjoy the content, follow me.
Namaste.

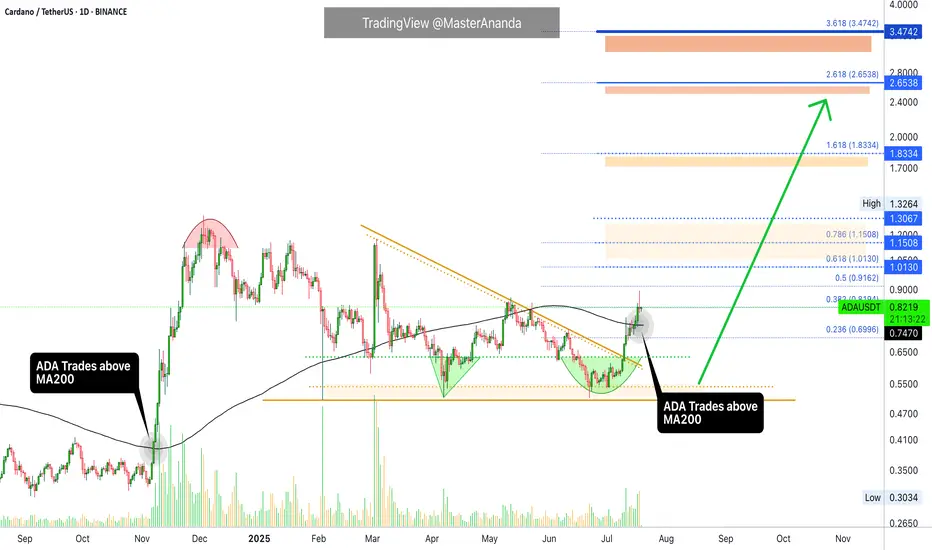
Cardano Update · What Happens Now?I am going to assume that you read the XRP update I just published. While these are different pairs, my updates and publications are all related because I look at the entire market—for you—as a unit.
The situation with Cardano is different to XRP. Why? Because XRP already broke its previous bullish wave high while Cardano hasn't. This first tells us that Cardano has more room for growth and has less risk from a buyers standpoint. It can also be seen as Cardano being weaker or lagging behind in someway but I wouldn't give credit to this interpretation. The truth is that the market moves in unison but not at the exact same time.
May's high, reached first from the 7-April bottom, has been challenged but confirmed as resistance. This won't last long. It has been confirmed as resistance and we can easily see it by yesterday's red candle. This is normal. If you look at 14-July and 12-July, these days were also red yet Cardano continued growing. You can expect the same.
We can have one day red, two red days, three red days and nothing changes. The market is set to grow, is growing and will continue to grow in the coming weeks and months. Long-term growth and even beyond months. There is the possibility of growth extending to years similar to Bitcoin.
When a huge wave develops, we get a half year strong correction, a major higher low compared to the start of the phase followed by additional growth.
Let's get back to today and what is happening now.
ADAUSDT managed to break above MA200 16-July, just three days ago. This confirms a long-term growth process; it is now confirmed. This means that Cardano is on track to grow for 3-6 months minimum.
What we are seeing now is only the start of a major advance and the continuation—on a long-term basis—of the move that started in late 2024.
You can rest easy, sleep easy while you watch your profits grow. Cardano will continue growing, it will do great; you have my word.
Thank you for reading.
If you enjoy the content leave a comment just for this one, I will be sharing updates for you now, today, yesterday, tomorrow and for years to come.
Namaste.
ETH to $12,600I think ETH, with all the current fundamental shifts happening in the past 6 months, is prime to run to the golden pocket, a perfect measured move and cup & handle pattern playing out.
1️⃣ Institutional floodgates opening
Spot ETH ETFs have seen massive inflows—billions flowing in just weeks.
BlackRock and other majors are prepping ETFs that may include staking, turning ETH into an institutional yield asset. This is serious structural demand, not retail hype.
2️⃣ Regulatory clarity coming in hot
The GENIUS Act and stablecoin bills in the U.S. are pushing regulatory clarity into crypto markets fast. This reduces uncertainty and increases appetite for ETH from corporates and funds.
3️⃣ Technicals are clean and bullish
ETH flipped $3,300 into support and is holding strong.
Next major resistances at $3,800–$4,100, with ATH at $4,800 firmly back on the radar.
Short-term structure is clear: higher highs, higher lows, solid volume backing it.
4️⃣ On-chain and supply dynamics
Whales are aggressively accumulating—large wallet inflows confirm that.
Staked ETH keeps hitting new highs (~30% of supply locked), tightening available float.
This supply squeeze + ETF demand = bullish cocktail.
5️⃣ Ethereum’s ecosystem dominance is intact
ETH still hosts the lion’s share of stablecoins and DeFi.
Layer-2 scaling is progressing fast, upgrades like EIP-4844 and Pectra coming soon, reducing gas fees and improving UX—critical for future adoption.

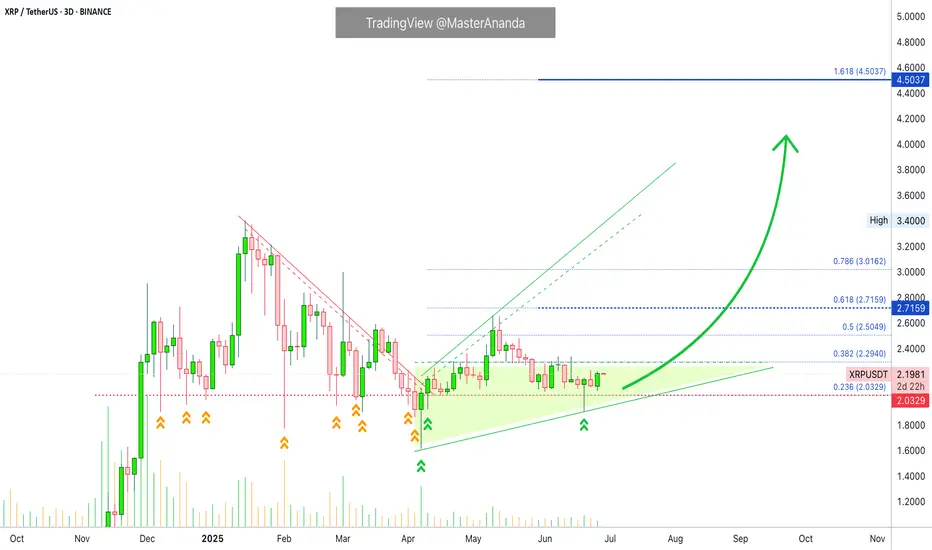
XRP Update · What To Expect Short-Term (Now!)XRP just hit a new all-time high and this is truly awesome if you hold this pair, if you were bullish before the breakout, if you bought LONG, etc. It is also good if you are an analyst looking for clues that will tell you what will happen to the Cryptocurrency market in the near future.
Remember that XRP moved early to start this cycle and it moved strongly. Right now, it is moving early and strongly again in comparison to many other pairs. This tells us that the rest of the market will follow.
I saw very strong bullish action across many pairs but I also saw many pairs staying behind; below their April's high. Now, what happens next?
XRPUSDT made a stop after moving beyond its 16-January 2025 high. This is pretty normal behavior. After a strong rise, there is always a stop, retrace or correction. We do not expect a correction to develop now because the consolidation period was very long, strong and prolonged. So we don't have to worry about that one.
A retrace is possible but having one would be small and short-lived. Finally, a pause is the most likely scenario. A pause can range between 3-9 days. That is, that amount of time before additional growth.
The final possibility is the market moving straight up. Since we have a 126% rise since the 7-April low, we don't give much credit to this scenario. The top choice is a small pause before additional growth. The important part is "additional growth." This is what will happen. This is what comes next. XRP will continue growing. Boost if you agree.
Namaste.
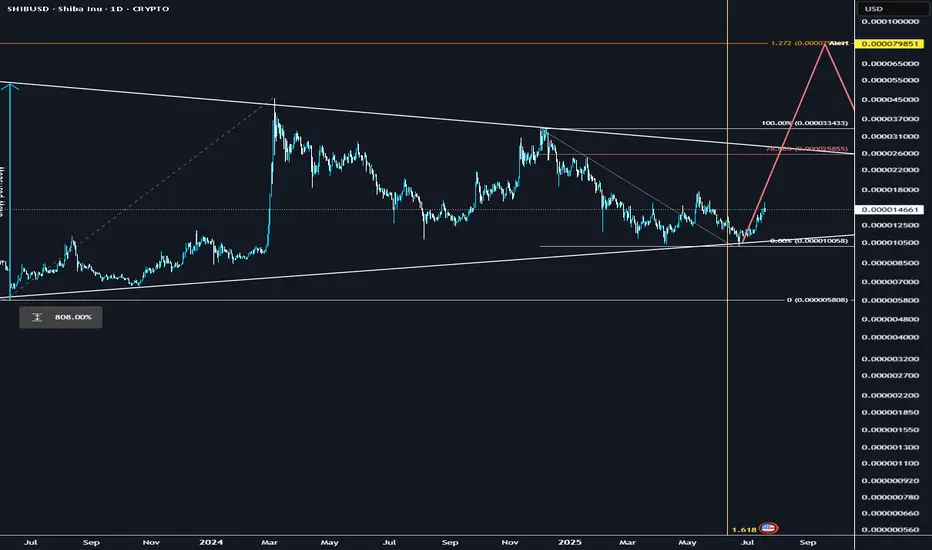
SHIB could explode soon.Multi year accumulation, crossing a significant fib-time pivot, similar set up to XRP.. could follow DOGE once it takes the lead as a catch up trade and rip..
Technical breakout: Above 200-day MA + golden cross formation
Volume surge: Social + trading volume spiking, driving demand
Ecosystem catalysts: Shibarium L2, metaverse progress, aggressive token burns cutting supply
Macro tailwinds: ETH rally + broad altcoin strength
I think it could be one of the leaders before capital rotates into the lower caps
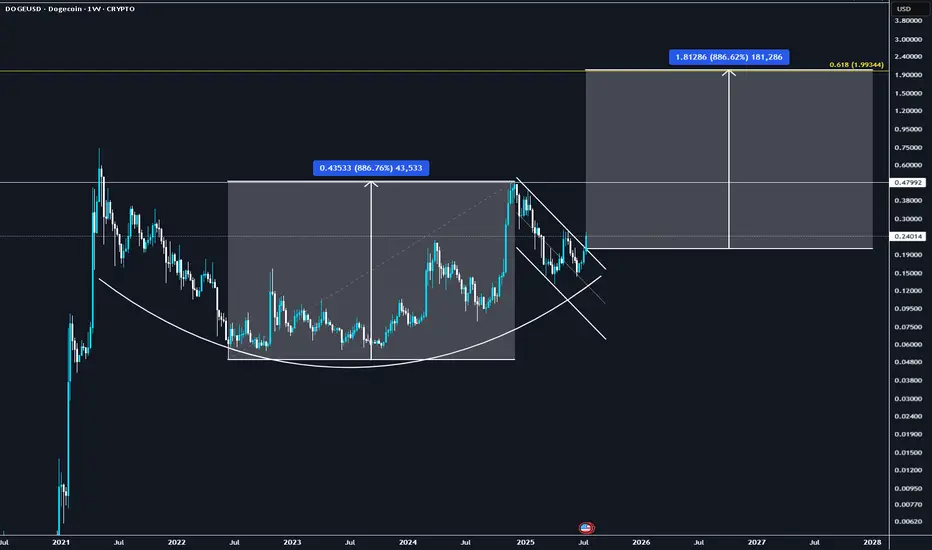
DOGE to $2 before EOYCUP & Handle type formation on DOGE, really believe this can run to $2 during alt season which has just started firing its engines ...
BTC.D finally looks toppy.
📈 1. Technical breakout & chart patterns
DOGE has recently broken out of a long-term descending channel, forming a classic double-bottom pattern—a strong reversal signal.
It also cleared the key $0.20–$0.21 resistance zone, with on‑chain data pointing to rising futures/open interest and reduced sell pressure
⚖️ 2. Macro & regulatory tailwinds
The passage of the Genius Act in the U.S. House brought “clear‑cut regulation” for crypto, boosting confidence and driving DOGE higher—rising ~8% on the news
Broader crypto bull sentiment—fueled by possible Fed rate cuts and favorable legislation—has pushed altcoins like DOGE ahead this week
🧠 3. On‑chain & investor activity
Charts show increasing futures & spot trading volumes, along with expanding whale activity and holders staying profitable—collectively suggesting strong demand and low sell pressure
Network usage is also up: wallet interactions and momentum have accelerated as DOGE crosses these technical thresholds
💬 4. Community & utility factors
Dogecoin maintains a vibrant community, boating meme-driven social capital, plus occasional celebrity mentions (e.g., Elon Musk), keeping public attention
Its growing real-world usage in tipping, payments (e.g., Shopify, AMC, Tesla merch), and even institutional products—like the Grayscale Dogecoin Trust—adds fundamental backing
Synapse Short-Term Trade, To Move Next · 309% Profits PotentialLet me give you another pair that is ready to move, just in case you want to make some quick profits for the weekend (next weekend).
Good evening my fellow Cryptocurrency trader, how are you feeling in this wonderful day?
Everything we were expecting is now becoming all true. The altcoins market is bullish and moving up. We have long-term and short-term charts. Here you have a little bit of both.
Synapse will grow long-term of course, but we will focus on a sudden jump that will be happening next. Can be tomorrow, in a few days or a week or so maximum. The chart is bullish now.
Many pairs are moving past their April's high, I take this as a very strong bullish signal. Many pairs are still trading below. I take this also as an opportunity, it means that we can buy them before the breakout and enjoy fast, easy growth. The choice is yours.
Trading above EMA8/13/21/34.
Yesterday's candle is interesting and the really high volume 8-July. Remember, high volume at low prices with marketwide bullish action and you need no more. We are bullish, bullish now, bullish later—may profits come. Thanks a lot for your continued support.
309% potential profits is the next high. A minor stop and then higher.
You can cap your earnings even sooner at 124%, 226% or wait for the full 300%. Whatever you choose is up to you. Easy win with low risk when trading spot; you can't go wrong.
Thanks a lot for the follow, the trust and your continued support.
-----
The chart also shows a rounded bottom as a lower low. The lower low is a bullish signal because all weak hands were removed. When support is pierced on a broader bullish bias this is bullish. The action is happening back above the 7-April low and this works as confirmation of the move that I am predicting now. The pierce of support is not a bearish impulse/wave but rather a stop-loss hunt event.
Namaste.

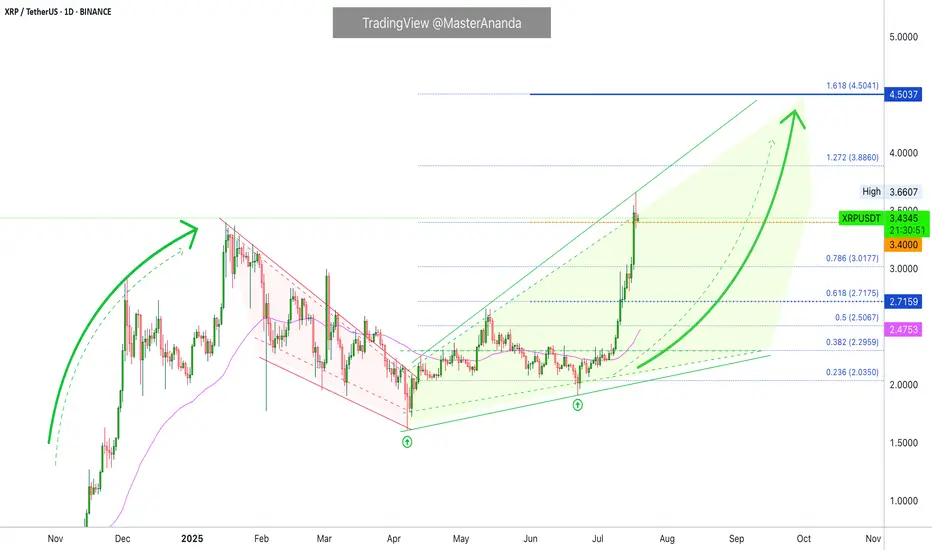
XRP Support Holds After Being Tested 12 Times...Everything below $2 is quickly bought. No crash is good news. Not having bearish action and bearish follow up on sellers pressure is bullish. XRP is bullish and has been consolidating for months. The longer XRP trades above $2, the stronger will be the bullish wave that follows. We are getting very close.
Good evening (morning) my fellow Cryptocurrency trader, I hope you are having a nice day.
The same level has been tested over and over and over since December 2024 and it continues to hold. XRP managed to wick below $2 more than twelve times, this support continues to hold. When prices move lower, buyers quickly show up.
Look at this, before 7-April XRP was moving below $2 very often. After 7-April, only twice. Big difference. This reveals a bullish bias. When the market was bearish, this support was tested more often than not. As soon as XRP turned bullish, it was tested only once recently and once after the 7-April bottom.
This little dynamic here shows that the bulls have the upper-hand and this is all we need to know. Knowing that the bulls have the advantage, when the market breaks it is going to break up. A bullish continuation. It is confirmed and it is only a matter of time.
How long? Only the market knows but it is not far away. The longer it takes, the stronger the bullish wave that follows. Strong growth is likely to develop within days.
Namaste.
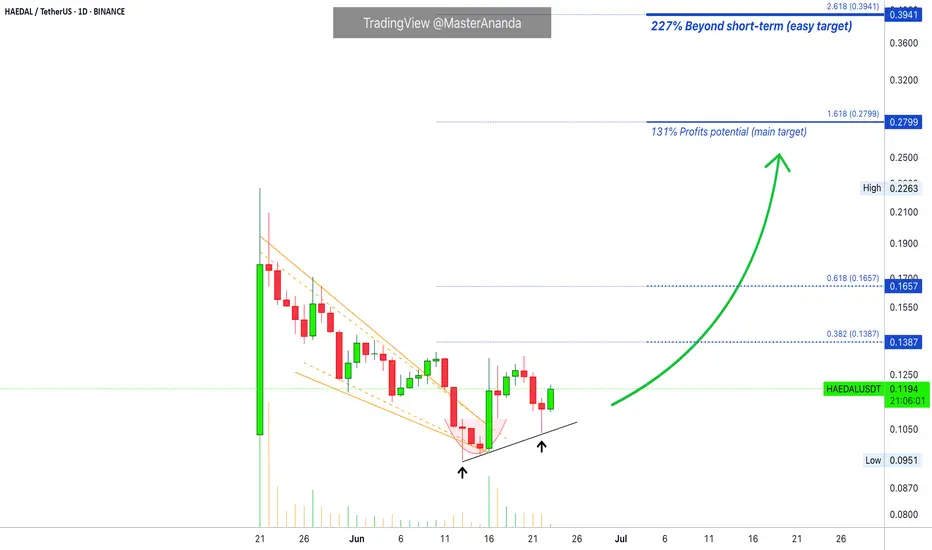
Haedal Protocol: Trading Young Charts Short-Term (~125% Profits)Remember the "young charts"?
"Not enough data."
We now trade the young charts as well but always keep it short-term. Our aim is a maximum of 130-120%.
Here I show higher targets but normally that's the range. We go for 10% the first target, more or less, to 120-150% the last target.
And of course, short-term for us means one month (30 days). For some people and trading styles this is a very long time and I understand.
Technical analysis HAEDALUSDT
» We have the falling wedge pattern. Automatically when the action breaks out of this pattern we have also a broken downtrend and downtrend line.
» Here we have a rounded bottom, a higher low and a bullish hammer candlestick.
» 16-June produced the highest volume and this day marks the end of the downtrend and bullish breakout from the falling wedge.
All these are bullish signal. We are aiming up while aiming higher. Higher high, higher heights, new all-time high and beyond in the coming weeks and months.
Namaste.
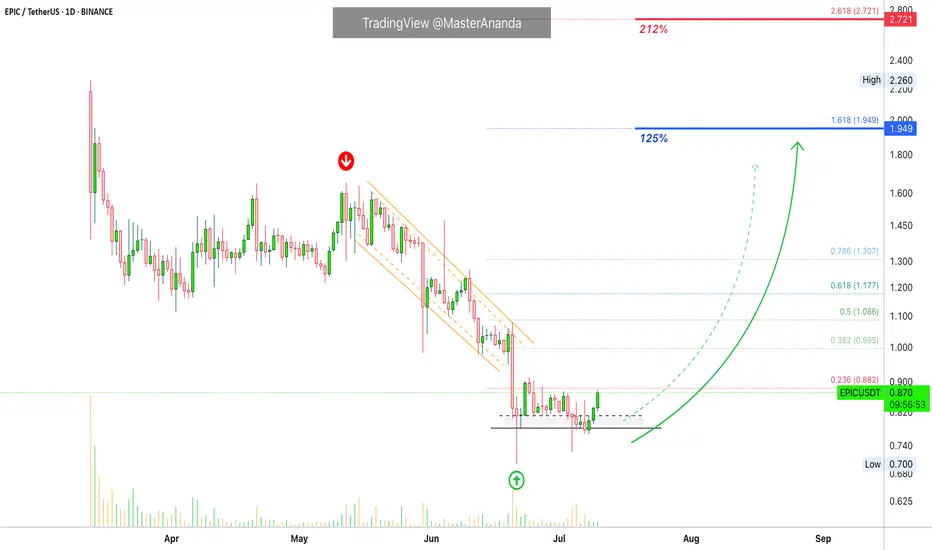
Epic Chain 212% Move Mapped —The 2025 Altcoins Bull MarketThe altcoins market bull market is fully confirmed and this confirmation comes as soon as Bitcoin hit a new all-time high. When Bitcoin is strong, bullish yet sideways, the altcoins market tend to grow. The altcoins are growing now, some pairs growing three digits within hours and that's because Bitcoin continues to consolidate near resistance. This same dynamic will only strengthen and is set to continue for months.
Epic Chain (EPICUSDT) already hit bottom and is ready to grow. Here we have a very easy 125% target, a fast, strong and easy bullish wave. It is likely to go way beyond this target but this is based on the short-term. It will go beyond because the altcoins are producing over 50% in their first hour or two of the initial bullish breakout. More than 100% within days and the potential for the entire bull market will be 20-30X on average.
You've been warned. This is a friendly reminder.
Prepare and maximize profits. Do whatever it is necessary to make the most of this opportunity, it only happens once every four years. This is the 2025 bull market bullish momentum building up. Just as promised. You will be happy with the results.
Namaste.
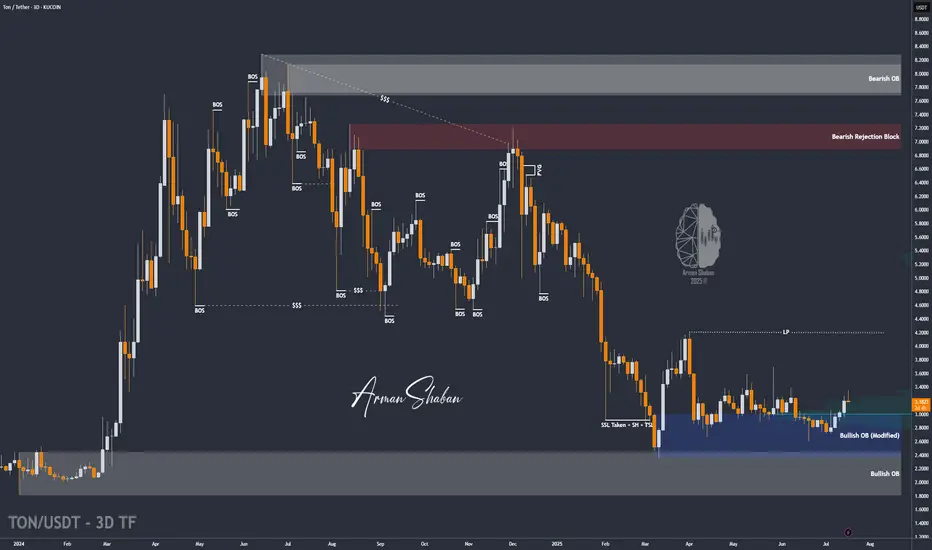
TON/USDT | Another Bullish Move Ahead? (READ THE CAPTION)By analyzing the Toncoin chart on the 3-day timeframe, we can see that, as per yesterday’s analysis, the price climbed to $3.36 before facing a slight correction — which is perfectly normal since every strong bullish trend needs a healthy pullback. The $3.05–$3.20 zone could serve as a good accumulation area for buyers, and we may soon witness another impressive rally from Toncoin! Based on the previous analysis, the next targets are $3.63, $4.20, and $4.68.
Please support me with your likes and comments to motivate me to share more analysis with you and share your opinion about the possible trend of this chart with me !
Best Regards , Arman Shaban