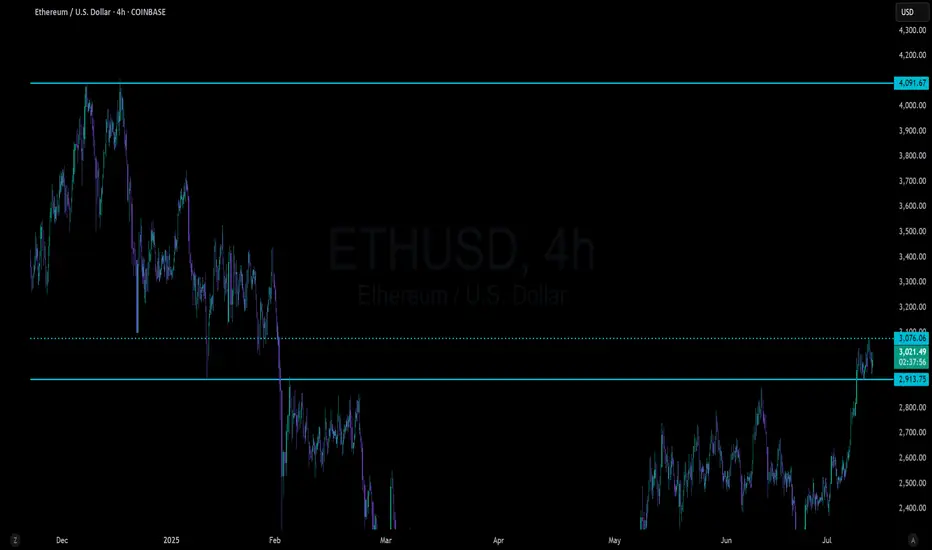
*ETH 4H — Charging the 0.236 @3700$ETH on the 4H is getting ready to charge the 0.236 Fib level.
MLR > SMA > BB Center — momentum is aligned.
Volume confirms the move.
Even though I don't enjoy it — and last time I sold just a part of the position too soon —
I placed a partial TP again. It needs to be done. The market can always turn.
We’ll be here to see it unfold.
Always take profits and manage risk.
Interaction is welcome.
Crypto

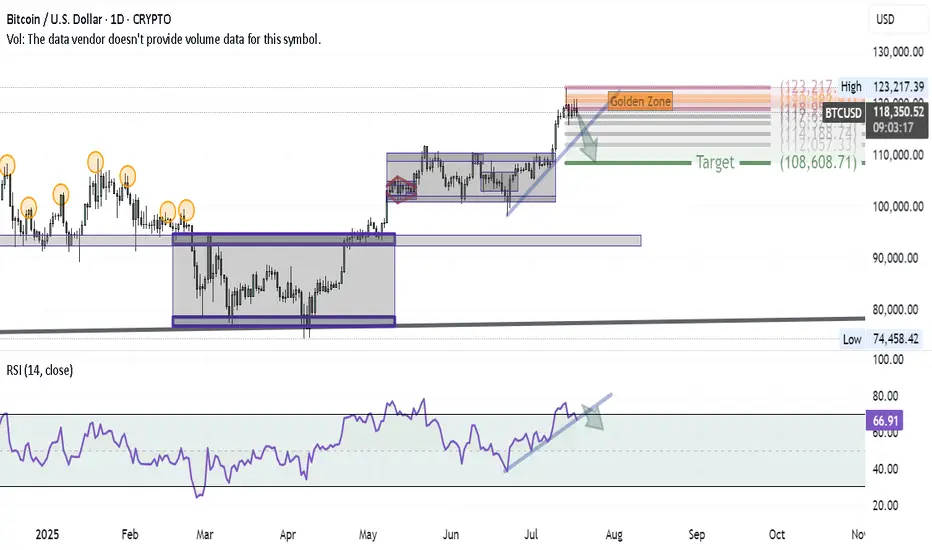
Bitcoin Correction Unfolding — First Wave in MotionAfter successfully hitting the BITCOIN target and anticipating a major correction in my previous ideas, here’s how the first wave of that correction is shaping up on the daily chart:
1- At the recent high, a Shooting Star candle formed — a classic reversal signal.
2- Using Volunacci analysis, the price retraced exactly to the Golden Zone, validating the first leg of the pullback.
3- The next step? A breakdown of the blue trendline would likely send us toward the Volunacci target at $108,600.
4- For confirmation, we're watching the RSI trendline — if it breaks down as well, it would strongly support the bearish continuation.
The setup is clean and developing as expected — it's all about following price and letting the chart guide the story.
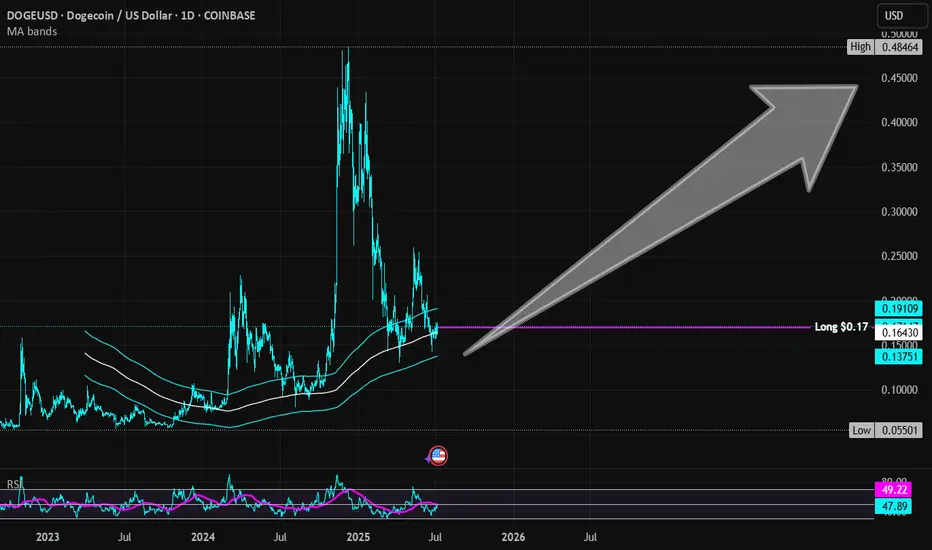
Dogecoin | DOGE | Long at $0.17Currently within my historical simple moving average area and consolidating. I suspect a move up is imminent, but 100% speculation. Crypto "bros" know more than I do.
Targets into 2028:
$0.25 (+47.1%)
$0.45 (+164.7%)
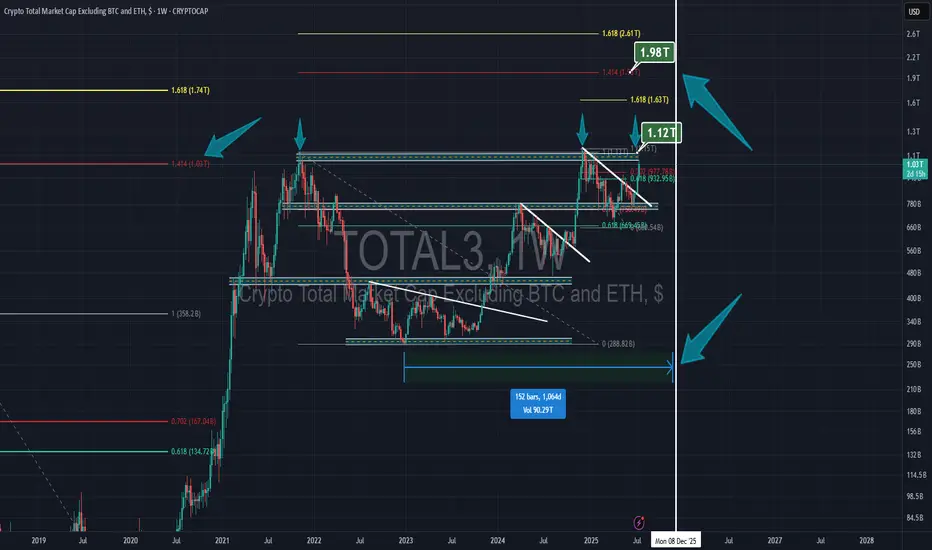
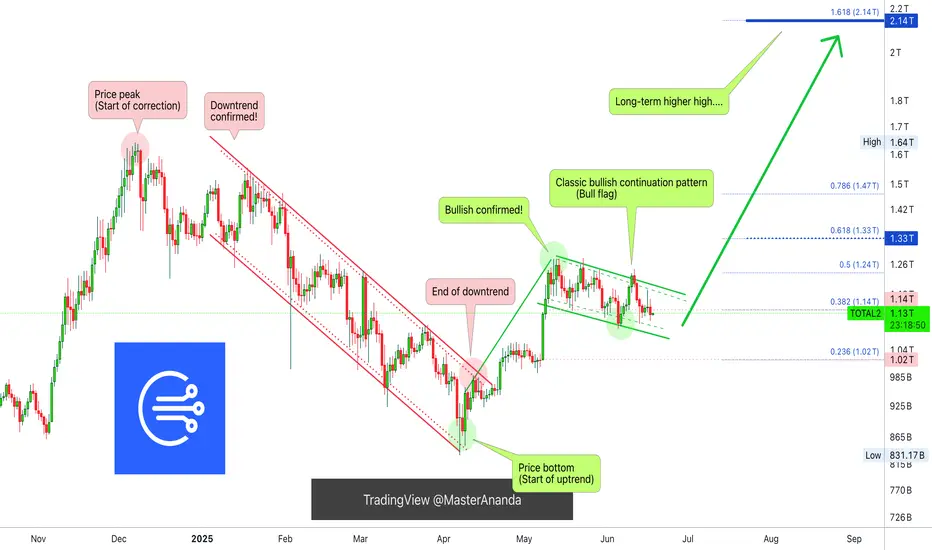
TOTAL3 exc BTCÐTOTAL3 is at the all-time high again and pushing to break that.
according to previous cycles the 1.414% of Fibonacci retracement at $1.98T is the top & timing of before the end of November 2025
TOTAL DEFI: HTF Reaccumulation Underway — $200B+ In SightThis is one of the cleanest HTF setups in the market right now — and it’s flying under the radar.
We're looking at TOTAL DEFI market cap, and it’s showing all the signs of strong reaccumulation following a textbook breakout–retest structure off a larger HTF accumulation base.
Price broke out from the 2023–2024 accumulation range, retested that breakout zone and range highs in August 2024, swept liquidity, and tapped into unmitigated demand within the accumulation range — before climbing back to the $155B region, creating a larger range above the prior accumulation range it broke out from.
Since then, price pulled all the way back to range lows and HTF demand at $65B, forming a new bullish reversal from this key region and retesting the trendline breakout before continuing another leg higher — as we’re now seeing unfold.
But here’s the key:
🧠 That recent deviation came with the highest volume ever recorded on this chart — right off the range low and HTF demand.
That’s not retail. That’s large operators loading up, leaving their footprint ahead of the next expansion leg.
We’ve now:
- Broken the descending trendline cleanly
- Flipped key SR levels back into support
- Started pushing higher with strong HTF closes
📈 Expectation:
This is a spring + test setup within a reaccumulation range. I’m targeting continuation toward the range highs, followed by a macro breakout that could take DeFi market cap to $200B+ — especially once the prior distribution zone is reclaimed.
This aligns with the broader cycle narrative — liquidity rotating back into altcoins, particularly DeFi, as stablecoin dominance declines and the market shifts fully risk-on into the final phase of the bull cycle.
Key Structure Summary:
- HTF accumulation base → breakout → retest → demand sweep
- Largest volume spike = operator footprint
- Higher lows forming = market structure flipping
- Expecting expansion to $200B+ as trend continues
One to watch closely.
Don’t fade the volume. Don’t fade the structure.

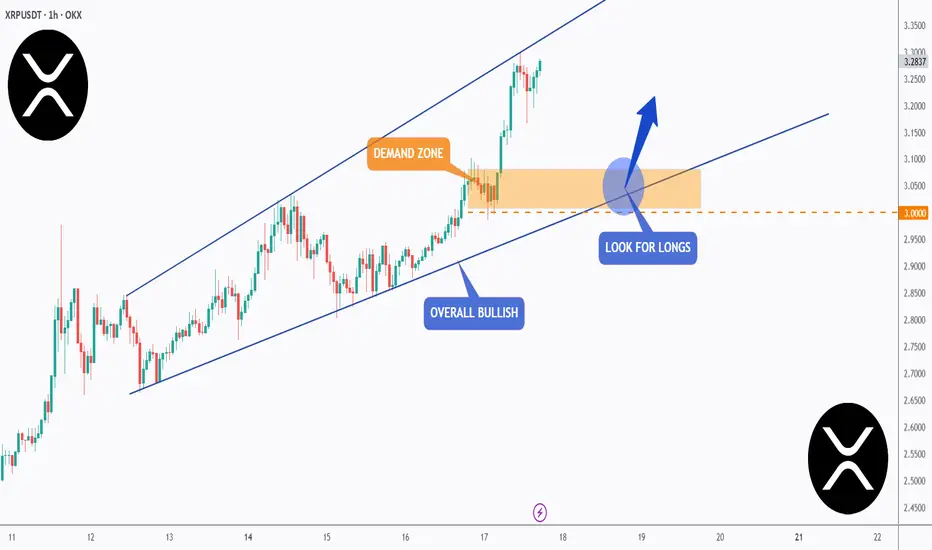
XRP rally to $8.50After XRP broke above the resistance at $1.80 now that became the major support for the past few months and XRP is taking off again.
According to this huge monthly triangle and calculate from the breakout, so the next target for XRP is $8.50 for the coming months.

ETH 1D Overview Finally we are seeing altcoins regaining lost ground on Bitcoin and the second largest crypto by market cap is rallying strong.
Since ETH has such strength currently the opportunity to short is quite slim with high risk, however I think it's important to see where ETH may find some resistance or if a pullback was to happen, where would it come from?
The first level is the bearish orderblock level that has just been tapped as of writing. This area previously began the sell-off at the end of 2024 by confirming a new lower high. Naturally this area will present problems for the bulls and so a potential pullback could be initiated from this level. I would like to see a sweep of the stop loss positions just above the area and then a SFP to confirm the pullback is in motion.
Should the bearish orderblock fail the next clear level is the daily local top around $4000. A big even level and the area that started 5 months of downtrend. IMO the most likely level where longs will take profit. I do think if we see any form of consolidation between the bearish orderblock and the local high the bulls will look to carry the rally on, shallow pullbacks maintain momentum
Ten out of the last eleven days have been green candles with the only one day being red just above a key high, I expect if we are to get a pullback that bullish orderblock area ($2900-3000) to be retested as support. Therefor if any of the above areas initiate a pullback this area should provide support and therefor a long entry.
To clarify I am in no way bearish about Ethereum, this is just a plan for different eventualities.

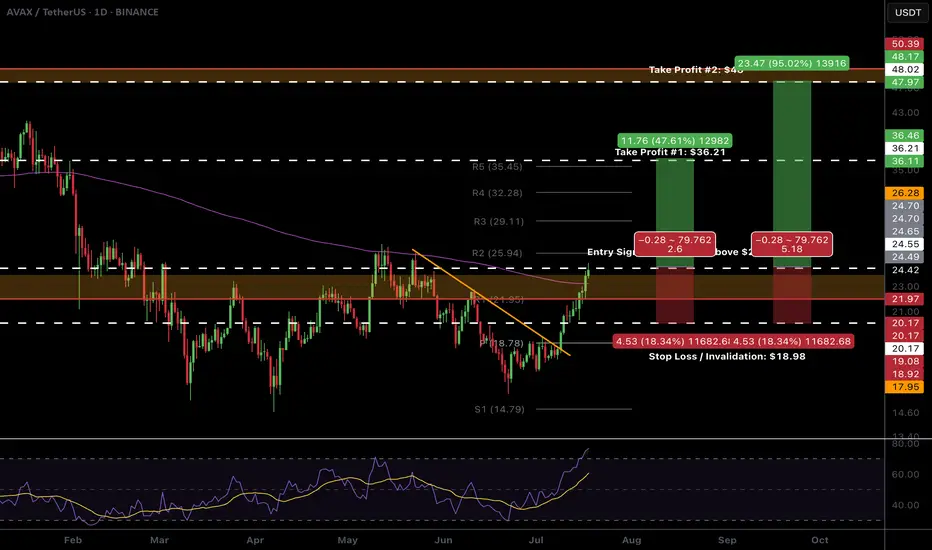
$AVAX Ready to breakout!CRYPTOCAP:AVAX looks ready to pop.
High Volume Node resistance and daily 200EMA is clear and now support. We don't want to see price rejected and moving back below this area.
The R5 daily pivot is my first partial take profit $35-36 followed by the major resistance High Volume Node at $48
Daily RSI is overbought with unconfirmed bearish divergence so watch out for this but should be good to run in the mean time. BTC permitting...
Safe trading
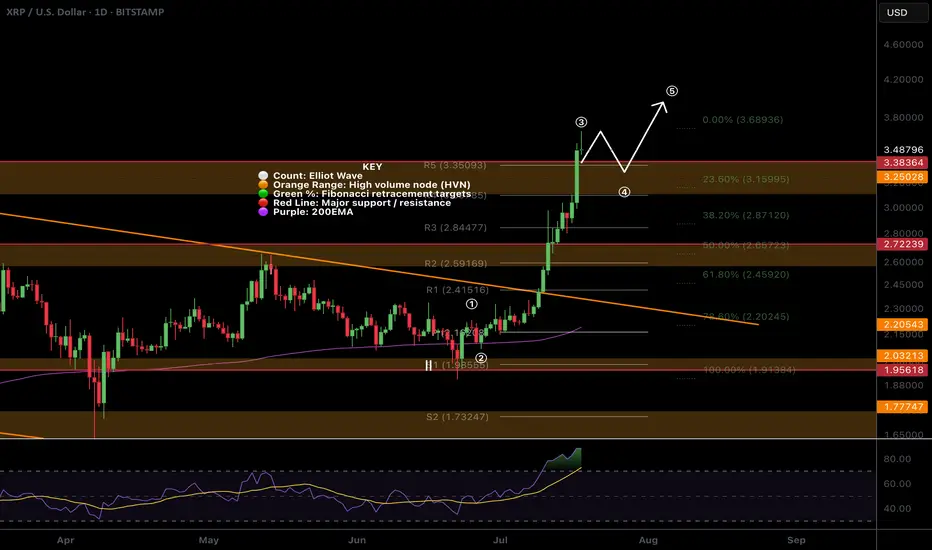
$XRP All time high! Time to sell or...?CRYPTOCAP:XRP appear to have completed wave 3 with a poke above all time high, typically this os behaviour of a wave 5.
The daily R5 pivot point has been breached so there is a significant chance of a decent pullback now but I wouldn't bet against the trend!
Wave 4 could be shallow, targeting the previous all time high, High Volume Node with waver 5 completing near $4.
Daily RSI is overbought but no bearish divergence yet which will likely emerge during wave 5.
Safe trading
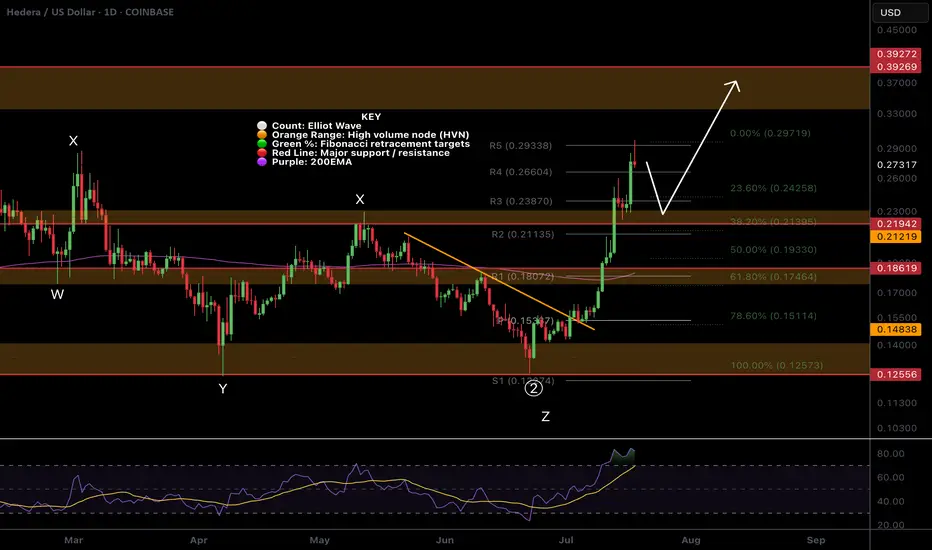
$HBAR Pull Back Started, What is the target?CRYPTOCAP:HBAR doing extremely well, the R5 daily pivot point has been hit and a pull back should be expected before continuation!
It appears wave 3 is now complete and wav4 i expected to pull back to the 0.382 Fibonacci retracement which adds confluence to the High Volume Node in the same place at $0.22 our previous take profit #2 target.
Daily RSI is overbought but no bearish divergence yet! Price behaviour can often pop above the swing high just made to trap new buyers before dumping hard! Watch out for that, that would be the bearish divergence print also.
The next take profit is $0.39
Safe trading
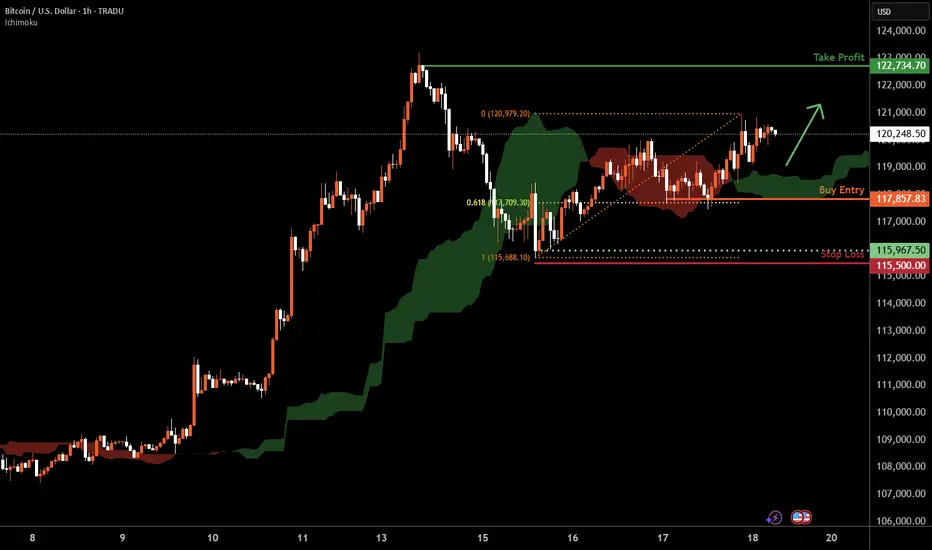
Bitcoin H1 | Falling toward a 61.8% Fibonacci supportBitcoin (BTC/USD) is falling towards a swing-low support and could potentially bounce off this level to climb higher.
Buy entry is at 117,857.83 which is a swing-low support that aligns with the 61.8% Fibonacci retracement.
Stop loss is at 115,500.00 which is a level that lies underneath a swing-low support.
Take profit is at 122,734.70 which is a swing-high resistance.
High Risk Investment Warning
Trading Forex/CFDs on margin carries a high level of risk and may not be suitable for all investors. Leverage can work against you.
Stratos Markets Limited (tradu.com ):
CFDs are complex instruments and come with a high risk of losing money rapidly due to leverage. 66% of retail investor accounts lose money when trading CFDs with this provider. You should consider whether you understand how CFDs work and whether you can afford to take the high risk of losing your money.
Stratos Europe Ltd (tradu.com ):
CFDs are complex instruments and come with a high risk of losing money rapidly due to leverage. 66% of retail investor accounts lose money when trading CFDs with this provider. You should consider whether you understand how CFDs work and whether you can afford to take the high risk of losing your money.
Stratos Global LLC (tradu.com ):
Losses can exceed deposits.
Please be advised that the information presented on TradingView is provided to Tradu (‘Company’, ‘we’) by a third-party provider (‘TFA Global Pte Ltd’). Please be reminded that you are solely responsible for the trading decisions on your account. There is a very high degree of risk involved in trading. Any information and/or content is intended entirely for research, educational and informational purposes only and does not constitute investment or consultation advice or investment strategy. The information is not tailored to the investment needs of any specific person and therefore does not involve a consideration of any of the investment objectives, financial situation or needs of any viewer that may receive it. Kindly also note that past performance is not a reliable indicator of future results. Actual results may differ materially from those anticipated in forward-looking or past performance statements. We assume no liability as to the accuracy or completeness of any of the information and/or content provided herein and the Company cannot be held responsible for any omission, mistake nor for any loss or damage including without limitation to any loss of profit which may arise from reliance on any information supplied by TFA Global Pte Ltd.
The speaker(s) is neither an employee, agent nor representative of Tradu and is therefore acting independently. The opinions given are their own, constitute general market commentary, and do not constitute the opinion or advice of Tradu or any form of personal or investment advice. Tradu neither endorses nor guarantees offerings of third-party speakers, nor is Tradu responsible for the content, veracity or opinions of third-party speakers, presenters or participants.
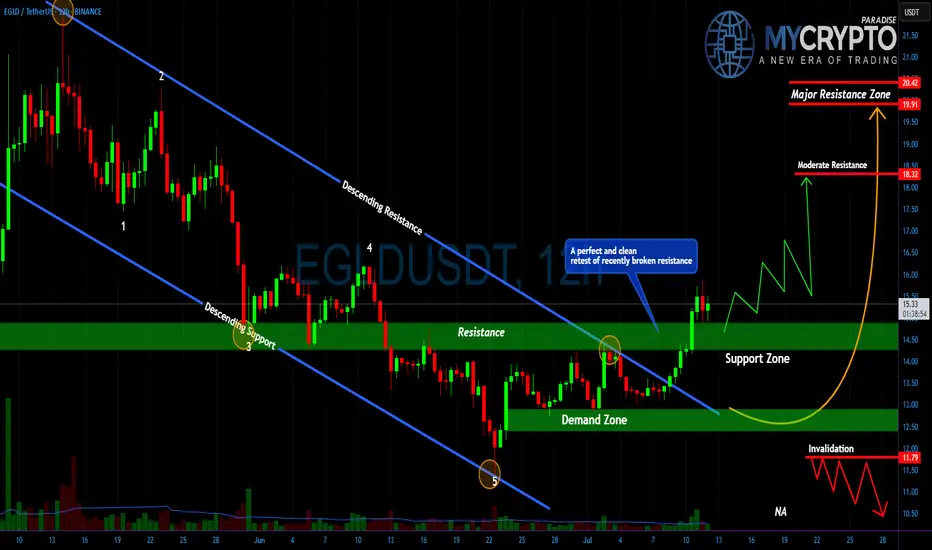
Most Will Get Trapped on EGLD’s Next Move Don’t Be One of ThemYello Paradisers, did you catch the EGLD breakout or are you still waiting for confirmation that’s already gone? While most traders are sleeping on this setup, it has just completed one of the cleanest breakout-and-retest patterns we’ve seen in weeks, and what comes next could leave many trapped on the wrong side.
💎#EGLDUSDT recently broke through its descending resistance with strength and has now retested that same level, which is acting as solid support in the $14.30–$15.00 range. This successful flip of resistance into support is a textbook bullish signal, and it’s holding beautifully indicating strong buyer presence and increasing the probability of continued upside.
💎If this support holds firm, #EGLD is eyeing a move toward the $18.00–$18.25 region, where moderate resistance is expected. A break above this could open the path toward the $19.90–$20.40 zone, a significant resistance level that may shape the next macro structure on this chart.
But it’s not all upside. If EGLD fails to hold the $13.00 level and especially the key invalidation point at $11.85 this entire bullish setup breaks down, and sellers will likely take control. The bullish momentum would collapse fast, and the door would open to much deeper downside levels.
MyCryptoParadise
iFeel the success🌴
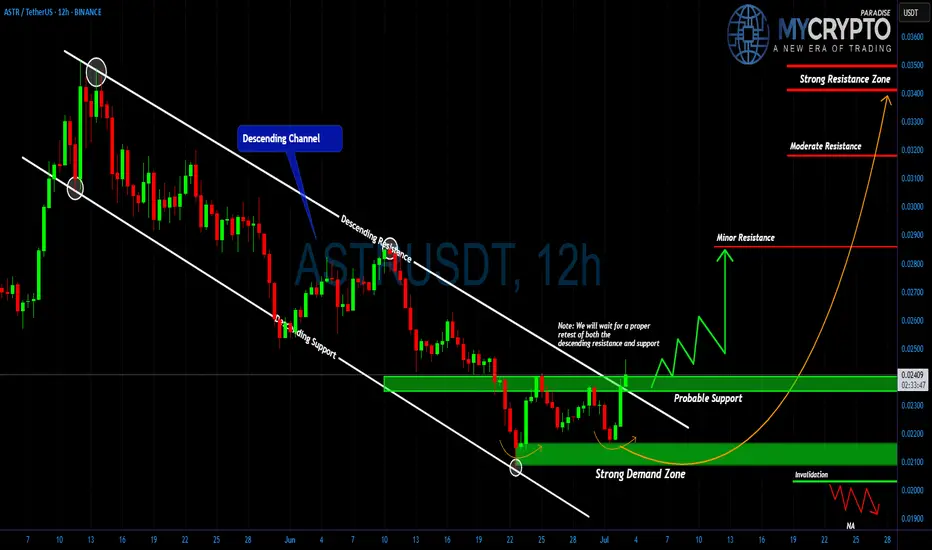
Is ASTR About to Break Out or Break Down? Don’t Miss ItYello Paradisers! Are you positioned correctly, or will you once again find yourself on the wrong side of the market when the real move begins? If you’ve been with us, you know we’ve been waiting for this kind of setup with patience, and now it's time to pay attention.
💎#ASTR/USDT has been moving inside a clean descending channel, respecting both the upper resistance and lower support lines consistently. However, recent price action suggests a potential shift in momentum. After tapping into the strong demand zone between 0.0200 and 0.0215, the price has shown multiple sharp rejections from the lows, indicating that buyers are quietly stepping in.
💎Currently, the price is attempting to break out of the descending structure. We are closely watching how it reacts around the 0.0240 area, which is now acting as probable support. A successful retest of this level would be a significant structural shift, and it opens up the path to retest 0.0280 our first minor resistance. If momentum continues to build and that level breaks, the doors are wide open toward the 0.0310–0.0320 zone, with the final strong resistance sitting around 0.0345.
💎On the flip side, invalidation occurs if the price fails to hold above 0.0210. A clean break below that level could send #ASTR back toward 0.0190, nullifying the current bullish setup. Until then, we remain cautiously optimistic, waiting for the market to confirm direction before committing fully.
Stay sharp, Paradisers. The market is about to pick a side and we’ll be on the right one.
MyCryptoParadise
iFeel the success🌴
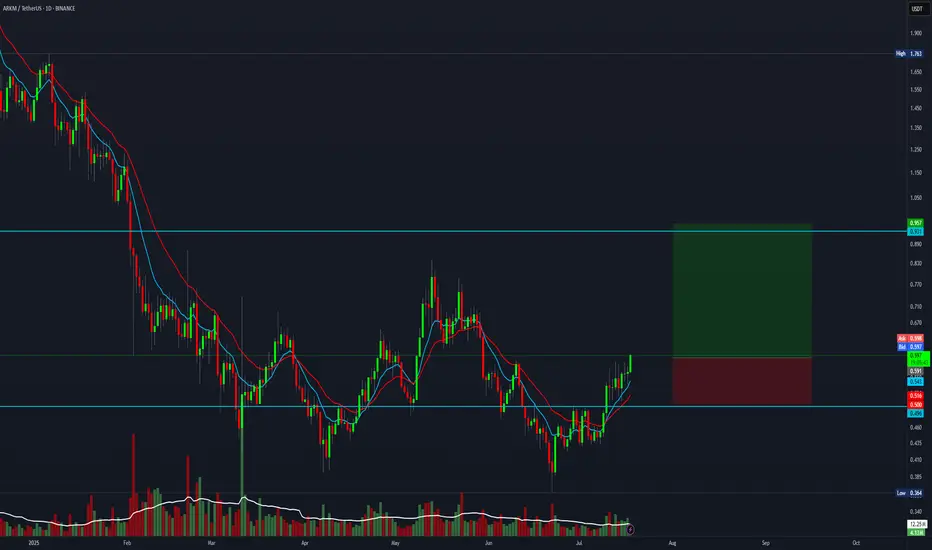
4:1 R:R trade setup for ARKMEverything is pumping right now, and this one also offers a 4:1 R:R setup.
Entry: 0.596
Stop Loss: 0.500
Target: 0.950
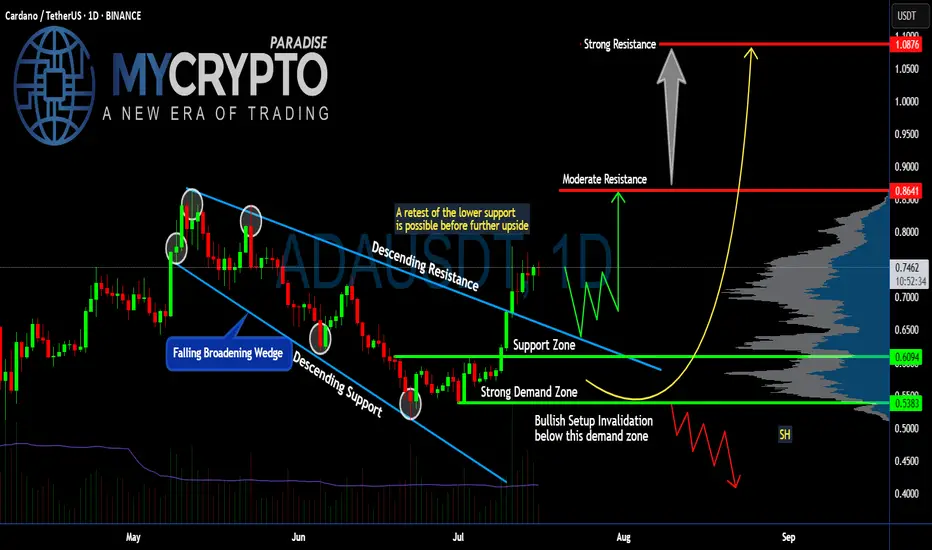
Is #ADA Ready For a Major Move or a Trap is Ahead? Watch this Yello, Paradisers! Is this breakout on #Cardano the start of a major upside move or just another bull trap waiting to flush out impatient traders? Let’s break down the latest #ADAUSDT setup:
💎After weeks inside a falling broadening wedge, #ADA finally broke above the descending resistance, signaling a potential trend reversal. The breakout above $0.70 has pushed the price toward the current $0.74 zone. The soaring volume and a positive broader market outlook reinforce our bullish bias. While this looks bullish, the key question is whether #ADAUSD will hold above its reclaimed support or retest lower levels first.
💎The structure is straightforward: #ADA reclaimed the support zone around $0.70 after bouncing strongly from the demand zone near $0.61–$0.60. This demand zone remains the critical area to watch—any healthy retest here would provide a high-probability continuation setup for bulls.
💎If buyers maintain control, the first target sits at the moderate resistance of $0.86. That’s where the next notable selling pressure is expected. But the real battle will take place near the strong resistance at $1.08—a zone where major distribution and profit-taking could occur.
💎However, the bullish setup becomes invalid if #ADAUSD loses the $0.61–$0.60 demand zone. A confirmed close below $0.538 would flip the structure bearish, signaling a potential continuation to lower lows.
Stay patient, Paradisers. Let the breakout confirm, and only then do we strike with conviction.
MyCryptoParadise
iFeel the success🌴
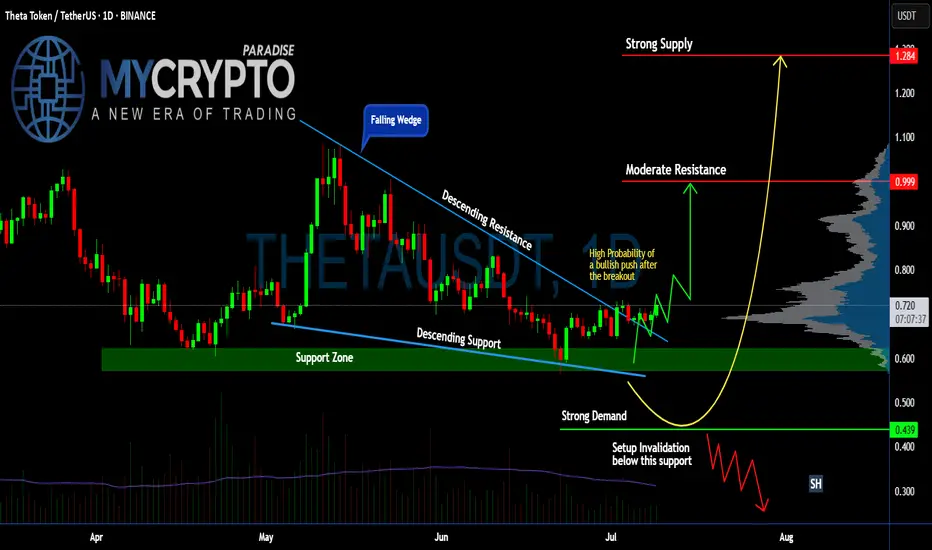
Is #THETA Ready For a Major Reversal or Another Fakeout ahead?Yello, Paradisers! Is this breakout the beginning of a bullish reversal for #THETA or just a setup to trap the herd before a sharp dump? Let’s break down the setup of #ThetaNetwork:
💎After weeks of slow bleeding inside a falling wedge, #THETAUSDT has broken out of this pattern. The price is currently hovering around $0.718, and it’s the first time in weeks we’re seeing real bullish momentum starting to build. The volume is slowly picking up, so the probability of a bullish push is higher.
💎A clean breakout above the descending resistance now opens the door toward moderate resistance at $0.999. That’s the next key hurdle where we expect sellers to show up. If bulls are strong enough to clear that zone, we’re targeting the strong supply level at $1.284, where significant distribution will likely begin.
💎Why this setup matters: The support zone between $0.60 and $0.66 has acted as strong demand for multiple weeks now for #THETAUSD. Price wicked into it again recently and got bought up quickly, forming a potential higher low. This kind of accumulation behavior often precedes a strong leg up if volume confirms the move.
💎However, if price loses the key support at $0.60, and more importantly breaks below the setup invalidation level at $0.439, we’ll treat this as a failed breakout and expect a deeper correction. That would bring us back into the lower demand zones, and we’ll sit on our hands until the next proper high-probability entry appears.
Stay patient, Paradisers. Let the breakout confirm, and only then do we strike with conviction.
MyCryptoParadise
iFeel the success🌴
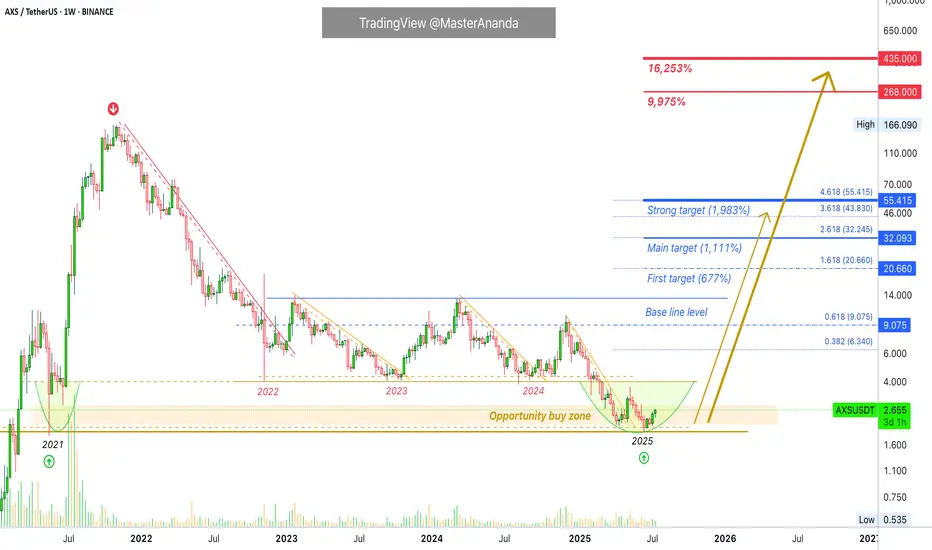
Axie Infinity Trades Within Opportunity Buy Zone · (PP: 16,253%)Right now Axie Infinity is trading within the "opportunity buy zone," this is a level just below the support zone from 2024, 2023 and 2022. It is trading in this zone searching for liquidity. Once this move is over, AXSUSDT will never be available at these prices in the future. The lowest will be the long-term support zone from 2022-2024.
Can Axie Infinity hit a new all-time high in 2025 or 2026? It is possible. But, in this chart setup and analysis we are focusing on high probability conservative targets.
"Back to baseline" is the very easy target. The first target after that sits around $20 for 677%. The main target goes higher, $32 for 1,111%. A strong target is $55 and this one opens up 1,983% profits potential.
A new all-time high can be $268 & $435. Really huge numbers. Just to give you an idea, the second one would be equal to 16,253% profits potential. The first one, $268 would be equal to 9,975%. This is theoretically possible so I don't want to commit to it but is good to keep an open mind with market conditions improving at the speed of light. If we can say there is such a thing.
Technical analysis
The bottom in 2025 matches the mid-way stop of the 2021 bull market. So this is an interesting and valid zone for a reversal.
We don't need to go any deeper in looking for reversal signals because a marketwide bullish bias is already confirmed. We've been bullish since 7-April 2025. Some pairs move first others later though and that's why some are already very high while others are very low. This is good because it gives us time to adapt to the market. If everything were to move together at the same time on the same date, it would be too late to buy anything low. Because the market cycles through different sectors, groups and pairs, we can buy the ones that are low now knowing that they will eventually move ahead. Everything grows. Everything will grow. The 2025 bull market is already confirmed.
Thanks a lot for your continued support.
Namaste.
The Correction Is Over! Bull FlagThe bull flag is a popular pattern. Everybody who has seen a chart is familiar with this pattern. It is a continuation pattern.
When I say that the correction is over I am not talking about the short short-term, I am talking about the bigger picture.
Yes, bullish action is expected to start and intensify within weeks, no!, days. But still, with thousands of projects, it takes lots of time before energy (money) reaches all sectors of the market. Allow for strong variations but the correction is over which means growth.
The correction is over means that the low is already in for most pairs and will be in, in the coming days for all remaining pairs.
The correction is over means that everything will grow, just as it did after the 7-April bottom low. The difference is that this new wave will be many times bigger and stronger than before.
TOTAL2 produced an advance from early April until late May. The retrace produced a bull flag continuation pattern. The pattern has run its course, it will resolve with a new phase of growth. It won't take long. It will be obvious in a matter of days. No need to pray, Crypto is going up.
Namaste.
XRP - One More Wave Soon!Hello TradingView Family / Fellow Traders. This is Richard, also known as theSignalyst.
📈XRP has been overall bullish trading within the rising wedge pattern in blue.
However, it is approaching its all-time high at $3.4.
🏹 The highlighted blue circle is a strong area to look for buy setups as it is the intersection of the orange demand zone and lower blue trendline acting as a non-horizontal support.
📚 As per my trading style:
As #XRP retests the blue circle zone, I will be looking for bullish reversal setups (like a double bottom pattern, trendline break , and so on...)
📚 Always follow your trading plan regarding entry, risk management, and trade management.
Good luck!
All Strategies Are Good; If Managed Properly!
~Rich
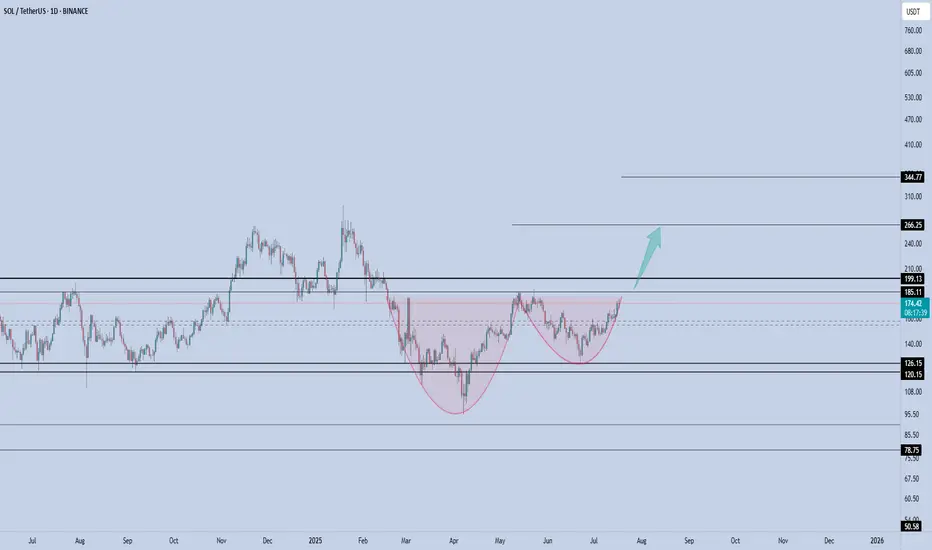
Solana - The Cup is Almost FullSolana is printing a textbook cup & handle formation on the daily, and price is now pressing against the neckline resistance near $185, just below the psychological $200 zone.
This structure reflects months of accumulation and rising momentum. A confirmed breakout above the $185–$199 resistance would likely trigger the next upward leg.
This setup signals trend reversal continuation, and if SOL closes above $199 on high volume, momentum traders may pile in quickly.
📌 Invalidation below $150 = pattern risk-off.
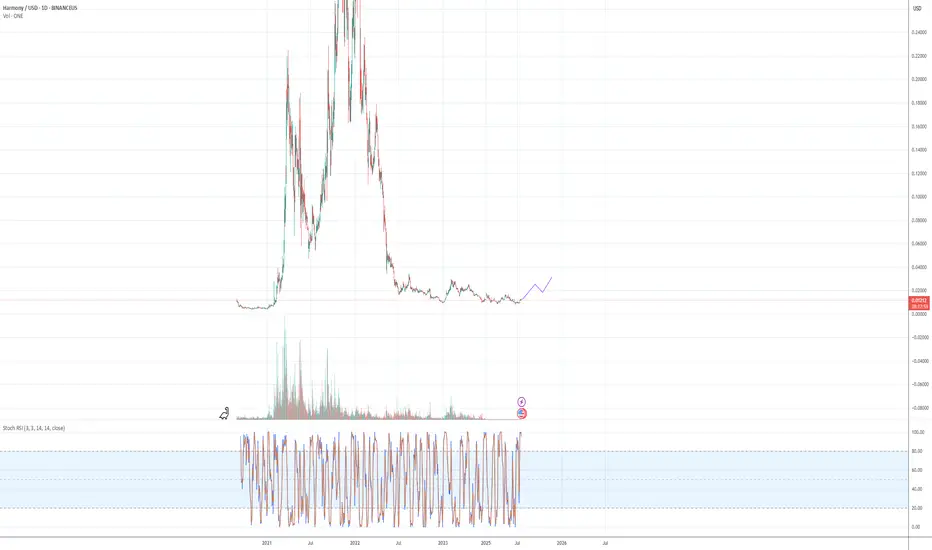
$ONE - HarmonyOne recovery will be EPIC, great devs/communityThey had a rough battle in 2021 after an incident that has been remediated but has strived to make things right with their Recovery ONE project. This was one of the most promising projects back then with insane transaction speeds and low fees. Looking very forward to where they go. This is my opinion only and should not be taken as investing advice. I do have a stake in HarmonyOne.
CRYPTOCAP:BTC , CRYPTOCAP:ETH , CRYPTOCAP:ADA
ETHUSD - Stretched price. Pullback to CL likelyPrice tagged the U-MLH, the stretch level.
Think of it like the 2nd STDV.
Now think Mean Reversion.
With such a stretch, price has a high chance to revert to the mean - down to the Centerline (CL).
What is this information good for?
a) take profit (...or 50% partial)
b) short on intrady signs
But if it is open and close above the U-MLH, then there's a good chance that price is advancing to the Warning Line, the extension of the Center to U-MLH.
Let's observe what happens.
