Why XRP Holders Are About to Get Super Rich!I believe XRP is heading into a mass adoption cycle—something even bigger than what Bitcoin saw in 2021. We’re looking at a truly sustainable growth pattern fueled by a longer accumulation phase and crypto being adopted and invested in by major institutions.
This means we could see XRP skyrocket to $22 as my lowest target— and potentially even well over $100 per coin . This coin is truly ready for massive things. Be prepared!
Let me know what you think: Will XRP crash? Or is it heading for mass adoption? Share your thoughts in the comments below.
As always, stay profitable,
– Dalin Anderson
Crypto
Notcoin 1884% BullishWave · Conservative Target · Will Go HigherThe first very easy target for Notcoin in the coming days will give you 230%, which is amazing because we only saw something similar in May 2024 and rather than just the start it was the end.
Then higher Notcoin will move, 100% certainty, to give you 640% profits or more. This is still easy and short-term, within 30 days or a month. Can extend a bit but there is more.
Long-term for us is within 6 months and this is the time-horizon for all targets on this chart to hit. Very easy indeed. We have 1,057% and 1,884%. Nothing extraordinary, in fact, these are just conservative projections. Notcoin is likely to move much higher in the coming months.
We looked at this pair and recommend 7X to maximize profits, it still isn't too late. If you do decide to approach this market with leverage after reading this, remember to consider the potential risks. Leveraged trading is for experts only and can result in total loss. I cannot be held responsible for your actions. If you lose money and I am responsible, then I am responsible also for any and all wins. But, we are all adults.
This is not financial advice. Just my opinion based on more than a decade of experience with charts, trading, Crypto and Bitcoin. This is not financial advice but you can bet your house that Crypto is going up. Time is running out, Notcoin will be really strong in this bull market. Do what you have to do to take advantage of this information. You will be happy with the results.
Thank you for reading.
Namaste.

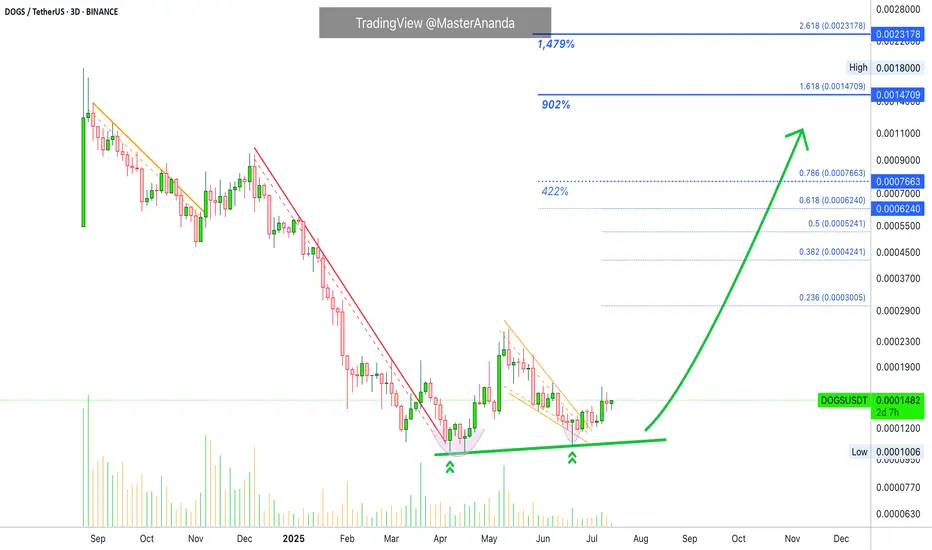
Dogs Update · 1,479% Easy Profits Potential TargetThe first target will be an easy target of 422%. We already talked about creating a position with leverage on this trade. This position is now live and secure, safe and effective, highly profitable with 8X.
Now we are looking at it again because there is still time to have a good entry before a major run. Time is running out though, we have only a few days left. After just a few days, prices will be 100% to 200% up, and then we will see more, more and more. Sustained long-term growth. Additional growth. Higher prices, higher highs, higher heights, forever more.
The bottom and reversal pattern here started in March and the bottom range was activated in February, which means the market is now 162 days sideways at bottom prices. This much consolidation at a market low will result in a massive wave of growth. This consolidation is already over, we just need to see the effect on the market, price and chart.
In a matter of days, one single candle with 3 digits green will change everything and this will happen to hundreds of pairs at the same time. Low prices will be gone but it will be the start of the market euphoria, major excitement and bullish growth.
This is a friendly reminder just to let you know that it isn't too late, but we are running out of time. You will do great. I promise. You have what it takes. It is simple when you know what to expect. Expect growth. Knowing this, you already won.
Namaste.
Arbitrum 1,322% Profits Potential · Easy · Crypto is Going Up!This will be intense, truly intense. Arbitrum will perform one of the strongest bullish waves in the entire market. Just one red session and we are back up, back green and ready to move. It will be huge.
This is a big project and yet, we have a standard, easy target, around 1,322%. Such huge potential for growth and there is no doubt now, 100% certainty; you can bet your house on it. We are going up.
When the market goes down, it is unforgiving, it gives no break. It goes down and down and down long-term.
When the market goes up, it is unforgiving, it gives no break. It goes up and up and up, many times higher and much more stronger than any previous bearish wave.
So the market is biased in favor of going up. Just as new all-time lows can be hit on a crash, new all-time highs will be hit during a major bullish impulse. Mark my words.
We are not talking about just "another bullish wave." Not just an "advance." We are talking about the strongest, biggest, longest, exciting and highly profitable bullish phase the Cryptocurrency market has yet to offer. We are talking about exceptional exponential growth. We are talking about a bull market like nothing you've seen before.
Get ready because Crypto is going up.
Namaste.

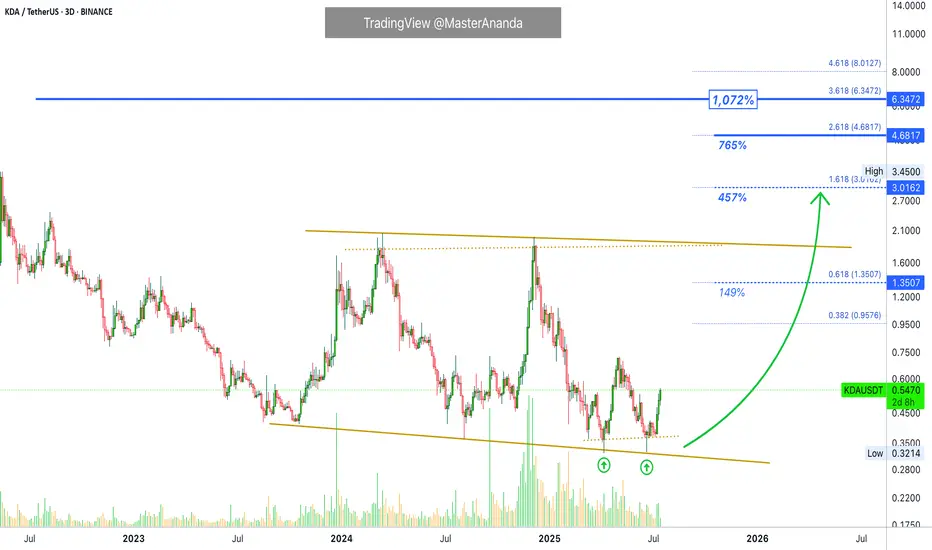
Kadena · 457% First Followed by Additional GrowthWhat should we be calling the first impulse? It is already here.
Good afternoon my fellow Cryptocurrency trader, the altcoins bull market is now.
It is already here. We are now seeing marketwide bullish action. There is only one variant present, one possible outcome only; increased bullish momentum. From now on, you will see daily bullish momentum grow.
Kadena is ready to move higher. The current move will produce a minimum of 450%, and this won't be all this project has to offer, this will signal the end of the first portion of the bullish wave. There will be additional growth after a stop after this first target is hit.
Since 9-July we have only full green candles. There will be more, more and more. Trust and you will be rewarded. Hold now, buy (yesterday), sell in several weeks or in a matter of months. You can sell—when prices are high—just to buy back lower when the correction comes. You can sell and move to a new trading pair because there will be hundreds of options blowing up.
This is just a friendly reminder. The time is now. 100% certainty.
We are moving ahead. Profits are yours to make.
Namaste.
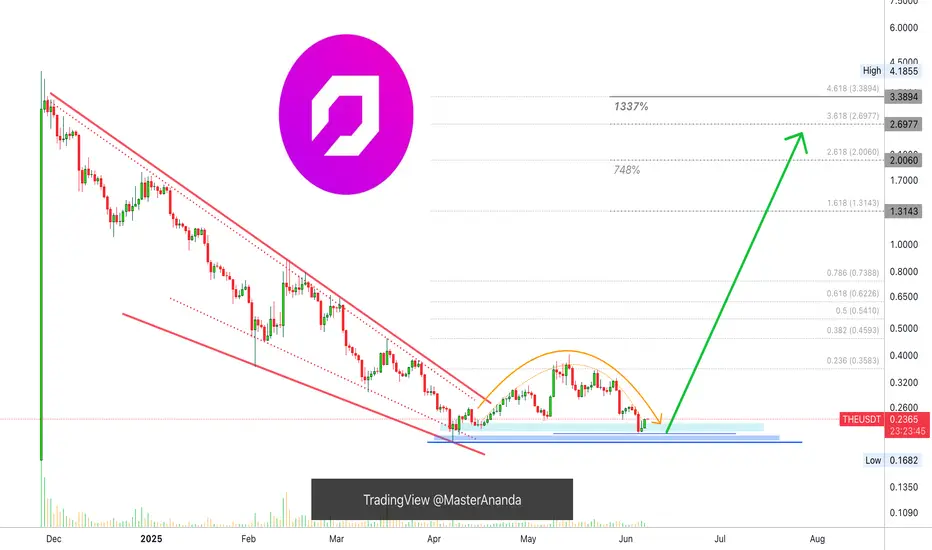
Thena: Hold Until The End (1,337% Profits Potential)Which one will you take? Endless opportunities the Cryptocurrency market has to offer; which one will you take?
Doesn't need to be just one can be many. You can choose many pairs to trade.
Countless opportunities are available now and these will be generating huge profits in the coming days.
The first burst forward will produce 100%, in 1-3 days. And this will be followed by sustained long-term growth. It will grow so much and for so long, that you will become bored. It won't be exciting anymore... Until the correction of course.
Thena here has more than 1,000% potential for growth. Right now this pair, THEUSDT, is sitting on a higher low or double-bottom, in this case it is the same.
This is the same pattern produced by Ravencoin, remember?
That project that grew more than 150% in a single day. "Altcoins Market Bull Market Confirmed, Ravencoin." And it is true, watch everything grow.
This same pattern is present on so many altcoins, not all of them but many and we know exactly what will happen next because what one does, the rest follows.
THEUSDT is about to go bullish, can take a few weeks or less, a few days.
When the bullish wave starts it will go for months, months of sustained growth. You simply hold until the end.
Thank you for reading.
Namaste.
HolderStat┆BTCUSD above $120BINANCE:BTCUSDT has surged past $129,000 following a breakout from long-term consolidation. The chart shows a clean continuation structure with the next resistance between $135,000–$137,000. Momentum remains on the side of bulls.

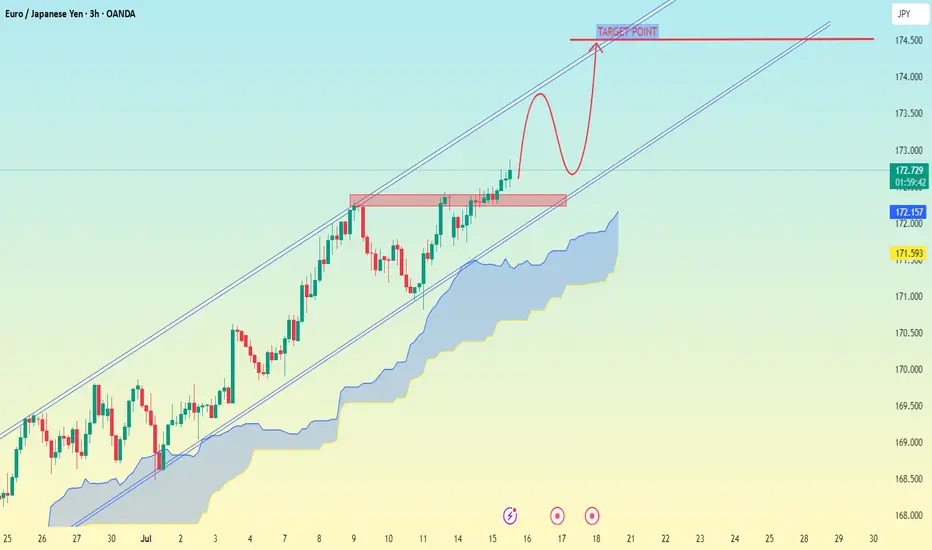
EUR/JPY (Euro vs Japanese Yen) on the 3-hour timeframeEUR/JPY (Euro vs Japanese Yen) on the 3-hour timeframe, the technical setup clearly suggests a bullish continuation inside an ascending channel, with a breakout above a consolidation zone.
---
🎯 Target Point (as marked on your chart):
Main Target Point: 174.500
---
🔍 Analysis Summary:
The price has broken above a resistance zone (around 172.700–172.900).
The chart shows a possible pullback and continuation setup (bullish flag/rounded retest).
The Ichimoku Cloud shows support below, suggesting bullish bias is intact.
The ascending channel remains unbroken and supports higher highs.
---
📌 Summary:
✅ Current Price Area: ~172.70
🥅 Target: 174.50
🔄 Potential Retest Zone: ~172.00–172.30 (marked in red box)
Would you like help with entry strategy, stop-loss placement, or trade management based on this setup?
HolderStat┆ETHUSD prepare for a breakthroughBINANCE:ETHUSDT is trending upward with strong conviction after triangle breakouts and clearing the $2,900 level. Structure points toward a move into the $3,300–$3,400 region. The trend is reinforced by repeated bullish retests and channel momentum.

HolderStat┆XRPUSD explosive growthBYBIT:XRPUSDT rallied out of consolidation and triangle formations, driving price quickly toward the $3.20–$3.40 range. The trend remains bullish with structure pointing toward continued upside as long as support holds above $2.80.

HolderStat┆SOLUSD above the $160 levelBINANCE:SOLUSDT has cleared key resistance at $159.78 after a series of consolidation patterns. The breakout has followed through into an ascending channel aiming at $185. Price remains structurally bullish with higher lows and strong recovery setups.

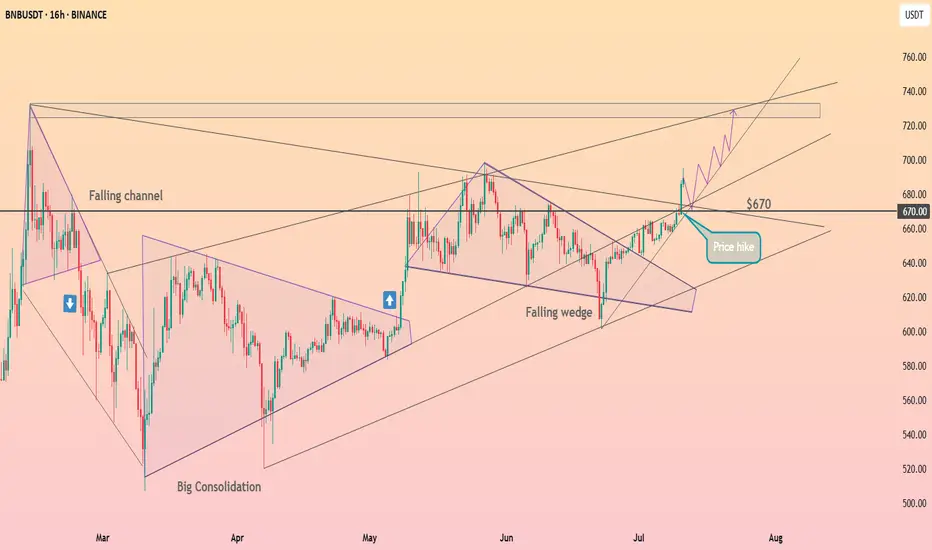
HolderStat┆BNBUSD breakoutBINANCE:BNBUSDT has reclaimed $670 support after breaking out from a long-term falling wedge. The bounce has been strong, and the rising structure now targets the $735–$740 resistance zone. Price action confirms bullish intent with consolidation beneath resistance before breakout.
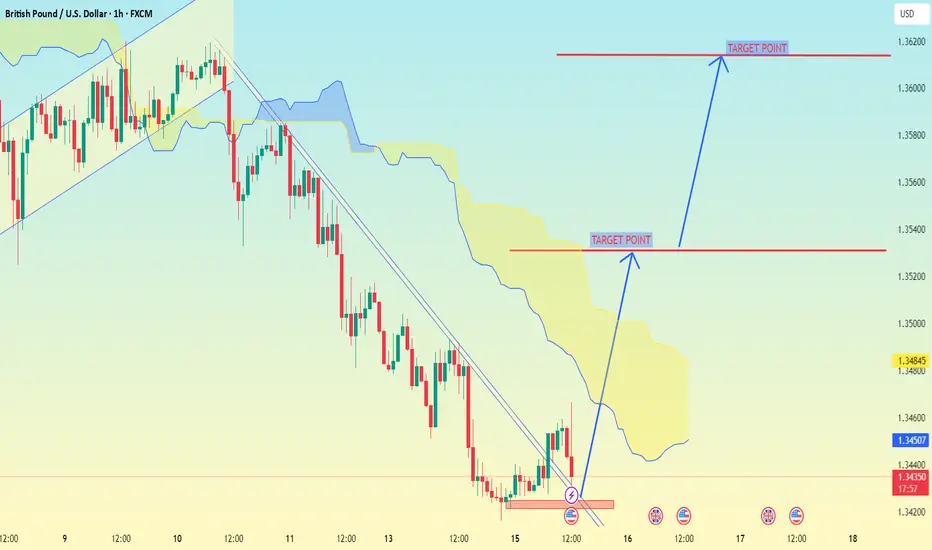
GBP/USD on the 1-hour timeframeGBP/USD on the 1-hour timeframe, here’s a breakdown of the target points indicated:
---
📍 Target Points (as marked on the chart):
1. First Target Point: Around 1.35200
2. Second Target Point: Around 1.36200
---
🧠 Analysis Notes (based on My setup):
Im used Ichimoku Cloud and a trendline breakout, which suggests a bullish reversal.
The price has broken out above a descending trendline and is possibly targeting the top of the cloud and further if momentum sustains.
The two target points represent:
First resistance level (likely top of the Ichimoku cloud).
Second resistance level (recent high before the downtrend began).
---
📌 Summary:
Immediate target: 1.35200
Next potential target: 1.36200
Let me know if you want stop-loss suggestions or a risk-reward analysis.
Did Bitcoin Just TOP OUT ??????
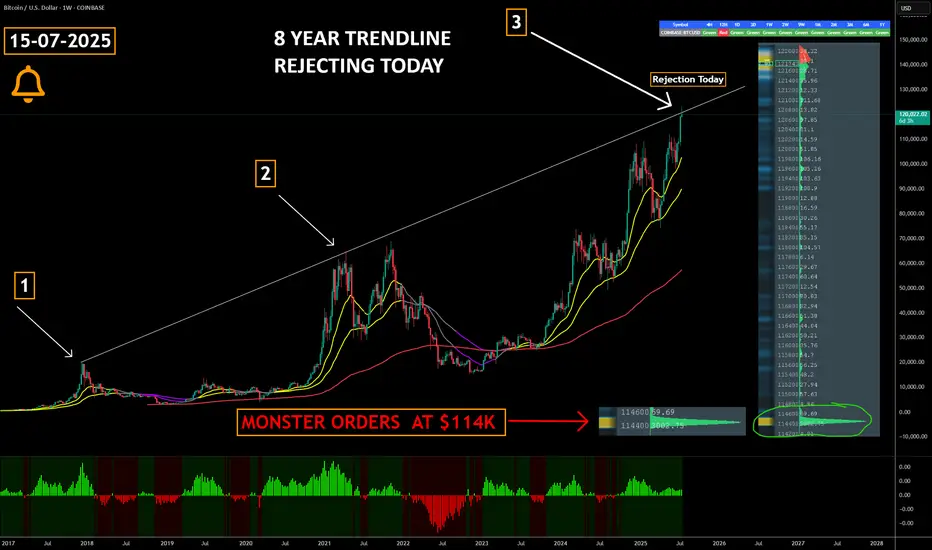
COINBASE:BTCUSD has just collided with an 8-year rising trendline that capped the market’s last two cyclical peaks—historically, this level has triggered multi-month corrections and Bear Markets.
Triple-test significance : a third touch of a long-term trendline ➜ heightened odds of a reaction; failure to break cleanly often confirms a major top.
Watch for confirmation signals —weekly bearish RSI divergence, waning volume, or rejection wicks can validate a reversal scenario.
Breakout = regime change : a decisive close and hold above the line flips it to support, opening the door to fresh price discovery and potential parabolic upside.
Large Orders at $114k create a visible demand wall in the order book, signalling that whales / institutions are ready to absorb a dip and accumulate at that level.
Risk-management alert : consider tightening stops, reducing leverage, or hedging until trendline fate is resolved.
The buy pressure has been relentless but this is always worth paying attention to
Marty Boots | 17-Year Trader — smash that , hit LIKE & SUBSCRIBE, and share your views in the comments below so we can make better trades & grow together!
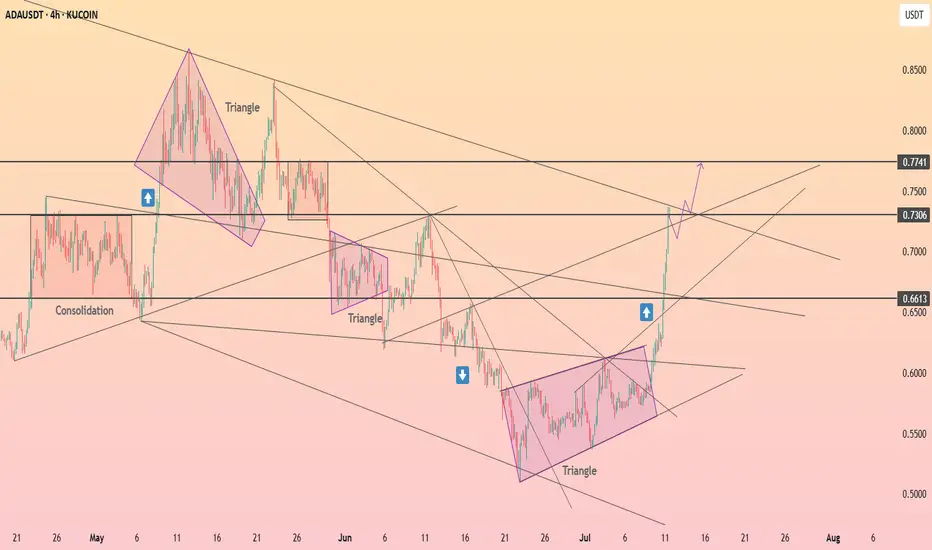
HolderStat┆ADAUSD seeks to $0.774KUCOIN:ADAUSDT recently broke out of a multi-week triangle formation on the 4H chart. The clean break above 0.66 has invalidated the previous downtrend and triggered a new leg higher. With ADA currently riding within an ascending channel, the path toward 0.73–0.75 remains open as momentum continues building.
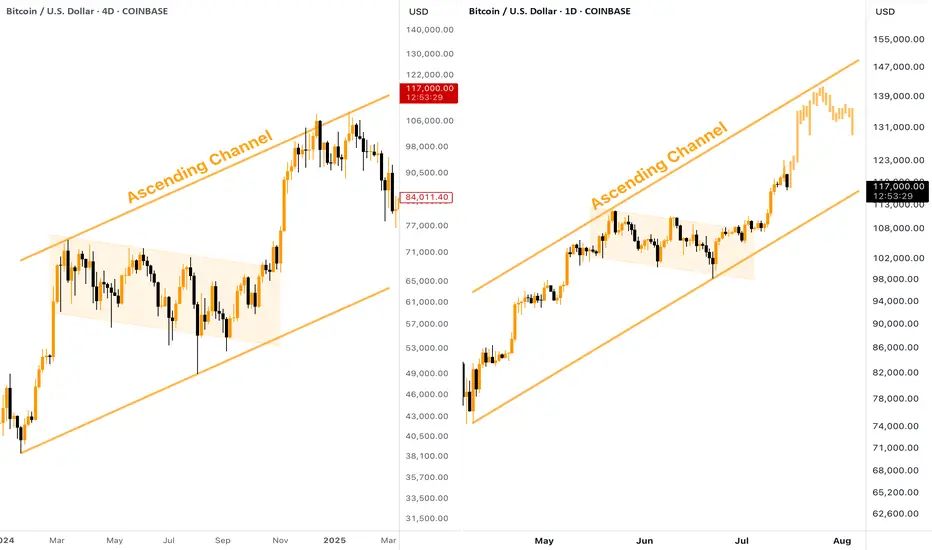
[BITCOIN] - Where is Potential TOP (ATH) of the Bull Cycle?Many people wondering where is the potential TOP of the current Bitcoin Bull Run? Besides setting a Fibo Retracement, we can take a look at the past. The current situation on CRYPTOCAP:BTC chart reminds me of what we've seen in the end of 2024, here is why:
Big ascending channel, price perfectly moves inside without breaking borders
Descending consolidation inside the bull flag
Strong breakout and pump towards the resistance of the channel
👉 According to this pattern, the target for the current Bitcoin upward move should be located in the $140,000 zone. Keep this in mind when planning your trades.
$XRP All Tie High After Shallow Pullback?CRYPTOCAP:XRP had a fantastic week smashing all resistances. I am looking for a shallow pull back to test the High Volume Node support at $2.7 at the .236 Fibonacci retracement before continuing to challenge the all time high.
Wave (3) of a motif wave appears complete adding confluence to a shallow retracement for wave (4).
Daily RSI is extremely overbought.
Safe trading

$HBAR Weekly Pivot Time...In classic CRYPTOCAP:HBAR fashion what a powerful move this week! Moves like this leave me skeptical of continuation straight away as you often get a pretty decent pullback afterwards before the next leg up. However how many times have you seen a move like this that completely unwinds weeks later and goes lower?
Wave (3) looks truly underway after wave (2) tested the High Volume Node and 'Golden Pocket' 0.50.618 Fibonacci retracement as support on weekly bullish divergence from the RSI.
The weekly pivot is now resistance and it already proving itself. If price continues the all time high is next resistance and price has a weekly R5 pivot target of $1.2 while the Fibonacci extension targets have a minimum of $5.2..
Analysis is invalidated below $0.12
Safe trading

$FET Does Zooming out look better?NYSE:FET has been underperforming lately and the local chart looks trash so I wanted to zoom out to give us all some context on the larger picture which hasn't really changed.
Price appears to have completed wave II at the High Volume Node (HVN) support and 0.5- 0.618 'Golden Pocket' Fibonacci retracement and wave 3 is underway but finding local resistance.
Pivots are warped due to the strength of the move last year so wouldn't count them as reliable so focusing on support and resistance. The megaphone pattern is clear and the next area of resistance when FET starts moving is the $1.2
Weekly RSI is decreasing and is attempting to cross bearishly. If Bitcoin has a significant pullback I would expect new lows for FET at this rate. I have a neutral stance at this point.
Analysis is invalidated below $0.546
Safe trading
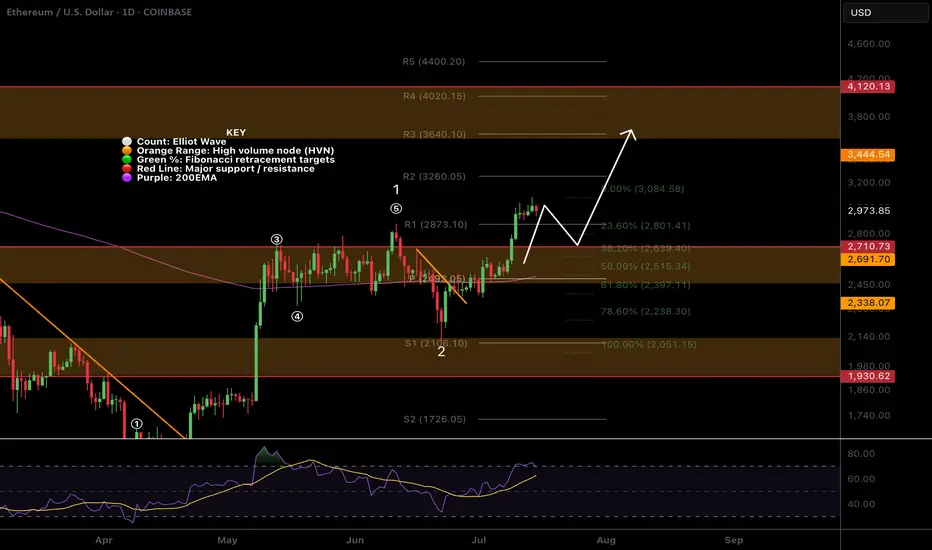
$ETH Pullback to $2630 Support?CRYPTOCAP:ETH has a great week pushing through resistance and making new local highs after testing the daily 200EMA and daily pivot as support.
Price is likely to retest the swing high and previous resistance as support around $2600-2700, also the .382 Fibonacci retracement.
RSI is printing daily bearish divergence in overbought from the wave (3) top to current as it did at the wave (5) top seeing large rejection. The retest of $2600 would reset RSI.
Price is ultimately set to test $3600 as the next resistance if the Elliot wave count is correct.
Analysis is invalidated below $2050
Safe trading
$AAVE Macro outlook Grinding the PathCRYPTOCAP:AAVE continues to grind higher poking above the swing high which was rejected to test the weekly pivot and .382 Fibonacci retracement as support successfully. This was a shallow wave 2 so I am expecting a big thrust up in wave 3. However, the alternative count could suggest a wave is only completing now with wave 2 actually being wave (4) of 1, this would be the case if price falls back below $171.
Weekly RSI is still bullish with plenty of room to rise ahead of it. It printed a weekly bullish divergence at the wave II low and major support high volume node.
AAVE is definitely one too watch this cycle.
Safe trading

SANDBOX RALLY..Since 2021, SAND has been quiet but now holds strong support at $0.22. I believe a rally to $2.70 is likely in the coming months.
(ITS NOT A FINANCIAL ADVISE)

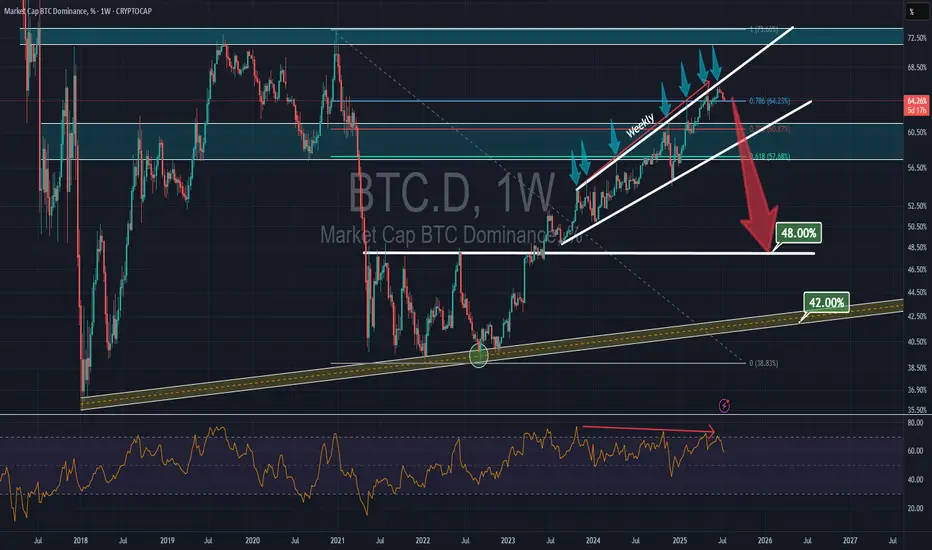
Bitcoin DOMINANCE dropssssBTC dominance has been within a rising channel since October 2023, showing a significant bearish divergence on the weekly RSI. After the seventh rejection from the channel's top, it may drop to the major support at 48%.