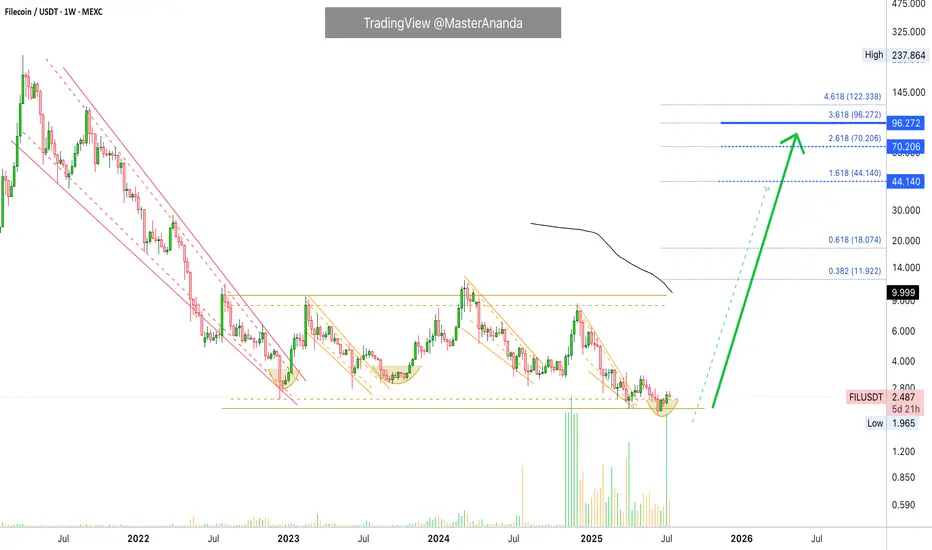
Filecoin Hits Bottom · 3 Years Long BD · Volume Signal · MACD &I think what is really nice about MEXC is that it truly reveals the bottom through volume. The changes in trading volume in this exchange are so pronounced that you can never go wrong. Look at Filecoin, extremely high volume in November 2024, right before a bullish wave. Then again, incredibly high volume last week, July 2025, right before a... Right before a major, major bullish wave, or else trading volume wouldn't be so high. It is this high because whales are buying with margin on this exchange.
Ok. A classic signal, 100% original. MA200 starts curving down strong; prices start to move up to meet this indicator, there will be a cross. So when MA200 starts diving deep down coming from a high point, the low is in, the bottom is in and the trend is about to change from bearish to bullish. Filecoin is about to start growing.
These are two signals, both very strong. Let's add another one. Bullish divergence with the MACD and RSI. Weekly, long-term. This makes these signals very, very strong.
FILUSDT weekly RSI hit bottom June 2022, in June 2025 (three years later) it produced a higher low.
FILUSDT weekly produced a major low December 2022, in June 2025 it produced a lower low. That's a strong divergence.
FILUSDT weekly MACD hit bottom February 2022. There is a extreme higher low in 2025 and also a bullish cross.
Needless to say, the bullish cross indicates the market is about to change. This matches the volume signal, the MA200 signal, marketwide action, the bullish divergence with the RSI, Ethereum and the rest.
Everything is bullish if you look deep enough. Bullish means potential for growth when prices are low. Bullish potential. That's what we are looking for. Filecoin is about to turn-up.
Namaste.
Crypto
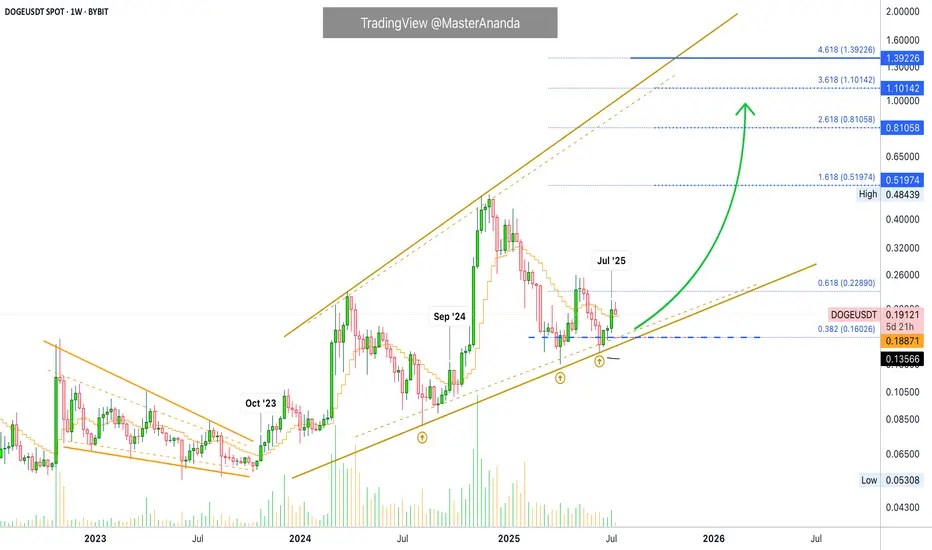
Dogecoin's Bullish Wave Over? Higher High Beyond $1.11111Nope, it is only getting started... Do you see that tiny speck of a black line on the chart? Way below the current candles around 0.135. That's MA200 weekly. Dogecoin is on the bullish zone 100% already confirmed. The bullish wave is only getting started.
DOGEUSDT is trading weekly above EMA13. Watch what happened in September 2024 when Dogecoin broke above this level. Or further back, October 2023. Both instances, there was a bullish impulse; both instances, a higher high.
Dogecoin moved and closed above EMA13 last week, July 2025. Guess what will happen next? A new bullish impulse and a strong higher high.
Patience is key, the market is set to continue growing long-term. No, the uptrend is not over, it is only getting started.
Thanks a lot for your continued support.
Namaste.
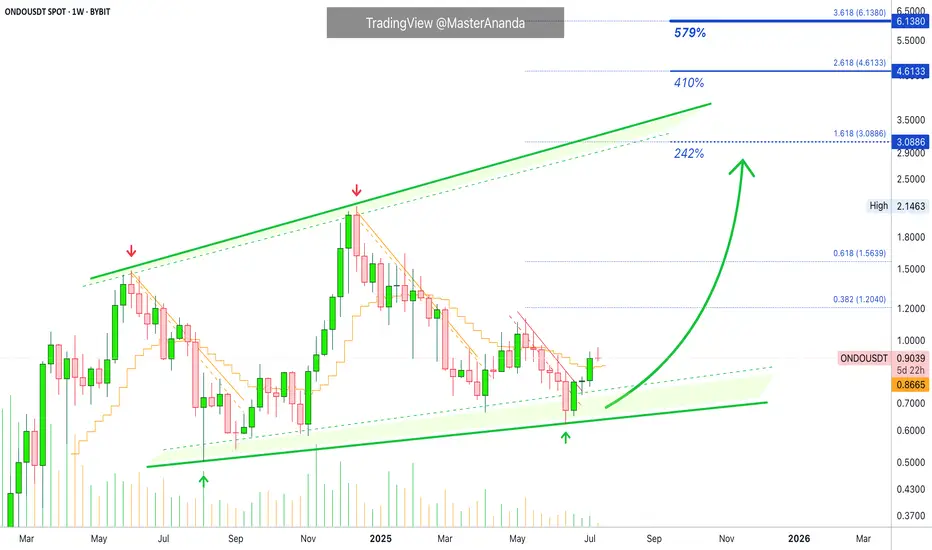
Ondo: The Bullish Wave is Over? 410% - 579% Profits PotentialONDOUSDT managed to produce three weeks closing green with the last one conquering EMA13. When this happened back in November 2024 there was a period of continued growth. Look at it in this way; the week is young and the market is taking a break, growth will resume in a matter of days. This same week more green and continued green long-term.
When ONDOUSDT broke above EMA13 last year, it produced a total of six weeks of straight up. Now, back then we were looking at a small jump, today we are looking at a very strong bullish impulse. The 2025 bull market in full force.
Three green weeks is only the start. We are about to experience 12-24 weeks of bullish action. We are looking at the bottom, bullish momentum is yet to grow. It is still early, but early won't be a reality for too long. Buy and hold.
We have two targets that are interesting: 410% and 579%. These can be hit within 3 to 6 months. Allow for retraces and swings on the way up.
Namaste.
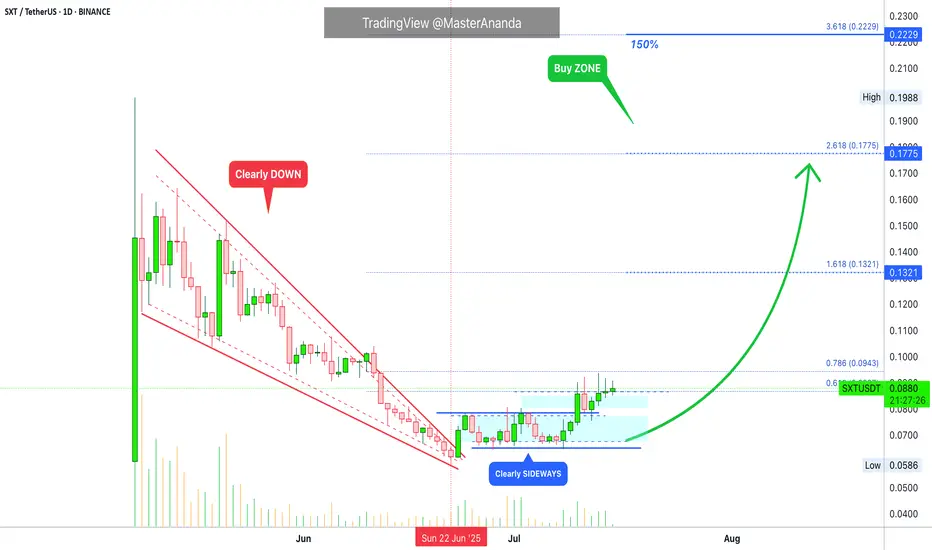
Space and Time: Trading Strategy · 1 BTC = 2.5 BTC (PP: 150%)Are you interested in a double-up?
Let's use round numbers to keep it simple.
Trade: Buy 1 BTC STXUSDT = Get 2.5 BTC (150% profits).
Time duration: 20-40 days.
Risk: Very low (time).
The risk can be calculated in time. Since this is a spot trade, you cannot get liquidated. In the worst case scenario, you wait. This is the only risk if the chart breaks down. If it works as planned, you can get 150% profits (250% earnings) by selling on target.
Time duration is "short-term." Which is within 30 days. Here I set 20-40 days to allow for any unexpected variations.
The trade is any amount you want. $1,000 USDT bought at current price, say 0.0890, would result in $2,500 USDT if selling happens at 0.2229. This is just an example of course for illustration purposes.
The trick is to be ready to wait. If waiting is hard, one can be use diversification to be entertained. Say, $250 USDT on four different pairs that have good potential for growth. Can be $2,500 USDT by 4 if the capital is $10,000. Or $10,000 USDT by 10 if the capital is $100,000. There are many different ways to approach the market.
A different approach: $10,000 in. The market (pair in question) grows 25%. Close position (sell). Result = $12,500. Find new pair and repeat.
The stop-loss can be a tight one at 5%. If prices drop 5% close position. Result = $9,500. Try again with a different pair. The stop-loss can be set at 10%, 15%, 20%, based on the chart, etc.
There is also a trailing stop. Adjust the stop below a certain level as prices rise, after you catch the rising trend. This is a bit more advanced and it is mainly used by profitable traders.
Patience is key. If you can wait, you can win.
Space and Time (SXT) is set to grow. How you approach this market is up to you. Remember to do your own research and planning. This is not financial advice. I am sharing for learning and entertainment purposes only.
Thank you for reading.
Namaste.
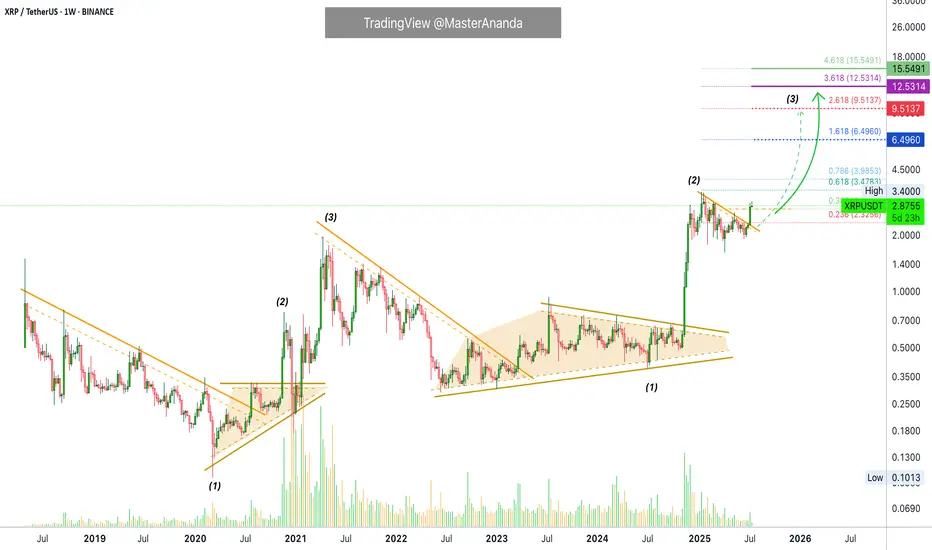
XRP $6.5, $9.5, $12.5 & $15.5 · Which One?XRP broke a small local downtrend and managed to close above a small resistance zone around $2.76. It managed to do this on a full green candle with rising volume.
XRPUSDT weekly is currently trading above all moving averages, extremely bullish: MA200, EMA377, EMA233, EMA89 and the rest.
If we look at a bull market cycle as a series of three steps, we have the first two missing the last one. Compare current action with 2021 while noticing the 1,2,3 numbers on the chart. This leaves us wondering about the next target: How high can XRP go in its next bullish move?
It seems something extraordinary is brewing behind the scenes, I can feel it. What we've been saying all along but rather than just words, a new feeling came up. "It is not the same to live through an event vs talking about it." That kind of feeling.
I can continue to say that market conditions are extremely positive now especially when we compare it to several years ago. But we have not seen the effect this positive conditions will have on the market, the price of the different projects and the charts, but we are getting close.
XRP has big plans and continue to grow, expand and evolve.
The 2021 bull market from bottom to top produced more than 1,800%. In 2025, if we start counting from the July 2024 low, a target of $6.50 would mean a total of ~1,585% growth. Market conditions are better now so we can aim higher, expect more.
A target of $9.51 sounds great, this would mean a nice ~230% from current price and from the same low as before, a total of ~2,400%. This sounds better but we can do more.
The next two targets based on an extension of the current trend would lead to $12.5 and $15.5. I'll let you calculate the potential yourself.
$6.5, $9.51, $12.5 or more; whatever the market ends up giving us, we are happy to be part of this adventure and we are always grateful for the amazing results.
Aim high. I will be here reading the charts live when we are getting close to the top. There will be time to sell, time to adapt, time to decide. There will be enough time for everything if you start now. Prepare now and success is yours.
We are early for the last phase of the XRP 2025 bull market. The first half is in, we are due the second half; it will be great.
Namaste.
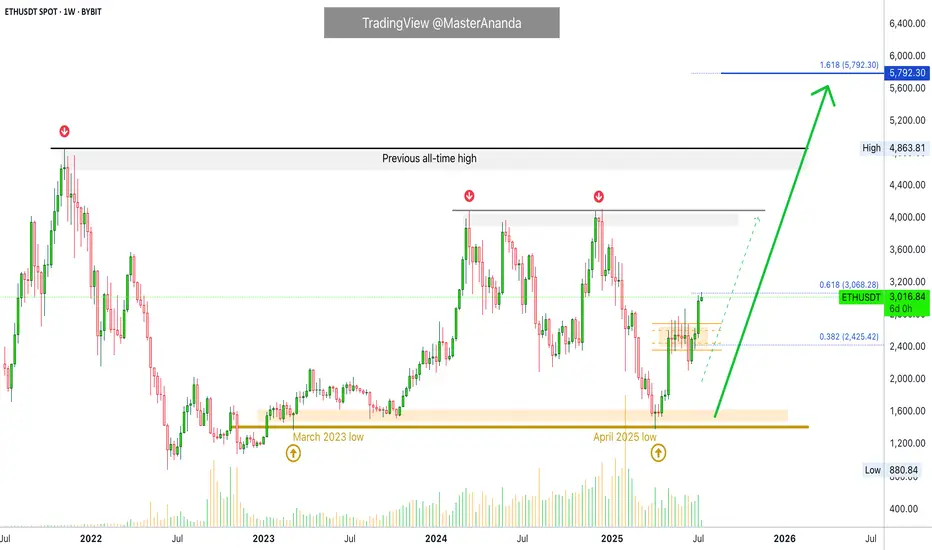
Can a Bear Market Start With Ethereum At $3,000?Ethereum produced sideways action for 49 days, 7 weeks. Immediately after seeing this I realized the next logical step was a bullish breakout, and the market moved up. But this isn't all. Ethereum is still trading at $3,000, more than $1,800 away from its all-time high.
Now, thinking about the doubt that always creeps up when the market becomes bullish confirmed, I want to clear things up if at least for you. While others can continue to doubt and will continue to do so, many others will even SHORT and lose everything, you will be happy knowing that the market will experience additional growth. You will also be making profits as the market grows. You will be happy because you know for a fact, based on data, that we are set to experience sustained long-term growth.
A bear market can only develop after a bull market. A bull market ends in a major high or new all-time high. Current conditions for ETHUSDT are far from being "peaky." There is no new all-time high. Actually, prices are still relatively low.
First Ethereum needs to challenge its previous all-time high, create a new one and then we can talk about a bear market or correction. We know for a fact that Ethereum is bullish based on recent price action and the chart. We know for a fact that Ethereum will grow because Bitcoin is already high up. Ethereum is the #2 Crypto and what Bitcoin does it tends to follow.
Bitcoin is super strong but this is not to be confused as weakness. Weakness comes when the market has been growing for too long, growth becomes heavy and a drop happens next. Strength happens when the market has been sideways for months, breaks up and produces a major advance (now). This type of pattern predicts additional growth.
Bitcoin is the king and what Bitcoin does the rest follows. You can expect additional growth.
The reason why the bullish cycle is not yet over is because prices are still too low. Many altcoins are trading near all-time lows. Think about it. A bear market develops from all-time highs and bull markets develop from all-time lows. We are only at the start of a major bullish cycle, phase and wave.
The proof is in the chart. A major low was hit 7-April 2025, the lowest since March 2023. This marks the end of the correction and the start of the 2025 bullish phase. I don't know if Ethereum will grow for years or only for a few months. I know with 100% certainty that the Cryptocurrency market will continue to grow. You can bet your house on it.
Thanks a lot for your continued support.
Namaste.
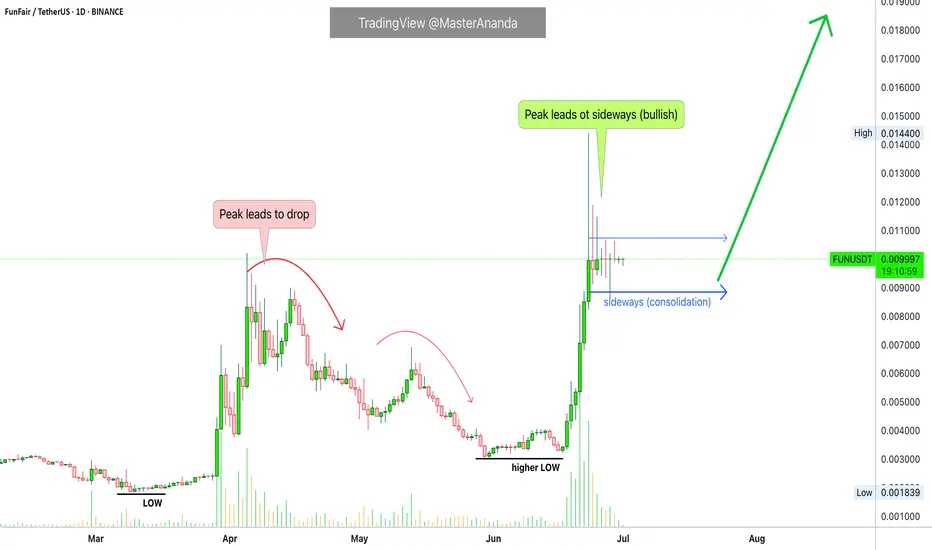
Altcoins Bull Market Confirmed —Fun TokenEvery time there is a strong rise immediately what follows is a correction, always, unless of course you are in a bull market. Here you have the most revealing signal of all: Price stability after a major rise, sideways rather than bearish.
Fun Token (FUNUSDT) produced a more than 340% bullish wave. What happens right after the peak? If you guessed a drop I don't blame you, that is what normally happens but here things are different. Since the market is growing and set to grow strong for long, after this major rise instead of a crash we have consolidation, sideways. This reveals that participants are not selling, they are not selling because they know the rise is not over, there will be additional growth.
Go back in time and look at 30-50 altcoins and see what happens after each strong bullish wave, a correction. Now, do the same but focus on a bull market; what happens after a strong bullish wave? Some consolidation followed by additional growth.
The altcoins bull market is already confirmed.
Thanks a lot for your continued support.
Namaste.
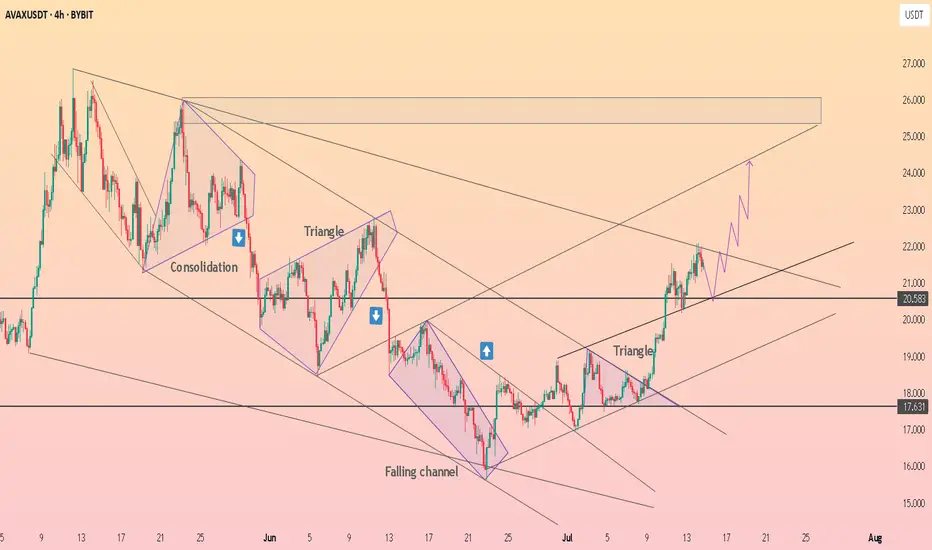
HolderStat┆AVAXUSD retest of trend lineBYBIT:AVAXUSDT has climbed steadily through a falling channel breakout and now trades firmly above $20.50. With triangle breakouts behind it, the next likely zone is $24–$25. Price action is aligning with bullish continuation patterns.
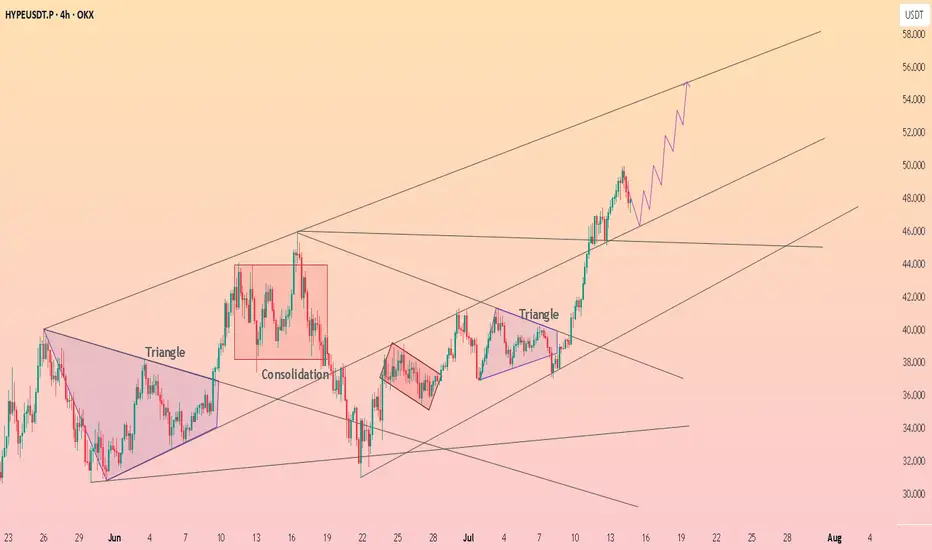
HolderStat┆HYPEUSD has consolidated above the trend line$OKX:HYPEUSDT surged after a breakout from a well-formed triangle and a bullish retest of prior resistance. The chart shows a textbook ascending channel with the price climbing from $38 toward the $56 upper range. If momentum remains, a breakout beyond the top boundary is likely.
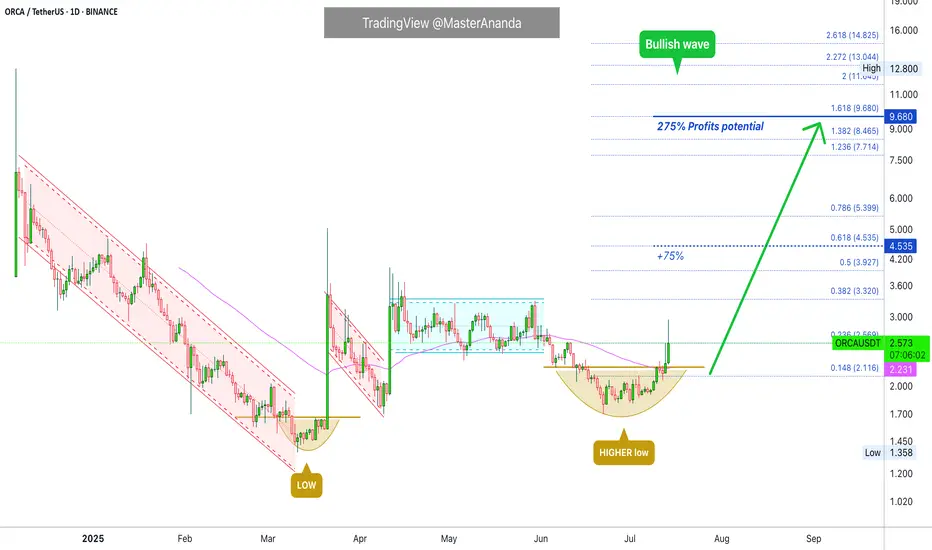
Orca Moving Fast, Altcoins Market Heats Up (Easy 275% PP)Think fast, act fast, move fast! The altcoins market is heating up and it is not for the faint hearted. Either you take action now, fast, or the market moves away. Low prices to be available never again...
Good afternoon my fellow Cryptocurrency trader, I hope you are having a wonderful day.
A bull market means up. It means growth, up, up, up, up and then higher. Yes, some pairs will retrace but that is because these pairs already moved ahead. Once the action stops on one group, another group moves forward and this pattern will continue to repeat long-term. What this means is that there will always be something going up. And this is awesome if you are a trader as more opportunities become available every single day.
Here ORCAUSDT is already bullish, we have the higher low and the full green candle above EMA55 on the daily timeframe. This is as good as it gets. An advance is confirmed so this becomes an easy hold. But, since we are looking at it short-term, after our target hits we collect profits and move on.
Not all trades are short-term not all trading works this way. We have long-term chart setups, leveraged positions, short-term spot and so on. Make sure not to confuse one with the other to avoid mistakes.
Some projects we catch the bottom and let the bull market unravel, others we enter "in-the-action" collect profits and move on.
Whichever way works for you, that's up to you. Some people like to be relaxed while trading others want to take action.
Thanks a lot for your continued support.
Namaste.
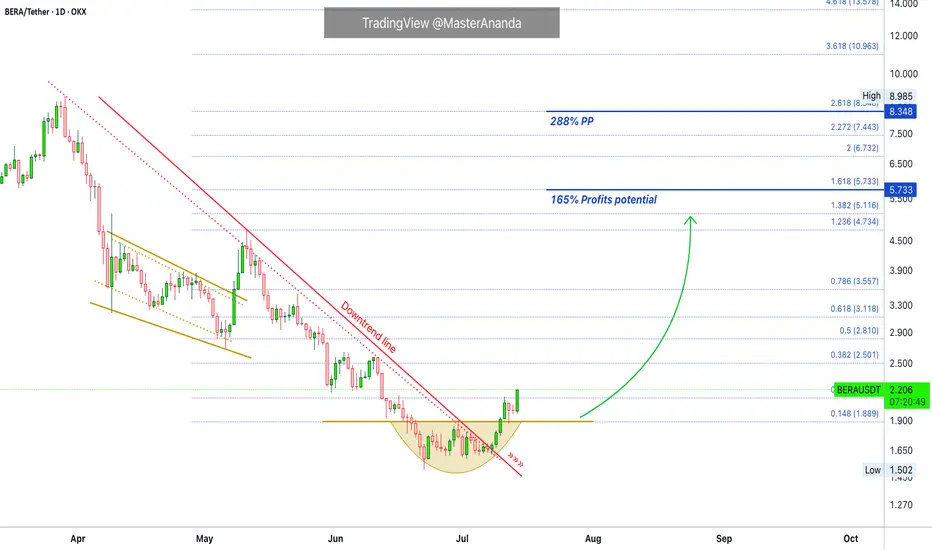
BERACHAIN Starts A Major Advance, Moving Fast (165% - 288% PP)The action never stops in a bull market. When one pair retraces a new pair starts to move forward. Choose wisely.
BERACHAIN (BERAUSDT) looks bullish to me. You can agree as I will show you the proof.
The downtrend has been broken and it is no surprise this happened after the 22-June low. We know this date to be a major turning point for many altcoins, it has been proven by the charts.
To keep it simple and short, because prices are rising fast, once the downtrend ends prices grow.
Here we have a short-term trade setup. We should see higher and higher in the coming hours and days. The bullish signals are fully confirmed; BERAUSDT is ready to move ahead. The main target can be seen on the chart. We are going for 165% but remember, it can go higher.
Thank you for reading.
Namaste.
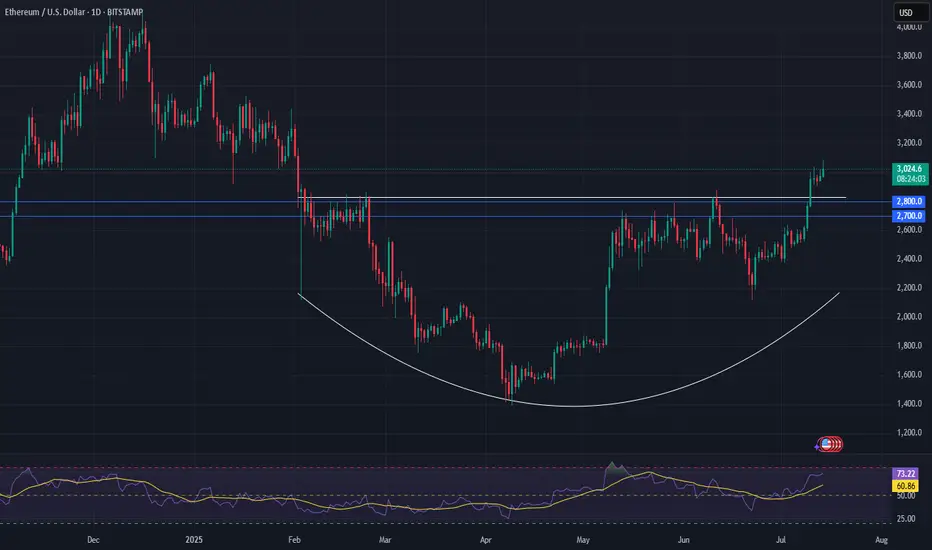
Ethereum Set for a Major Move — Watch $2,700–$2,800Epic Base Forming:
Ethereum is building a powerful base, and the fundamental dynamics have shifted significantly in recent weeks. With ETF fund flows hitting new highs, institutional interest is clearly growing.
Tight Setup for a Short Squeeze:
Meanwhile, the futures market shows a near-record short position, creating a high-potential setup for a massive short squeeze. Even without the chart, this kind of positioning mismatch is rare—and explosive.
Technical Watch Zone:
Ethereum is pressing into key resistance from a rounding bottom. The critical level to watch is $2,700–$2,800. A clean breakout here could ignite a sharp rally, with $4,000+ back on the table in short order.
This is a textbook setup—fundamentals, sentiment, and technicals are aligning.
#Ethereum #ETH #Crypto #TechnicalAnalysis #ShortSqueeze #ETFFlows #MarketSetup #Bullish #Altcoins #CryptoTrading #WatchList
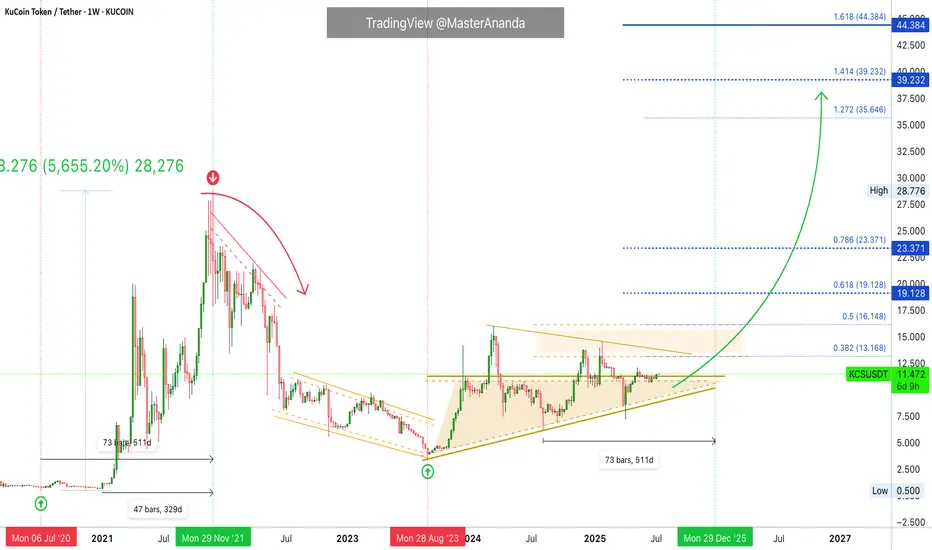
KuCoin Token (KCS) Full Analysis · Past Cycle & PresentKCS is preparing for something really nice, very similar to 2021. In 2021 KuCoin Token grew 5,655%. From 0.500 to 28.77. The entire move from bottom to top lasted 511 days, the bottom being around July 2020, then the market went sideways before the bullish phase. The meat of the move happened in a total of 329 days.
If we take the current cycle bottom to be around August 2024, 511 days gives us a date of 29-December 2025. In 2017 Bitcoin peaked around December. So this is a good date.
I cannot calculate the analog using the 329 days for the "meat of the move" because the bullish breakout is not yet in place. But, late 2025 is what we are aiming for mainly for the next all-time high across the market. We remain open to see this go beyond and reach 2026 but this is something that we will have to wait and see. For now our focus is on what the data provides.
Actually, many pairs, as we saw some weeks ago, are giving out strong signals pointing to Q1-Q2 2026 for their top. Others late 2025. So we have mixed signals and that's normal because the market is really big right now. Not everything can peak at the same time on the same date and not everything hit bottom at the same time.
KuCoin Token is a great example, here the market bottom happened August 2023 and we then see a clear change of dynamics. Ethereum bottomed June 2022 and many altcoins hit bottom just recently, on and on. I keep harping on this just so you know that we cannot generalize anymore. Each project needs to be considered individually if we want accurate results.
KuCoin Token (KCSUSDT) has been bullish growing from its base. A top happened March 2024 and a lower high late January this year, 2025. This does not invalidate the long-term bullish bias and potential.
One major resistance zone remains between $13 and $16, matching the last two peaks just mentioned. We will never wait for "confirmation" here as it would mean a lost opportunity. The market will grow and will break this resistance zone easily and continue higher likely to reach new all-time highs.
So this resistance range, rather than a level that needs to be conquered to confirm a bullish bias, can be taken as weak targets. By weak I mean that we do not sell here. We wait and sell only higher since the market is moving much higher it would be a waste to sell too early. One of the mistakes that can be made in this phase of the market cycle.
Hold strong. Everything looks good. There is huge potential for growth.
$44 is a great target but there is also $69. Which one to choose depends on how the overall market is doing and the date these targets are hit (or missed). For example, if KCS is trading near $40 in just two months, we can aim higher. On the other hand, if KCS is trading around $40 in December, then we can start to consider taking profits.
Of course, this is just a brush-off, you need to do your own research and thorough planning.
Namaste.
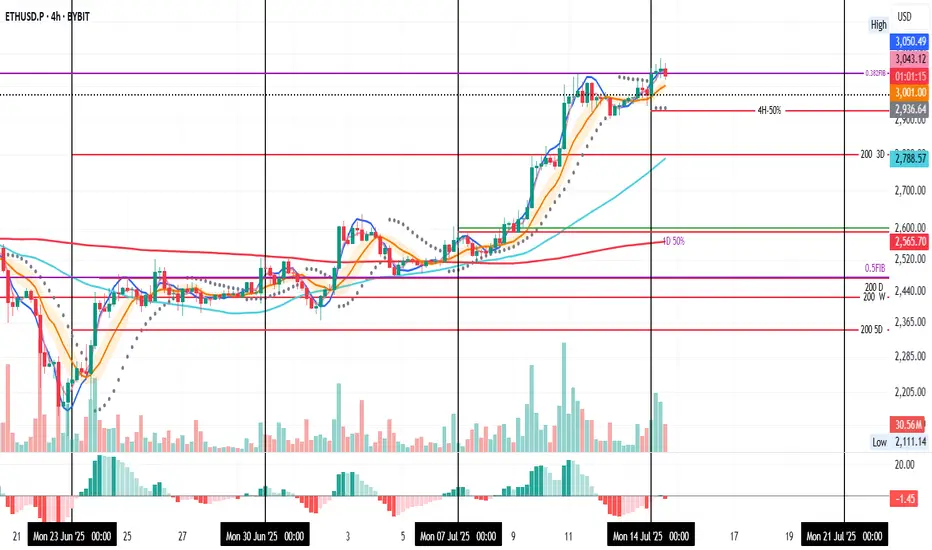
ETH 4H: Retest in Progress
ETH on the 4H starts the week strong, currently retesting support at the 0.382 Fib, a level that acted as resistance last week.
We’ve had two 4H candle closes above it, but now a close below seems likely.
I’ve set a TP at the 4H-50% line, just under the PSAR dots, to take 50% profit if price dips further.
Always take profits and manage risk.
Interaction is welcome.
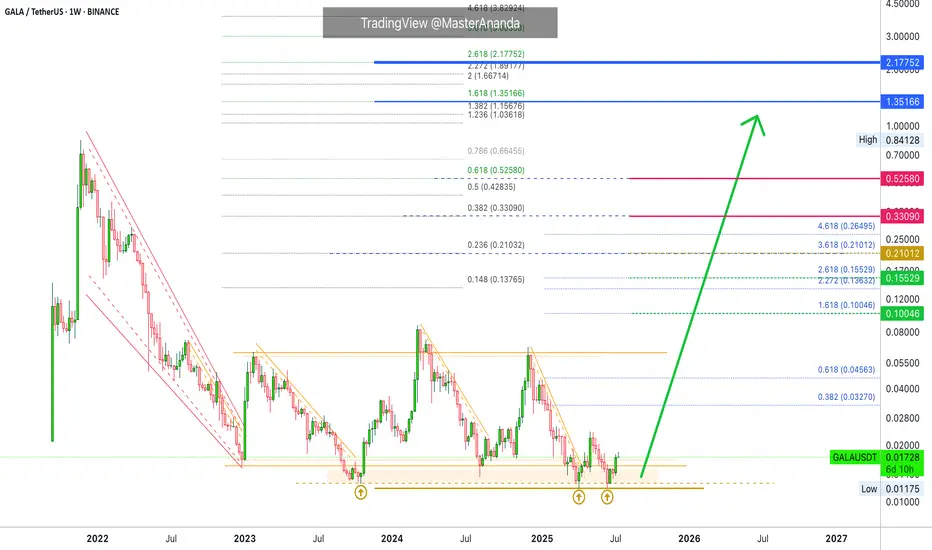
Gala Games · Let's Talk All-Time High & Potential TargetsThe truth is that a new all-time high is just us being optimistic. The truth is that there is not enough data for us to make such a prediction. The altcoins market is turning out to be super strong, Bitcoin is doing great and we expect amazing growth, but I cannot say that a new all-time high is a certainty on this chart, there is simply not enough data. I can't rule it out either, so that's the situation in which we find ourselves.
The next question: Can we make an educated guess based on the data that's available?
Yes! Absolutely.
» Standard projections based on mid-range price action opens up high probability targets around 0.10, 0.15 and 0.21.
» Long-term projections based on the previous cycle (2021-2022) gives us a minimum target of 0.33 and 0.52.
» A great bull market opens up 1.35 and 2.17. But even these numbers can be tricky because we are putting limitations on something that has no limits.
The way we extract these numbers is based on past action, the way the market works is based on present day events and what the future holds. Present day and the future are much different to the conditions we had just a few years ago. Just a few months ago (last year) the market was in such a different situation. A certain group of people whom I won't mention were trying to shutdown the market through capricious lawsuits and abuse of power, today, the market is fully encouraged to grow. This type of development is what can make the difference between a standard high and a major new all-time high. I would aim high just to be on the safe side.
The top will not be over in an hour or days. It can take weeks, sometimes even months. There is also the double-top possibility or in the least, the dead-cat bounce, lower high after the final peak. That is, there will be plenty of time to sell. We just need to become very alert, wise and active when the action is happening around major resistance zones.
We can tell if the top is in by tracking the rest of the market. I will be here sharing charts.
The market will decide, we can only speculate. With that said, we know we are going way beyond the standard and the minimum, the Cryptocurrency market is already doing great. Expect maximum growth; hope for the best, prepare for the best.
Namaste.
Top Altcoins Choice —Your Pick · Bitcoin Hits New All-Time HighBitcoin is once again trading at a new all-time high and as this happens the altcoins go boom.
The first instance circled around the fact that Bitcoin was strong and range trading between $100,000 and $110,000. When Bitcoin goes sideways within a bull market, the altcoins tend to blow up, and blow up they need. Now, when Bitcoin moves to hit a new all-time high and keeps growing; the 2025 Cryptocurrency bull market is fully confirmed.
» Which one is your favorite altcoin trading pair?
» Which project you think will grow the most in 2025 & 2026?
» What is your TOP ALTCOIN CHOICE?
Top Altcoins Choice —Your Pick
Leave a comment with some of your favorite altcoins pairs, the ones you like most and I will do a full analysis for you. I will publish in my profile and also answer directly in the comments section. I will pick and choose.
If you see other commentators that have a pair that you like, make sure to boost their comment and reply. The more boosts a comments gets, higher priority will be given to the project and trading pair.
Boost this publication and leave a comment, let's get started with your TOP ALTCOINS CHOICE!
Namaste.
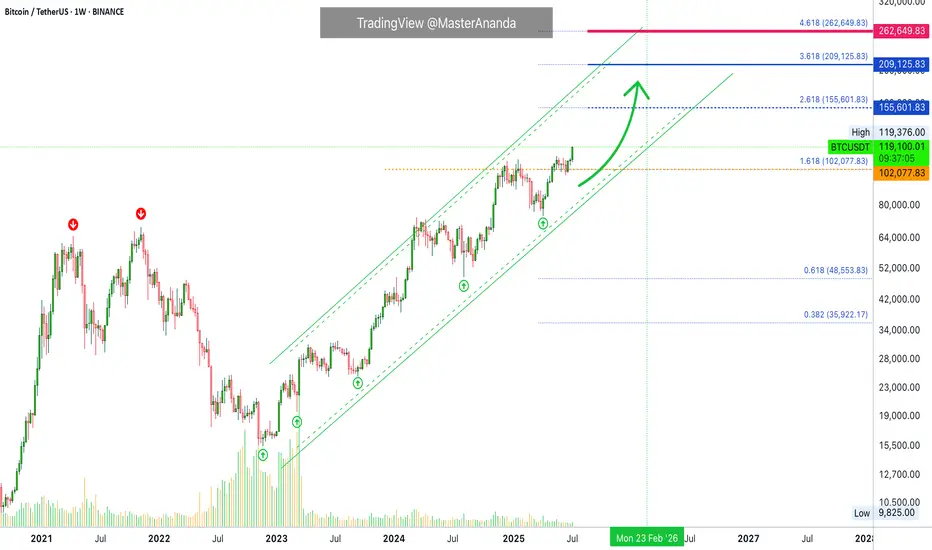
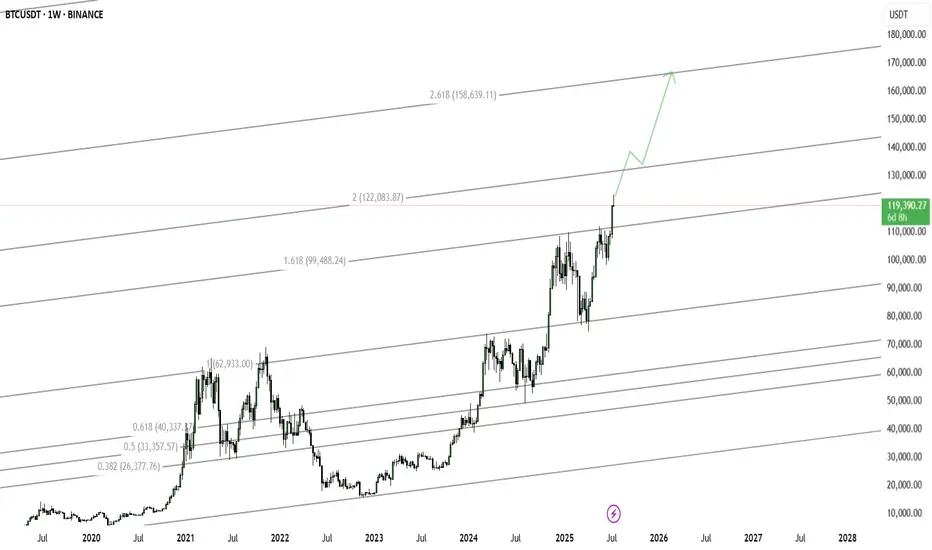
14/07/25 Weekly OutlookLast weeks high: $119,494.32
Last weeks low: $107,467.52
Midpoint: $113,480.92
NEW BTC ATH!
This is what we've all been waiting for, BTC breaks through resistance at $110,000-112,000 to set a the highest weekly close ever ($119,086). Thanks to a further $2.27B net inflows via BTC ETFs, the passing of the "big beautiful bill" flipping from a more deficit reduction stance by the US to an environment perfectly suited to risk on assets. Things are looking good for Bitcoin.
This week already in the Asia session BTC has broken above the weekly high to hit $123,100. Despite this incredible rally BTC.D has been falling since Thursday of last week. To me this signals altcoins have started to play catch up and we've seen that with ETH breaking $3000 (+14% relative to BTC).
I would like to see BTC consolidating here above the weekly high while altcoin majors break their choppy rangebound environments and shift to a trending environment just as BTC had last week.
There are also major data releases this week:
Tuesday CPI
Wednesday PPI
Thursday Euro CPI
Thursday US Initial Jobless Claims
I do not expect these data releases to have a major effect on the markets in their current state due to the risk appetite we've seen in both crypto and equities, such shallow pullbacks prove the demand is there to absorb and sell-side pressure for now.
Now is an excellent time to back strong projects with great fundamentals that are breaking out from downtrends/ranges in both their USD & BTC pairs, as BTC.D drops alts can print some great returns. Beta plays of ETH & SOL can offer higher returns than the majors themselves in these market conditions too.
Good luck this week everybody!

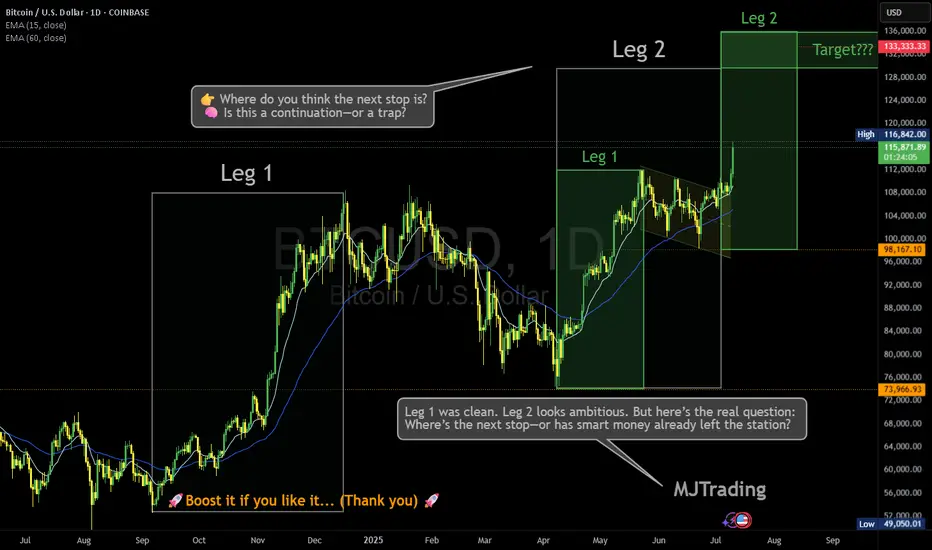
Where is the next stop? 133,333?Leg 1 was clean. Leg 2 looks ambitious. But here’s the real question: Where’s the next stop—or has smart money already left the station?
BTC just sliced through both EMAs with conviction, now hovering above $116K. Volume’s decent, sentiment’s euphoric… but is this rally genuine markup, or a cleverly disguised distribution phase?
🔍 Price targets like $133K are seductive—but what if consolidation isn’t horizontal anymore?
Vertical consolidation is real. And it’s where retail gets baited hardest.
📊 Leg 2 might still play out—but don’t ignore the possibility that this is the final markup before a liquidity sweep.
👉 Where do you think the next stop is? 🧠 Is this a continuation—or a trap?
Drop your guess...
Who has entered here:?
Who can let the winners run in this situation:
#MJTrading #ATH
#Bitcoin #BTC #CryptoTrading #SmartMoney #MarketStructure #WyckoffMethod #LiquiditySweep #DistributionPhase #TechnicalAnalysis #TradingView #CryptoChart #PriceAction #EMA #Consolidation #CryptoStrategy #TrendReversal #CryptoCommunity
DEFI the Next Crypto Sleeper? Trump Jr. & O’Leary Back on Stage!Fundamental Bullish Case:
1. Huge Names Are Paying Attention
Earlier this year, De.Fi held a high-profile event attended by Donald Trump Jr. and Kevin O’Leary. Regardless of political views, this kind of exposure brings:
Mainstream visibility to a previously overlooked microcap.
Credibility among non-crypto retail investors.
The possibility of future partnerships or integrations with major capital players.
When figures like O’Leary (a former FTX critic turned crypto backer) show up, it means the project is on the radar.
2. De.Fi = A Web3 Security & Aggregator Suite
The DEFI token powers the De.Fi “super app”, which combines:
Smart contract security auditing (via their Scanner tool).
Cross-chain asset dashboard — track DeFi investments in one place.
Swap and bridge functionality — a unified DeFi experience.
In a post-FTX world, security + simplicity is the future of Web3 adoption — and De.Fi is positioning itself at that intersection.
3. Microcap with Moonshot Potential
Market cap under $3 million, fully diluted cap still under $30 million.
Token has already proven it can reach $1.00 — and even a partial recovery gives 100x potential from current prices.
Strong upside asymmetry compared to overbought majors.
4. 2025 = Altcoin Season Potential
As Bitcoin cools and liquidity rotates, microcaps historically outperform in the late-stage bull cycle. DEFI could ride this wave as attention flows from BTC to altcoins with good narratives and active dev teams.
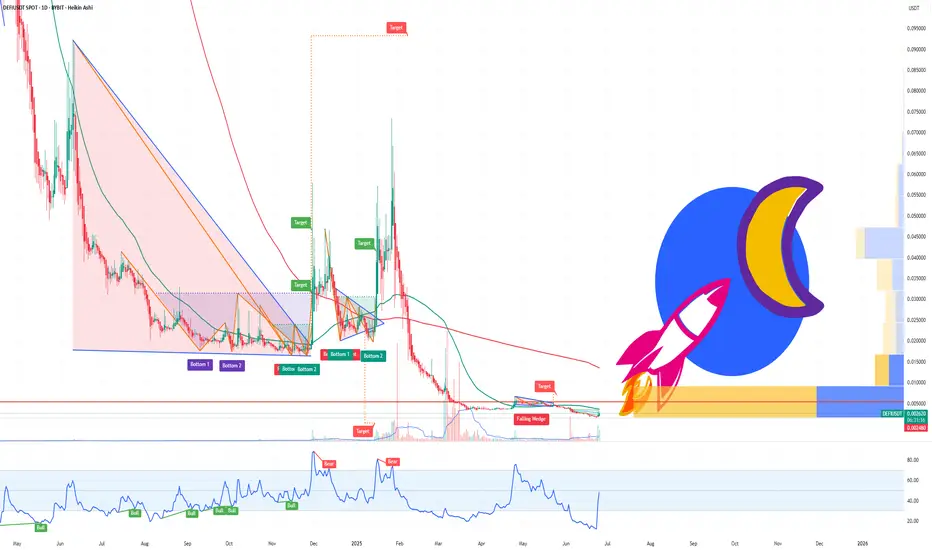
Technical Analysis: Reversal in Progress?
All-Time Low was just 2 days ago ($0.0016).
Since then, price has jumped over 57%, showing early-stage accumulation and short-squeeze activity.
A move above $0.0030 could confirm a breakout from this capitulation bottom.
If momentum sustains, initial resistance targets are $0.006, $0.01, and $0.025 — still just a fraction of ATH.
Price Target Scenarios:
Target % Upside from $0.0026 Reasoning
$0.006 +130% Technical breakout level
$0.01 +280% Psychological + chart level
$0.10 +3,700% Mid-tier recovery, low float
$1.00 (ATH) +38,000% Full retrace (moonshot)
Final Thoughts:
DEFI is not a sure thing - it’s volatile, it’s tiny, and it was forgotten for months. But with renewed attention from major names, an actual working product in the DeFi space, and a chart that just bounced 50% off its lows, it may be gearing up for a new chapter.
If you're looking for an early-stage altcoin with real upside potential in this cycle, DEFI is one to watch.
Balla is still Bullish on BITCOIN. Cup & Handle pattern. The trend is still our friend.
I still see bullish developments in the price action.
We must have patience.
Dips still must be bought.
The plan hasn't changed.
We still aiming for that time period of 9 -15 months post #BTC Halving.
We are only one month down :)
Ethereum Breaks $3,000: Hype Meets UtilityEthereum (ETH) has surged above $3,000, driven by a wave of retail and institutional momentum following the presale success of Little Pepe (LILPEPE), a meme coin built on a new Ethereum-compatible Layer 2 network. With over $5 million raised during the presale, the appetite for meme-coin ecosystems continues to fuel Ethereum’s utility narrative, giving it both technical and psychological strength.
Key Levels to Watch:
• Short-term Structure (H4 Chart): ETH is currently forming a bullish flag pattern, a continuation structure that often precedes further upside.
• Upside Scenario: A confirmed breakout above $3,100 could extend the rally to $3,200, and potentially test $3,300, a level of major historical resistance.
• Downside Risk: Failure to hold current levels may see ETH retrace back toward $2,900, with the 50% Fibonacci retracement at $2,600 acting as the next support zone.
If sentiment in the broader crypto market remains elevated and Bitcoin holds firm near all-time highs, Ethereum’s bullish setup may have further room to run.

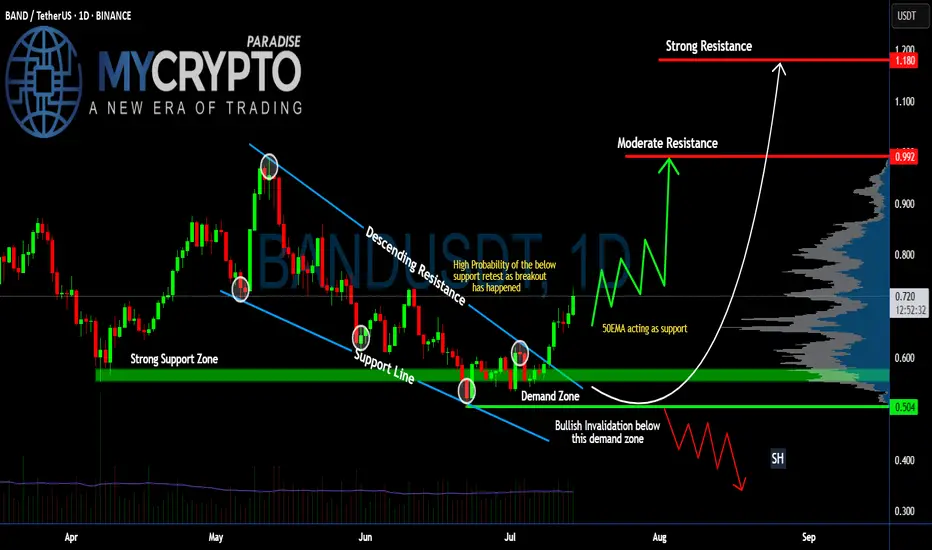
Can #BAND Bulls Maintain this Momentum or Will Bears Win? Yello, Paradisers! Is #BANDProtocol breakout from the falling wedge legit—or are bulls walking straight into a trap? Let's dig into the latest setup of #BANDUSDT:
💎After trading for weeks inside a falling wedge, #BAND has finally broken out with solid momentum. The breakout above the resistance trendline at around $0.66 has already occurred, and the price is currently hovering near the $0.72 zone. While this move is promising, it’s now all about whether this breakout can hold or fake out.
💎The structure here is clear: #BANDUSD reclaimed the demand zone between $0.60–$0.66 after bouncing off strong support at $0.504. This zone now becomes the most important area to watch in the short term. A retest of this level would offer a high-probability continuation setup, especially since the 50EMA is now acting as dynamic support beneath the price.
💎If bulls can maintain control, we have a clear path toward the moderate resistance at $0.992. That’s where the next wave of selling pressure is expected. But the real prize is the strong resistance zone near $1.180. That’s the level where major distribution could occur, and it's where we’ll be watching closely for profit-taking signs.
💎However, the bullish thesis breaks down completely if the price drops back below the $0.60–$0.66 demand zone. In that case, our invalidation point sits firmly at $0.504. A close below that support would indicate bears are back in control, and we’d shift to a defensive stance, targeting lower re-entry zones.
Stay patient, Paradisers. Let the breakout confirm, and only then do we strike with conviction.
MyCryptoParadise
iFeel the success🌴