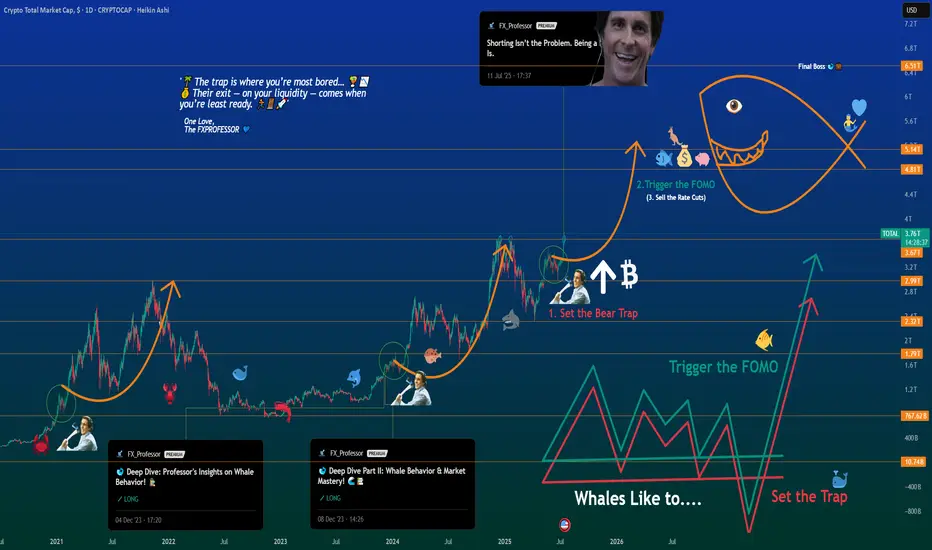
Deep Dive Part III – The Next BIG Whale Play UnfoldsDeep Dive Part III – The Next BIG Whale Play Unfolds
📍In Parts I & II of this Deep Dive, we broke down the psychology of whale behavior — from “Buy the Rumors, Sell the News” to the critical breakout zones that echoed historical patterns.
🐋 Back then, we spotted the whales' playbook early. The strategy was simple:
Buy the Rumors – Sell the News.
🧠 But now, the script has changed.
“The trap is where you’re most bored… 🌴📵
Their exit — on your liquidity — comes when you’re least ready. 💰🏄♂️💼”
Let’s break this moment down into what’s really unfolding.
We are officially entering the next stage of the cycle — not just in price, but in psychology.
This is no longer just about charts.
This is about human behavior on autopilot.
Here’s what I see happening right now — broken into three truths:
1️⃣ People Are On Holiday 🌞
From my community to the broader market, the energy is low.
People are either sunbathing on a beach or mentally checked out.
The focus is not there. The reflex to take action is dulled.
📉 The trap is where you’re most bored… 🌴📵
💰 Their exit — on your liquidity — comes when you’re least ready. 🏄♂️💼🚀
We’re seeing it unfold now:
1. Set the Bear Trap
2. Trigger the FOMO (will be down the road, yes)
3. Exit on Liquidity (the closing act of the play)
🕶️ But when everyone is away or asleep, that’s when the trap is laid.
It’s during these quiet, lazy days that the big moves get built.
2️⃣ This is a Disbelief Rally 🎢
The market trained everyone with a rhythm:
pump ➝ dump, pump ➝ dump, pump ➝ dump…
So what happens now?
People don’t trust the breakout. They’re frozen.
“We’ll dump again,” they say.
Except… what if this time, we don’t?
That disbelief becomes fuel.
It becomes hesitation — and hesitation becomes missed opportunity.
3️⃣ Bears Are Shorting Into Strength 🧨
This is key. While retail is confused, the bears are pressing in hard.
Their shorts are adding fuel to the pump they don’t see coming.
That’s why I posted recently:
“Shorting isn’t the problem. Being a psycho bear is.”
It’s not about being bullish or bearish —
It’s about timing , discipline , and narrative awareness .
Whales love this moment.
They lure in shorts, set the trap, then ignite the breakout straight into FOMO.
🧠 The Game:
Set the Trap → Trigger the FOMO → Exit on Liquidity 💥
This is what you’re seeing on the chart.
Not just price action — psychological choreography.
🕰️ In 2020–2021, we saw the exact same structure.
Part I warned about early accumulation and baiting behavior.
Part II showed how whales manipulated expectations with layered waves of doubt.
Now in Part III — the explosion few are ready for.
Zoom into the chart and it’s all there:
The curve, the trap, the trigger… and yes — the Final Boss.
🎯 The Final Boss: 6.51T
That’s the ultimate liquidity zone.
If this cycle plays out, we’re headed toward it.
“Sell the Rate Cuts” will be the new “Sell the News.”
It’s not the headlines that matter — it’s who’s left holding the bag.
🔚 Final Thought
The real exit — the one that traps most of retail — will come not when you’re euphoric,
but when you’re still saying:
“Surely we must dump now…”
So stay sharp.
Trade the chart — but don’t forget to read the behavior.
One Love,
The FXPROFESSOR 💙
Part1:
Part2:https://tradingview.sweetlogin.com/chart/idea/VgMBPsp3/
The Bear Trap:
Disclosure: I am happy to be part of the Trade Nation's Influencer program and receive a monthly fee for using their TradingView charts in my analysis. Awesome broker, where the trader really comes first! 🌟🤝📈
Crypto
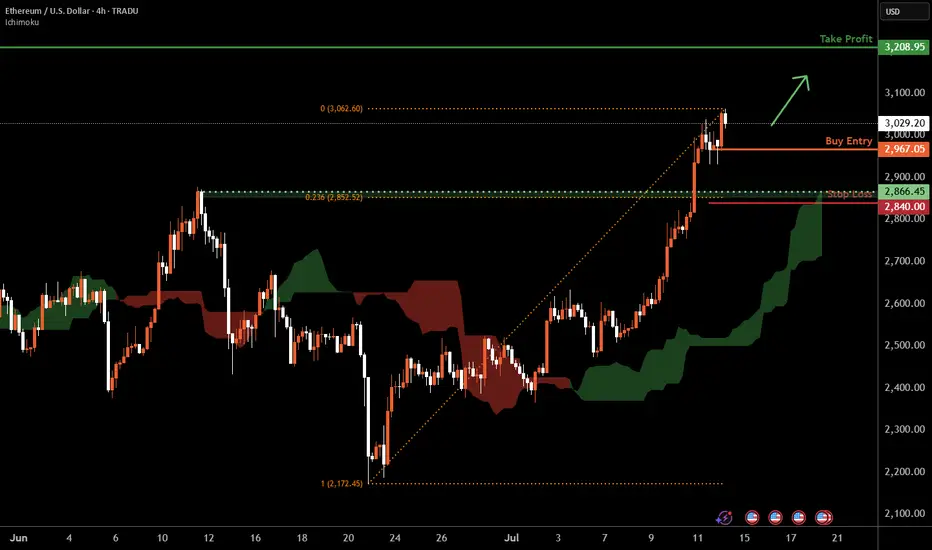
Ethereum H4 | Bullish uptrend to extend higher?Ethereum (ETH/USD) is falling towards a swing-low support and could potentially bounce off this level to climb higher.
Buy entry is at 2,967.05 which is a swing-low support.
Stop loss is at 2,840.00 which is a level that lies underneath a pullback support and the 23.6% Fibonacci retracement.
Take profit is at 3,208.95 which is an overlap resistance.
High Risk Investment Warning
Trading Forex/CFDs on margin carries a high level of risk and may not be suitable for all investors. Leverage can work against you.
Stratos Markets Limited (tradu.com ):
CFDs are complex instruments and come with a high risk of losing money rapidly due to leverage. 63% of retail investor accounts lose money when trading CFDs with this provider. You should consider whether you understand how CFDs work and whether you can afford to take the high risk of losing your money.
Stratos Europe Ltd (tradu.com ):
CFDs are complex instruments and come with a high risk of losing money rapidly due to leverage. 63% of retail investor accounts lose money when trading CFDs with this provider. You should consider whether you understand how CFDs work and whether you can afford to take the high risk of losing your money.
Stratos Global LLC (tradu.com ):
Losses can exceed deposits.
Please be advised that the information presented on TradingView is provided to Tradu (‘Company’, ‘we’) by a third-party provider (‘TFA Global Pte Ltd’). Please be reminded that you are solely responsible for the trading decisions on your account. There is a very high degree of risk involved in trading. Any information and/or content is intended entirely for research, educational and informational purposes only and does not constitute investment or consultation advice or investment strategy. The information is not tailored to the investment needs of any specific person and therefore does not involve a consideration of any of the investment objectives, financial situation or needs of any viewer that may receive it. Kindly also note that past performance is not a reliable indicator of future results. Actual results may differ materially from those anticipated in forward-looking or past performance statements. We assume no liability as to the accuracy or completeness of any of the information and/or content provided herein and the Company cannot be held responsible for any omission, mistake nor for any loss or damage including without limitation to any loss of profit which may arise from reliance on any information supplied by TFA Global Pte Ltd.
The speaker(s) is neither an employee, agent nor representative of Tradu and is therefore acting independently. The opinions given are their own, constitute general market commentary, and do not constitute the opinion or advice of Tradu or any form of personal or investment advice. Tradu neither endorses nor guarantees offerings of third-party speakers, nor is Tradu responsible for the content, veracity or opinions of third-party speakers, presenters or participants.
BTC Weekly Update -as of Jul14🕰 Timeframe:
📆 Date:
🔎 Market Overview:
💼 Massive Institutional Inflows:
▪️ Over $1.1 billion in net capital inflows have entered spot Bitcoin ETFs in recent days, bringing the total weekly inflows to $2.72 billion so far.
▪️ The total assets under management (AUM) across all Bitcoin ETFs now exceed $150 billion, representing over 6% of Bitcoin’s total market capitalization.
⚖️ Favorable Political and Regulatory Support:
▪️ The ongoing Crypto Week in Congress is reviewing key legislative proposals like the Genius Act and the Clarity for Digital Assets Act, both of which offer promising regulatory clarity for the crypto industry.
▪️ Additionally, former President Trump’s executive order to establish a “Strategic Bitcoin Reserve” signals strong official political support for Bitcoin adoption.
📊 On-Chain & Sentiment Indicators
📦 Exchange Reserves:
Bitcoin reserves on centralized exchanges are at their lowest levels in years, suggesting a trend toward long-term holding (HODLing) and reduced selling pressure.
🧠 Fear & Greed Index:
The sentiment index remains firmly in the “Greed” zone, even hitting its highest level since May, indicating strong bullish sentiment among retail and institutional investors.
🌀 Whale Activity:
Whale wallets continue to show heavy accumulation, with large and steady transfers into private wallets, further supporting a bullish on-chain trend.
📈 Technical Setup
🔵Trend: Ranging upward
🔸 Key Support: 118,000➖ 115,000
🔸 Key Resistance: 125,000➖ 130,000
🔸 Indicators Used: RSI above 70
🧭 Next Week – Key Points
🔹 Watch for the outcomes of Crypto Week legislation in Washington — this will be a key driver for market direction.
🔹Monitor ETF capital inflows — if daily inflows stay above $500M, the bullish trend will likely strengthen.
🔹 Track the Federal Reserve's interest rate policy and the USD outlook, especially in response to inflation or other macroeconomic factors.
🔚 Summary: Final Analysis
📌 After reaching a new all-time high above $122K on July 14, Bitcoin’s bullish trend has strengthened. Strong institutional inflows and political support have reinforced the foundation for growth.
● Key Level Ahead: $125,000
● Outlook: If price consolidates above resistance, we could see a move toward $135K and beyond.
● Weekly Bias: Bullish, with potential for a pullback before continuation upward.
✅ If you like this analysis, don't forget to like 👍, follow 🧠, and share your thoughts below 💬!

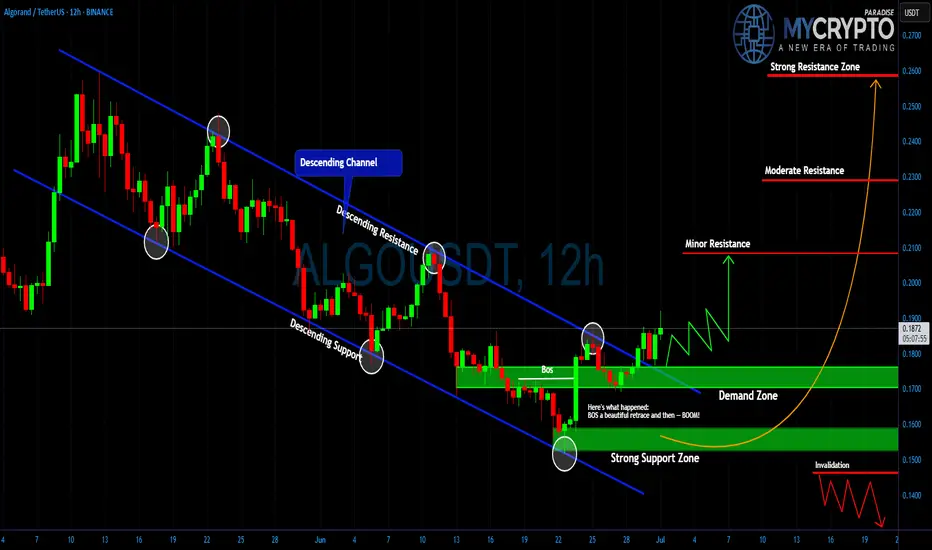
ALGO: Surprise Rally Ahead?Yello Paradisers, did you spot that breakout from the descending channel in time or are you still waiting for confirmation that already happened?
💎#ALGO/USDT has officially broken out of its multi-week descending channel after a textbook Break of Structure (BoS). Price action gave us a beautiful retrace into the demand zone, and from there boom momentum began shifting. This move is now showing early signs of bullish continuation, but as always, the majority will only realize it once the big move is already done.
💎#ALGO had been trading within a clearly defined descending channel, with price reacting precisely between the descending resistance and descending support lines. The breakout occurred after a strong candle pierced the descending resistance, and more importantly, we got a BoS followed by a clean retest of the demand zone around $0.165–$0.175. That reaction was sharp and decisive, indicating strong interest from buyers stepping in.
💎As of now, it is trading near $0.186 and forming higher lows, which supports the idea of an ongoing trend reversal. The structure has changed, and bulls are slowly regaining control. If price sustains above $0.190, the doors open for further upside. The first key level that could slow momentum is minor resistance near $0.210. If that level breaks with volume, moderate resistance around $0.230 becomes the next critical zone. Above that, the major target sits at $0.260, a strong resistance area where a lot of liquidity could be triggered.
💎On the flip side, the strong support zone between $0.145 and $0.155 remains our invalidation area. If price drops below this range, the bullish setup collapses, and we reassess the entire structure. But unless that happens, the bias remains cautiously bullish.
Trade Smart. Stay Patient. Be Consistent.
MyCryptoParadise
iFeel the success🌴
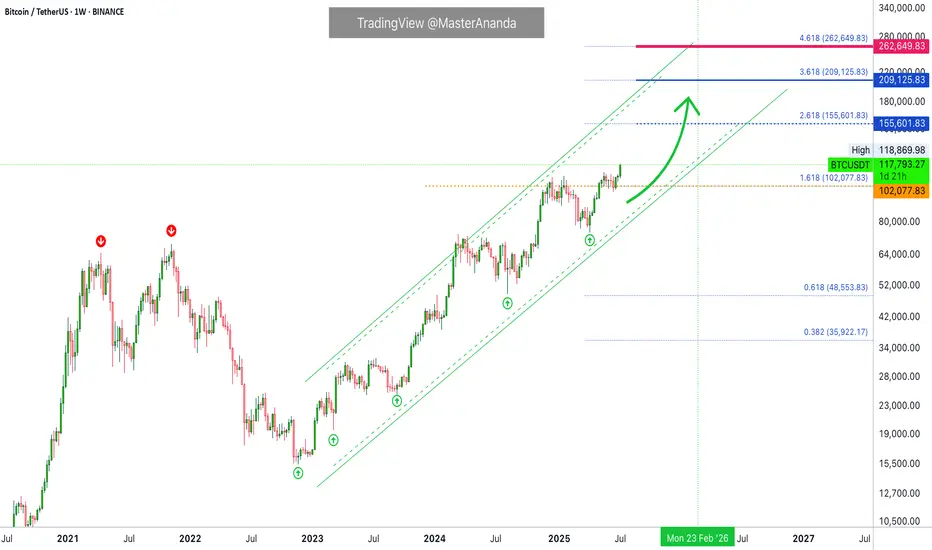
Bitcoin Crash? No! The Bullish Wave Starts Now! $155,601 Next!Some people are still expecting for "Bitcoin to go down." Poor bastards, the advance is just starting. Bitcoin just broke out of a 210 days long consolidation phase. After this huge, long-term consolidation, expect a major advance. Next target is now set at $155,601.
This week is the first week green after the consolidation finally ends. The market was sideways for seven months, with some fluctuations, and the result is a bullish breakout. Why a breakdown? Why expect a drop? If the market just broke up—think about it—why would it go down?
If resistance is confirmed; you remember the range between $100,000 and $110,000. If resistance is confirmed then Bitcoin would start crashing down from $110,000. If the break of $110,000 does happen and Bitcoin moves to $112,000 as a bull-trap, then you would expect a major crash happening from $112,000 and no more. But, reality is saying, showing, something much different. We have a major advance. Resistance has been flipped into support.
Now, the first that is needed is the weekly close. It is still very early into this move but Bitcoin is showing maximum strength. Remember the altcoins? These confirm that the advance is just new, early, because these are recovering from all-time lows or major lows. There is still plenty of room for growth.
My people, wake up! Bitcoin is going up.
The next target is $155,601 and it can go higher, this is only the mid-term target based on the long-term. When Bitcoin consolidates for 7 months, it tends to grow some 137% on average, it can be less but it can also be much more. And it tends to grow at least for 1-2 months, but this also is just the average, Bitcoin can grow straight up for 4 months.
So, are you still bearish?
Oh please no! The bulls already won.
The 2025 bull market final phase starts now, soon you will experience a marketwide bull-run. We have not seen the euphoria phase, this is only the start. Prepare for additional growth.
I am calling out all of the bears, never bet down on Bitcoin; Bitcoin is going up.
Namaste.
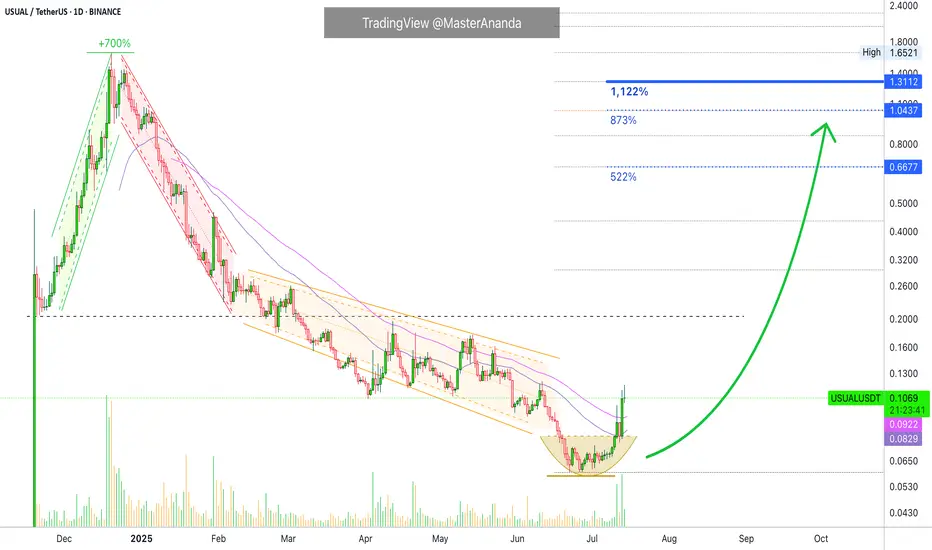
Usual 1,122% Target Mapped · Can Go Higher Late 2025Usual grew 700% in one month, between November and December 2024. Then the market went on to produce a major lower low bottom and now everything is changing. I am sharing this one again because I believe it will produce a massive bullish wave.
Good evening my fellow Cryptocurrency trader, how are you feeing in this wonderful day?
A new week starts and with the new week we will have a new set of top performers. Remember that a rising tide lifts all boats. It is not only one project but the majority of the altcoins that are set to grow. It is a long drawn out process, do not be distracted by the illusion of easy or fast gains. If you can hold and do so strong, patiently, you can end up with big gains. The big wins accumulate after months. Buy the bottom, 7-April, 22-June and hold. Comeback in 2-3 months and see how the market is doing. Sell those trading high, buy those trading low.
USUALUSDT is now trading above EMA55 and EMA34. A strong candle and high volume came up to break each of these resistance levels. The same levels that rejected growth many times in the past three months.
In April, USUALUSDT tried to turn bullish but was rejected by EMA55 and EMA34. This same dynamic repeated once more in late April and then twice in May. When the market fails to conquer a resistance zone it tens to move lower looking for strength. That did it. After a major low and rounded bottom, we are now on the bullish zone.
USUALUSDT can easily grow 500% to 800% in the coming months. Without hitting a new all-time high, we have 1,122% potential for growth. From a previous chart, the 1,122% target gives us 1,950%. This is huge growth and it is possible that a new all-time high will be hit later during the bull run phase.
This is a friendly reminder. Opportunities are endless in this market.
Thank you for reading.
Namaste.
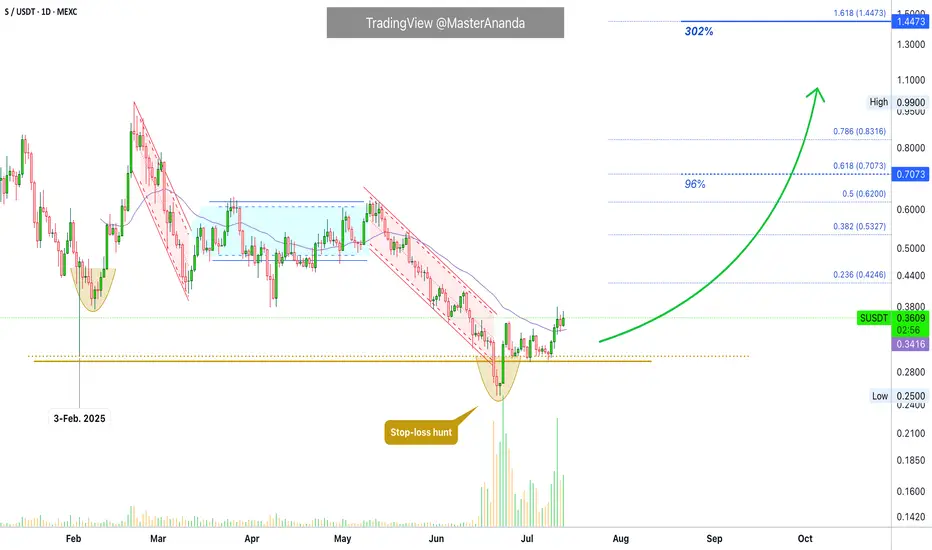
Sonic Moves Next · Expect Massive Growth Coming Weeks —300% EasyTwo pairs-projects will be moving strongly in the coming weeks, Sonic and Usual. This is the chart for SUSDT (Sonic) on the daily timeframe.
Notice how the action is moving back above the 3-February 2025 low (bullish). Notice the stop-loss hunt event recently. This events marks a bottom once it happens. After the event we see growth.
Finally, notice the very strong increase in trading volume. SUSDT is trading safely above EMA34. All these signals confirm strong growth in the coming weeks starting now basically, it is already happening as the action has been bullish since 22-June.
I am always giving you the best charts, the best timing in the Universe with the best results. I will continue to share daily but you need to follow. You can get notifications each time I publish and in this way you can be up to date with the Cryptocurrency market, the altcoins are moving ahead and this only happens once every four years. There are bullish waves in-between the bear market and transition years, but nothing like 2025.
The 300% on the chart is an easy target. This target can be achieved short-term maximum mid-term. Imagine the 100 years old index funds, it would take you 30 years to earn 300%. Oh my god! Leave that to your grandparents this is not for us.
My heart goes out to all the people still buying index funds related to the stock market. It is like using floppy disk still in the year 2025, we have USB sticks and smartphones, floppy disk were discontinued long ago. Buying SPX index funds and such stocks instead of Crypto is like buying CD-roms to store music, we streaming now not even MP3.
The future of finance is Crypto. Altcoins is the way to go. If you are already in this market you are ahead of the pack. You will look like a genius 10, 15, 20 years from now. For you and for me it is normal but actually, only the minority knows well enough the game. There is plenty of room left available for growth. Crypto is young.
Namaste.
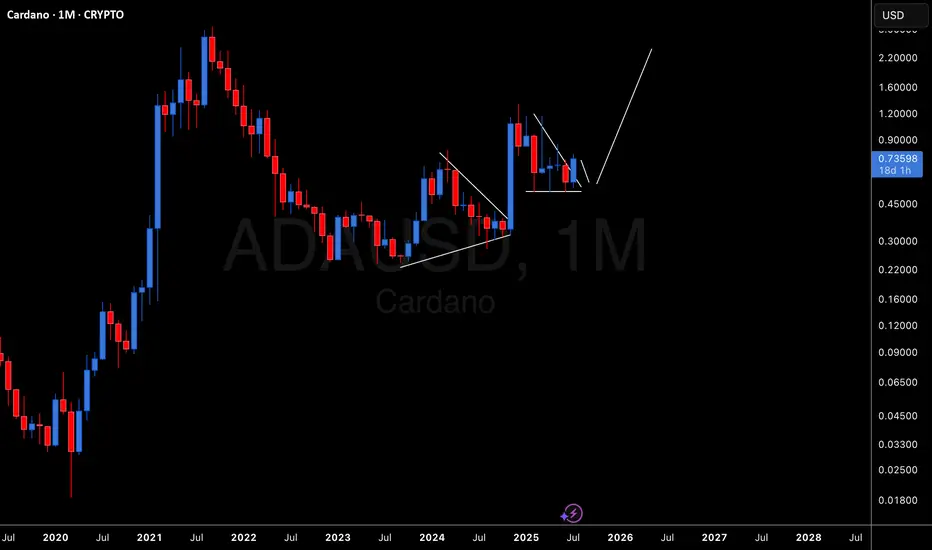
ADA Cardano To The UpsideADA Cardano has broken out of a bullish triangle pattern. Looking for a small pull back on the next weekly candle. Then long to the previous high.
TRBUSDT: Massive Bullish Setup or a Fakeout Trap?Yello Paradisers — is TRBUSDT gearing up for a major breakout, or is this just another fakeout before a deeper drop? Our previous calls have been consistently accurate, and now this chart is flashing multiple signals that deserve your full attention.
💎Currently, TRBUSDT has formed a textbook falling wedge pattern, a well-known bullish reversal signal. What's adding strength to this setup is a clear bullish divergence, suggesting that momentum may be shifting in favor of the bulls. Even more compelling, the price is now holding firmly inside a bullish Order Block (OB) zone, which is aligned with the 200 EMA — a powerful confluence that increases the probability of a bullish move significantly.
💎For aggressive traders, this could be a valid spot to enter immediately, capitalizing on the current structure and zone. However, for those looking for a more calculated entry with improved risk-to-reward, waiting for a pullback could provide a much better setup — with the potential to offer over 4.5 RR, making it a high-probability trade idea.
💎That said, it’s important to manage risk carefully. If TRBUSDT breaks down and closes candle below the bullish OB zone, this would invalidate the bullish setup entirely. In that case, the smart move would be to wait patiently for new price action to form before making any decisions. Reacting emotionally here could lead to unnecessary losses, so discipline is key.
🎖Strive for consistency, not quick profits. Treat the market as a businessman, not as a gambler. If you want to be consistently profitable, you need to be extremely patient and always wait only for the best, highest probability trading opportunities.
MyCryptoParadise
iFeel the success🌴

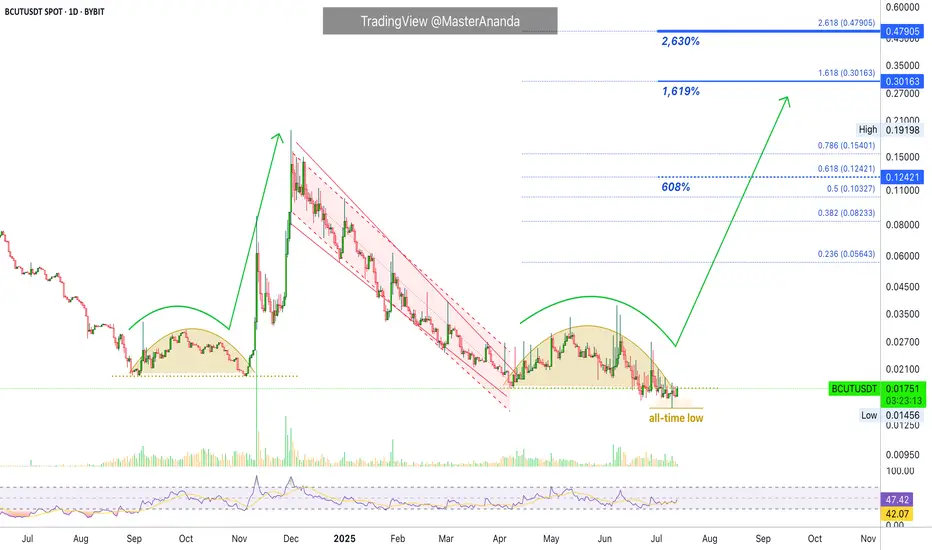
bitsCrunch 608% & 1,619% Easy Targets · 2,630% Possible Or MoreI am going with a classic on this project and Cryptocurrency trading pair, the RSI bullish divergence.
We are going to be looking at bitsCrunch (BCUTUSDT) on the request of one of our great followers. This chart is awesome. A true bottom catch—all-time low just hit—with high potential for growth and strong bullish reversal signals. Let's get started.
BCUT's daily RSI bottomed around June 2024. Oversold. Red.
BCUTUSDT continued lower and set a low around September and then again November 2024 before a nice recovery. The late 2024 bullish wave might seen small here but it almost reached 900%.
Then came the correction, a strong one. BCUTUSDT broke it's 2024 support zone and hit a lower low. At this same time, the RSI produced a higher low compared to June 2024. This gives us the bullish divergence signal and this signal tends to support a change of trend.
BCUT went on after its 7-April low and produced a lower low, an all-time low, 10-July. A true market bottom. The candle for this session ended closing green with a long lower wick, which means bullish. Three days later we have a recovery. From now on, we can expect maximum growth.
The ~900% bullish wave in late 2024 shows that this pair can do wild numbers. If it can grow this much in just 26 days, imagine how much it can grow in 180 days. Good to visualize. Huge potential. A great altcoin choice.
1,619% and 608% are easy targets. The 2,630% target is do-able with a standard bull market.
Thanks a lot for your continued support.
Namaste.
BREAK 2.0 upcoming for VELO/USDTVELO/USDT has high chance to break in the coming hours, more updates later when there is more confirmations below this update

Mask Network Easy 688% Profits Potential Target ($10.88)The 2022 bear market for Mask Network ended October 2022. After a series of lower lows the project produced a bullish breakout until March 2023. It was the recovery wave with a total of 650% growth.
MASKUSDT went bearish again from March 2023 but instead of a bear market wave it produced a long drawn out distribution pattern.
The next major low happened 7-April 2025. More than two years producing lower highs and dropping, and I consider this low to be the end of the bearish period. MASKUSDT will now resume growing as part of a new bullish cycle and uptrend.
The 7-April low was followed by higher lows. Compare this to pre-October 2022 when the market was producing lower lows instead. Higher lows then a strong bullish breakout in May. Total growth for the initial recovery reached 300%. This is where the market is now. There was a retrace and now we are seeing signs of a bullish continuation after a higher low.
Mask Network is good as prices are still relatively low. Seeing the big candles in the past, another huge big-candle will show up.
Looking at the chart, I am mapping a 688% easy target within the next 3-6 months. Coming from the 7-April low, hitting this same target would produce a total of 1,070%. I believe the market is very healthy and even higher is possible in late 2025 and beyond.
This is a good chart if you are a buyer and looking for pairs that can grow strong in the near future. If you are a bull, this is an easy buy and hold.
Namaste.

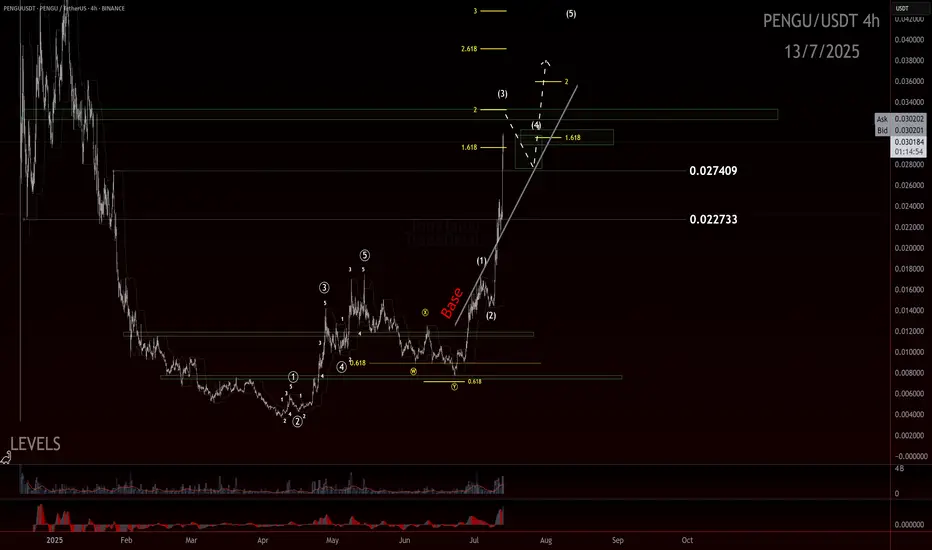
PENGU still has room!?If you find this information inspiring/helpful, please consider a boost and follow! Any questions or comments, please leave a comment!
The move off the low looked like a clean, completed impulse—sharp, decisive, and well-structured. After that, we got a double zigzag retracement. It ran a bit deeper than the textbook version, but still landed right in the normal range you’d expect for a healthy correction. From there, we saw another smaller-degree impulse form off the .007 pivot, suggesting bullish momentum was building again.
Since the last update, PENGU has come a long way—more than doubling in price and now hovering around a most likely target for a wave 3. What’s notable is how it got there: not just by breaking above the 0.017 resistance, but by blowing through multiple base channels on solid momentum and healthy volume.
We didn’t get the ideal depth for a retrace for a wave 2 before that breakout, but that doesn’t disqualify the larger count. In fact, from an Elliott Wave perspective, I still believe we haven’t seen a proper wave 4 to balance out the earlier wave (2). So I’m holding off on calling a top to this wave 3 just yet.
Here’s what we’re watching closely now:
The secondary impulse off .007 continues to build structure
Ideally, the next pullback holds above the 0.027 or .022 region, signaling respect for previous support and AOIs
That pullback needs to unfold correctively, not impulsively, to confirm bullish continuation
The next trade setup I’m eyeing is that wave 4 into wave 5 move. I’ll be stalking this ticker closely as structure unfolds.
Trade safe.
Trade clarity.
NPC/USDT NEW VOLUME WAVENew volume wave seems to start on this coin, which can get confirmed in the coming hours.
If there is new updates depending on data or volume, the chart will be updated here.
CLOUD THIS CAN BE THE BOTTOM STARTThis is a new coin to watch in the coming period, as it is showing signs of potentially forming a new bottom.
By respecting the previous all-time low, there’s a possibility that a new upward trend could begin from this level. Some indicators are also pointing toward this scenario.
If the coin provides further confirmations, updates will be shared below.

ETHEREUM - ETH Weekly Recap & Projection 13.07.2025Current Structure
Ethereum is showing a clear bullish bias.
Last week’s price action broke above a significant weekly swing level with solid candle closures — suggesting continuation.
Short-Term Scenarios
We could see two potential outcomes:
• A consolidation range forming at current levels
• A short-term retracement influenced by Bitcoin’s movement
Due to ETH’s high correlation with BTC, traders should review Bitcoin’s chart to understand ETH’s likely path.
Trading Plan
Wait for Bitcoin to complete a retracement
Monitor ETH for LTF (lower timeframe) confirmation and bounce
Seek long setups below the CME Gap (pink line)
Step 2 will serve as the trigger to initiate any positions on ETH.
Macro Risk-On Catalyst – Powell Resignation?
There are growing rumors regarding Federal Reserve Chairman Jerome Powell potentially resigning.
If confirmed, this could result in a strong rally across risk assets, including ETH — likely pushing prices higher without traditional pullbacks.
Summary
• ETH broke major weekly structure
• Watch BTC for clues — correlation remains high
• Plan favors long entries after BTC retrace + ETH LTF confirmation
• Powell resignation rumors could accelerate bullish trend

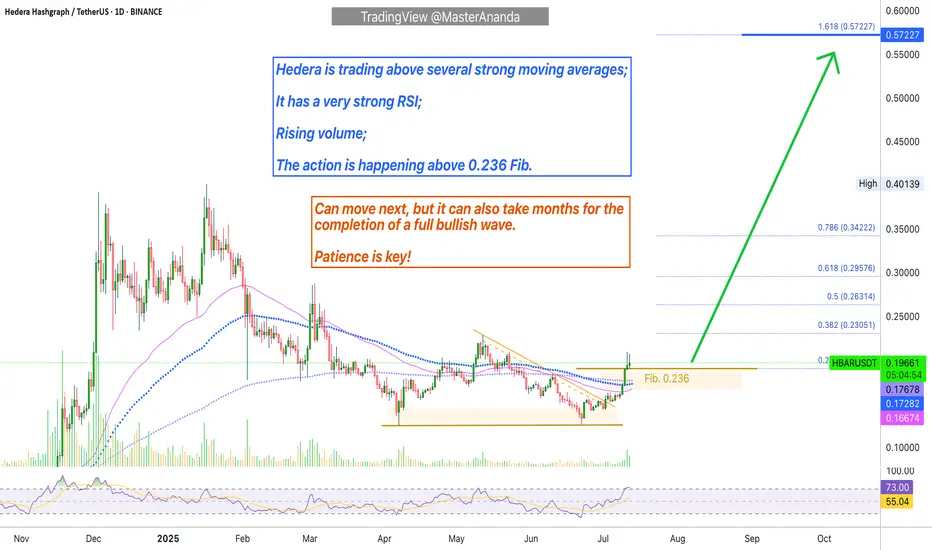
Hedera: How To Catch The Altcoin That Will Move NextWhich one is going to move next? That's the question and here is the answer: Look for those with a confirmed bullish setup.
There are hundreds and hundreds of trading pairs. We go by the saying, "everything will grow." But not everything grows the same day nor at the same time. So which ones are the ones more likely to move next?
Here is a simple example: HBARUSDT.
Hedera is trading daily above EMA55, EMA89 and EMA233. While it has already five days green, this one is more likely to move next vs others that are trading below those moving averages. That is what I mean by a confirmed bullish setup.
You can also use MA200 and other indicators such as the RSI and MACD. For example, if the action is happening above a strong Fib. level, this can also be of value. If the RSI is very strong compared to other pairs, this is also good. The more strong bullish signals combined the higher your chances of finding the right one.
My suggestion?
Do not try to catch the next big move. It is better to develop a plan, find the pairs that fit your criteria then buy and hold. Chasing pairs can turn into blind gambling game. It is better to trade on a plan focused on the long-term.
Thank you for reading.
Namaste.
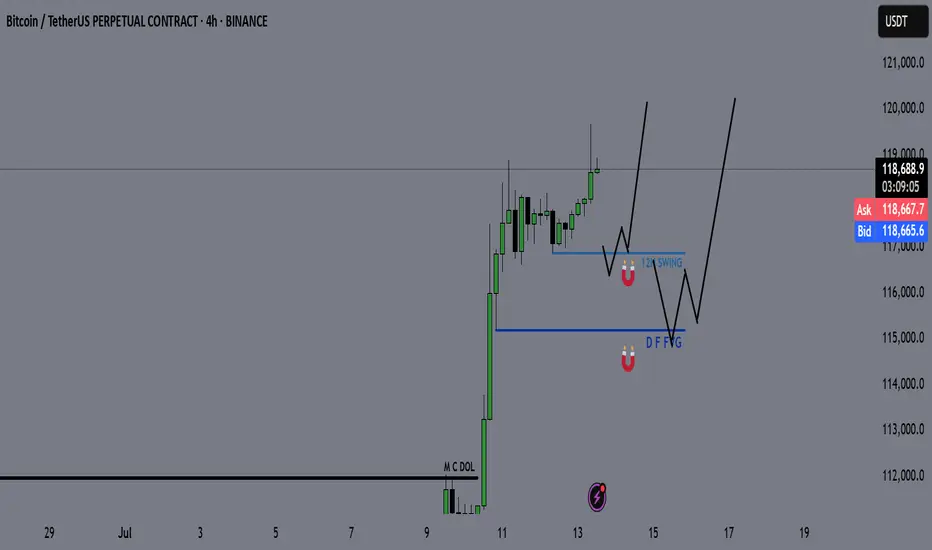
Bitcoin - BTC | Weekly Market Recap & Outlook 13.07.2025What Happened Last Week?
Bitcoin broke out of the recent downtrend structure and established a bullish leg with clear momentum.
The breakout was supported by volume and price structure, suggesting a trend reversal rather than a temporary deviation.
Weekly Bias and Strategy
The current outlook is bullish.
A retracement or sideways consolidation between the $120,000 and $114,000 zone is possible.
This zone may act as accumulation before further upside.
Key Points of Interest (POIs):
12H Swing Liquidity (turquoise line)
Daily FVG (blue line)
These levels will be monitored for long setups with confirmation on lower timeframes.
Macro Consideration – Fed Chairman Jerome Powell
Recent market speculation has increased regarding Jerome Powell potentially stepping down as Chair of the Federal Reserve.
If such a resignation is confirmed, it may act as a significant bullish catalyst for Bitcoin and other risk assets, possibly accelerating upside without allowing for any meaningful pullback.
Summary
• Bullish breakout confirmed
• Long bias maintained unless major invalidation occurs
• Watching retracement levels for entries
• Macro catalyst (Powell resignation) may trigger strong continuation without retrace
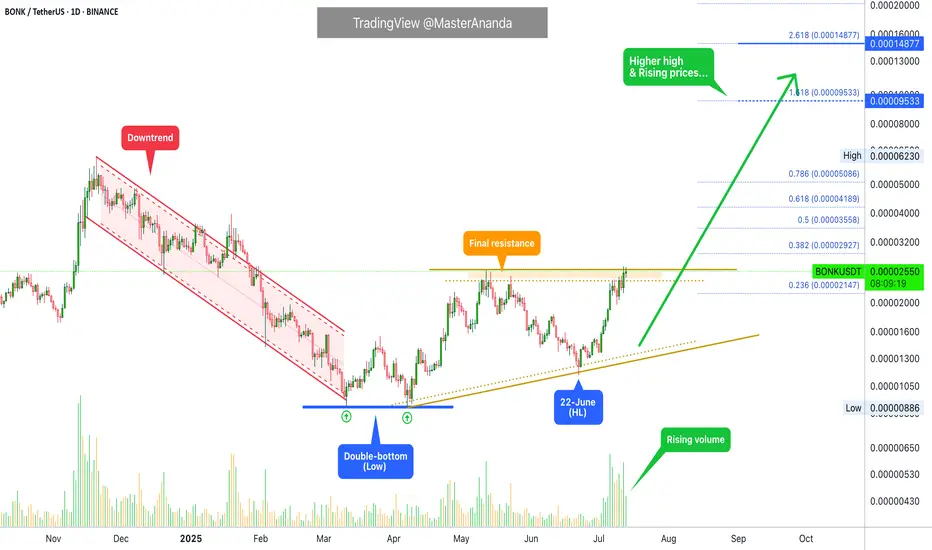
Bonk In A Good Situation, Breaking Resistance & HigherThe market bottom happened 7-April, it was a double-bottom compared to 11-March 2025. The end of a downtrend signals the start of an uptrend, and BONKUSDT started rising next. Resistance was found mid-May, on the twelve. This led to a correction and the correction ended 22-June as a higher low.
Now, between the first low in March and present day we have more than four months. The entire downtrend on the chart lasted 111 days, less than four months. This means that the bullish bias is already bigger in duration compared to the previous bearish wave, and, prices are set to continue higher because BONKUSDT just produced a higher high compared to May. Resistance has been compromised and this is good because it means we can soon experience additional growth.
The path is clear for rising prices. As resistance gets challenged in becomes weaker, as resistance weakens more buy-orders continue to pile up. The more buyers the better the market and then comes a new major high. The advance that is developing now will continue for months and months and months.
Are you ready for huge profits? I hope you are. Crypto is going up!
Namaste.
AIN/USDT : IS THIS THE COIN THAT WILL DO IT?? MOON SHOTAfter analyzing this coin, we’ve identified signals suggesting a potential breakout in the near future. As a result, we will continue monitoring it closely for confirmation.
Once confirmation is established, further updates will be provided below.
follow up the $0,30, expecting as first target
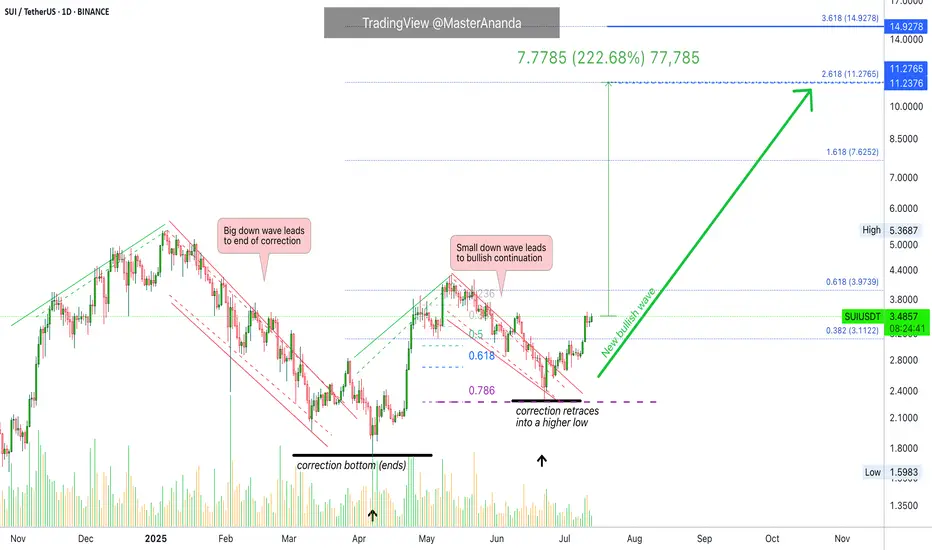
Sui Update · Clearly Moving Towards $7.62, $11.3 & $15The SUIUSDT chart looks great and just today we are witnessing a bullish continuation. Resistance was found 11-July but the market didn't produce any significant retrace. This is obviously because we are ultra-bullish and ultra-bullish can only mean sustained growth.
After the 11-July resistance, one day neutral and now resistance is being challenged again. Based on how Bitcoin is doing, a new all-time high; based on how the market is doing, great; we can expect higher prices in the coming weeks and months.
There will always be swings. Retraces and corrections but the bigger picture is a strong bullish dynamic for months. Think of 4-8 months of prices rising non-stop. That is what you are about to experience. Keeping in mind that the start date is 7-April and not today. So 6-8 months starting early April, growth long-term.
We will have a new all-time high for on this pair. There is huge potential for growth. The target on the chart is an easy one based on the short-term (within 1 month/30 days). After $7.62 we have $11.27 followed by $15. As you can see, it is still early within this bullish wave.
Thanks a lot for your altcoin choice, a great pick.
Your support is appreciated.
Namaste.
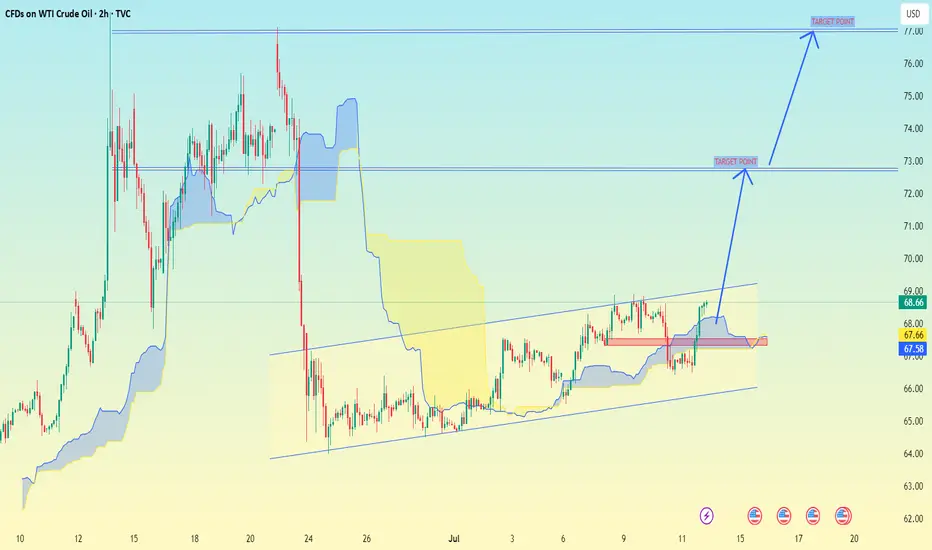
(2-hour timeframe for WTI Crude Oil (USOIL).(2-hour timeframe for WTI Crude Oil (USOIL)), here’s the technical analysis and target zones:
🟦 Key Observations:
Price is trading in an ascending channel.
I'm using the Ichimoku Cloud for trend confirmation.
There are two clear target zones marked with arrows.
---
🎯 Target Levels (as shown on chart):
1. First Target Zone: ~$74.50
This is the intermediate resistance level.
Price is expected to break above ~$69, then head toward this zone.
2. Final Target Zone: ~$76.50–77.00
This is the major resistance area, possibly the upper end of a swing move.
Could be reached if momentum remains strong and no major reversal occurs.
---
📌 Current Price:
$68.66 (Sell) / $68.76 (Buy) — as of the screenshot.
📈 Suggested Strategy (based on the chart setup):
Entry: On breakout above ~$69.00 with volume confirmation.
First TP: ~$74.50
Second TP: ~$76.50–77.00
Stop-Loss: Below the lower channel support (~$66 or tighter, depending on your risk tolerance).
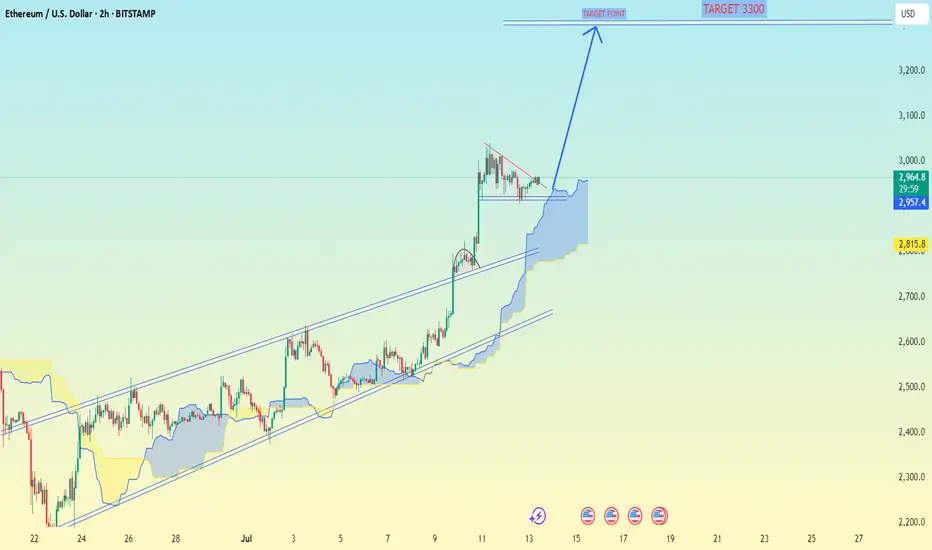
Ethereum (ETH/USD) on the 2-hour timeframe.Ethereum (ETH/USD) on the 2-hour timeframe, here's the analysis and target level:
---
🟦 Chart Observations:
ETH is in a rising channel.
Price is respecting Ichimoku Cloud support.
A bullish breakout pattern is forming (consolidation above the cloud).
My clearly marked "TARGET 3300" at the top.
---
🎯 Target Level:
Primary Target: $3,300
This is the next major resistance and aligns with the top of the projected ascending channel.
Confirmed by your chart annotation.
---
📍 Current Price:
$2,964.3 (Sell) / $2,964.5 (Buy) — as shown in the screenshot.
---
📈 Strategy Suggestion:
Entry: On break above local consolidation / wedge (~$2,980–3,000).
Target: $3,300
Stop-Loss: Below Ichimoku cloud or lower channel (~$2,850 or tighter).
Support Levels to watch:
$2,815 (highlighted on the chart)
$2,700 (lower channel zone)
---
Would you like me to prepare a full trade plan or backtest this setup?